
Spread Walk: Pace vs. Direction
We look at the monthly spread walks for HY and IG across 2023-2024 as a bull market for credit risk will face potholes in 2025.


The wider swings of 2023 credit spread compression gave way to more muted OAS deltas by month in 2024 but still saw HY OAS get back into the June 2007 zone (see HY Spreads: Celebrating Tumultuous Times at a Credit Peak 6-13-24).
The spread compression tights of 2024 were impressive by any measure including gross OAS, quality spread differentials, or proportionate risk premiums as a % UST.
The post-2022 wave was led off by triple-digit tightening across the HY credit tiers in 2023, but the biggest quality spread compression move in 2024 was in the CCC tier chasing impressive lows in the B tier.
Dozens of all-time highs in the S&P 500, some double-digit return months for small caps, healthy banks, a higher quality origination cycle in HY bonds, a heavier weighting of BB tier names, and the migration of the most aggressive private equity deals over to private credit (vs. HY bonds) all supported the sustained tightening (see Annual and Monthly Asset Return Quilt 12-27-24, Credit Returns: 2024 Monthly Return Quilt 12-26-24).
IG OAS stayed tight after starting the year at +104 bps before moving into double digit range. IG OAS saw lower magnitude monthly tightening moves than 2023, but IG OAS was consistently in line or below the 1H04 to 1H07 IG credit cycle peak periods and well inside the +138 bps where 2023 started.

The above chart details the monthly spread walk for HY bonds during 2024. When looking at the spread action across 2024 above and for 2023 in the following chart, some prior credit cycle peaks are worth keeping in mind:
The June 2007 credit cycle: June 2007 started off with HY OAS lows of +241 bps and ended the month of June 2007 at +298 bps. Calendar 2007 ended at +592 bps as turmoil set in. We have looked at the 2007 chaos in numerous other commentaries, and the summer saw the credit markets in suspended animation. Bear Stearns saw management turmoil in the summer and some early hedge fund canaries were hitting the floor. Countrywide was looking for a private sector bailout (BofA rode to the rescue). LBO deals were getting pulled and subprime was turning into gangrene. The year 2024 is definitely not 2007 by banking system structure, regulation, counterparty risk, or asset quality (see Wild Transition Year: The Chaos of 2007 11-1-22). That said, the failure to price in forward risks (for 2025: tariffs, trade wars, mass deportation, spiraling deficit/unbridled UST supply) have some parallels in what – for now – is a steady economy with back-to-back 3% handle GDP growth quarters.
The 1997 credit cycle: Late 1997 is our other go-to period for historical credit cycle peak comparisons. 1997 started with HY spreads in the low 300 bps range and then spent much of the year below the 300 bps line. HY OAS hit a low in Oct 1997 at +244 bps (10-17-24). Calendar year 1997 ended at +296 bps. The year 1998 saw material volatility and credit excess that included a bout of EM contagion and some market education on the systemic risks of excessive counterparty exposure (LTCM). Asia was starting to unravel in late 1997 and would spread to all EM in 1998. The Fed had to bail out the markets with multiple cuts in the fall. Those worked. Then the equity TMT excess got back on track in 1999 (+86% return on NASDAQ), but the credit markets were rolling into the default cycle by late 1999.
The lessons from the credit cycles are that spreads can move very quickly from lows when “life” goes wrong. The problems of prior cycles were triggered by excess in credit. This current selloff potential relates to uncertain trigger risks and would be more tied to near term policy fallout, political risk, and chronic fact denial (e.g., who pays the tariffs). The lofty valuation challenge lurks in the meantime.
Geopolitics is seldom a factor one can trade on, and handicapping cold-to-hot proxy wars is a mug’s game. On the other hand, the risk of trade wars climbs each day and that has a geopolitical overlap (end of NATO, Ukraine fallout, end of WTO, etc.).
Muted HY OAS swings in 2024…
The magnitude of the moves wider in 2024 was restrained. Moves wider hit a max of +20 bps in Jan while the max move tighter was -30 bps in Feb for a net move of -10 bps to start the year. That mild move contrasts with 2023 and many other turning points across the credit cycles. The steady grind tighter in HY from Aug 2024 to Nov 2024 came along with the expectation of sustained easing, declining inflation, and consistently strong economic growth indicators relative to expectations.
The 2023 deltas posted bigger moves both higher and lower with a +36 bps move wider in March 2023 on the regional bank nerves and +39 bps on the peak UST move in Oct 2023 when the 10Y UST just barely missed +5.0% (10-19-23). October 2023 (“Oct 7”) also saw the massive attack on Israel by Hamas, and that brought the Middle East closer to the brink. Israel-Iran will remain a flashpoint for markets as will the role of Trump if Iran tensions cross into “nuke” worries.
Overall, the performance of the equity and credit markets and economic expansion indicators as 2024 wound down would have been cause for praise and celebration if it was not unfolding during a toxified election year (see GDP 3Q24: Final Number at +3.1% 12-19-24).

The above chart revisits the action in 2023 for some frames of reference. The underlying credit market performance in 2023 has been covered in past commentaries (see Credit Performance: Excess Return Differentials in 2023 1-1-24, Return Quilts: Resilience from the Bottom Up 12-30-23, Footnotes & Flashbacks: Asset Returns 1-1-24, Footnotes & Flashbacks: State of Yields 1-1-24).

The above chart shows an impressive, slow, and steady grind tighter in IG OAS as spreads move into the trading range of past credit cycle lows. We see 10 of 12 months tighter.
The IG index is winding down the year around $9.1 trillion in face value and a par-weighted coupon around 4.3%. By way of comparison, back in June 2007 the IG index was $2.0 trillion. The current BBB tier index is around $4.2 trillion. Back in June 2007 that BBB tier balance was modestly over $700 billion and smaller than the A tier.
We update the IG OAS cyclical compare and contrasts routinely, and this is another history where the June 2007 and late 1997 comps work (see Footnotes & Flashbacks: Credit Markets 12-23-24).
A case can easily be made that the banking system is materially safer than 2007 even if just on the basis of counterparty risk in 2007 in some of the most extremely leveraged interconnected derivative markets (notably mortgages and CDS). The absence in 2024 of so many slightly regulated securities firms hitting the daily casino is also a positive structural factor. The biggest brokers now roll up under Bank Holding Companies.
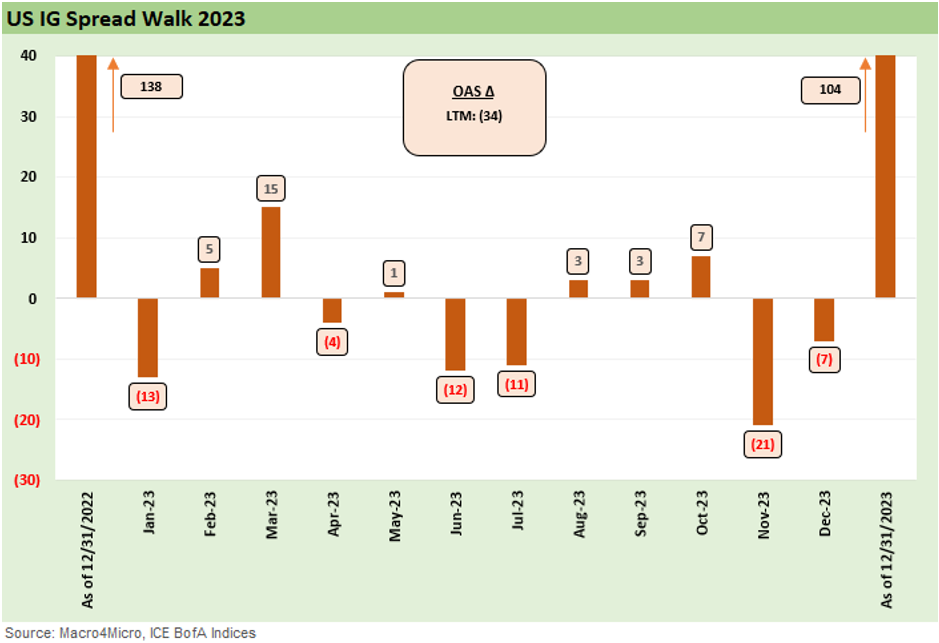
The above chart offers a reminder on the move in IG OAS from +138 bps, or slightly over the long-term median IG OAS of +131 bps, to +104 bps at the end of 2023 and a starting point for 2024. As noted earlier, the IG index saw explosive growth across the ZIRP years but especially in the BBB tier.
As another reminder of past cycles, the +53 bps lows in Oct 1997 for IG OAS saw the end of 1997 close out at +70 bps while June 2007 IG spreads closed out at +100 bps after averaging around the mid-90 handle bps area for much of the month.
Contributors:
Glenn Reynolds, CFA glenn@macro4micro.com
Kevin Chun, CFA kevin@macro4micro.com
See also:
Annual and Monthly Asset Return Quilt 12-27-24
Credit Returns: 2024 Monthly Return Quilt 12-26-24
New Home Sales: Thanksgiving Delivered, What About Christmas? 12-23-24
Footnotes & Flashbacks: Credit Markets 12-23-24
Footnotes & Flashbacks: State of Yields 12-22-24
Footnotes & Flashbacks: Asset Returns 12-22-24
Mini Market Lookback: Wild Finish to the Trading Year 12-21-24
Trump Tariffs 2025: Hey EU, Guess What? 12-20-24
PCE, Income & Outlays Nov 2024: No Surprise, Little Relief 12-20-24
Existing Home Sales Nov 2024: Mortgage Vice Tightens Again 12-19-24
GDP 3Q24: Final Number at +3.1% 12-19-24
Fed Day: Now That’s a Knife 12-18-24
Credit Crib Note: Iron Mountain 12-18-24
Housing Starts Nov 2024: YoY Fade in Single Family, Solid Sequentially 12-18-24
Industrial Production: Nov 2024 Capacity Utilization 12-17-24
Retail Sales Nov24: Gift of No Surprises 12-17-24
Inflation: The Grocery Price Thing vs. Energy 12-16-24
Toll Brothers: Rich Get Richer 12-12-24
CPI Nov 2024: Steady, Not Helpful 12-11-24
Mini Market Lookback: Decoupling at Bat, Entropy on Deck? 12-7-24
Credit Crib Note: Herc Rentals (HRI) 12-6-24
Payroll Nov 2024: So Much for the Depression 12-6-24
Trade: Oct 2024 Flows, Tariff Countdown 12-5-24
JOLTS Oct 2024: Strong Starting Point for New Team in Job Openings 12-3-24
Mini Market Lookback: Tariff Wishbones, Policy Turduckens 11-30-24
3Q24 GDP Second Estimate: PCE Trim, GPDI Bump 11-27-24
New Home Sales Oct 2024: Weather Fates, Whither Rates 11-26-24
Mexico: Tariffs as the Economic Alamo 11-26-24
Tariff: Target Updates – Canada 11-26-24
Mini Market Lookback: Market Delinks from Appointment Chaos… For Now 11-23-24
Credit Crib Note: Ashtead Group 11-21-24
Mini Market Lookback: Reality Checks 11-16-24
Credit Crib Note: United Rentals (URI) 11-14-24
Mini Market Lookback: Extrapolation Time? 11-9-24
The Inflation Explanation: The Easiest Answer 11-8-24
Fixed Investment in 3Q24: Into the Weeds 11-7-24
Select Histories:
Mexico: Tariffs as the Economic Alamo 11-26-24
Tariff: Target Updates – Canada 11-26-24
Tariffs: The EU Meets the New World…Again…Maybe 10-29-24
Trump, Trade, and Tariffs: Northern Exposure, Canada Risk 10-25-24
Trump at Economic Club of Chicago: Thoughts on Autos 10-17-24
HY OAS Lows Memory Lane: 2024, 2007, and 1997 10-8-24
Credit Returns: Sept YTD and Rolling Months 10-1-24
HY Industry Mix: Damage Report 8-7-24
Volatility and the VIX Vapors: A Lookback from 1997 8-6-24
HY Pain: A 2018 Lookback to Ponder 8-3-24
Presidential GDP Dance Off: Clinton vs. Trump 7-27-24
Presidential GDP Dance Off: Reagan vs. Trump 7-27-24
The B vs. CCC Battle: Tough Neighborhood, Rough Players 7-7-24
HY Spreads: Celebrating Tumultuous Times at a Credit Peak 6-13-24
Credit Markets Across the Decades 4-8-24
Credit Cycles: Historical Lightning Round 4-8-24
Histories: Asset Return Journey from 2016 to 2023 1-21-24
Credit Performance: Excess Return Differentials in 2023 1-1-24
Return Quilts: Resilience from the Bottom Up 12-30-23
HY vs. IG Excess and Total Returns Across Cycles: The UST Kicker 12-11-23
HY Multicycle Spreads, Excess Returns, Total Returns 12-5-23
US Debt % GDP: Raiders of the Lost Treasury 5-29-23
Wild Transition Year: The Chaos of 2007 11-1-22
Greenspan’s Last Hurrah: His Wild Finish Before the Crisis 10-30-22