
Credit Returns: 2024 Monthly Return Quilt
As we gear up for a 2025 with very tight spreads as a starting point, we look back by tier and by month as food for thought.


Policy sprint to win a reshoring marathon?!
2024 saw a solid economy, the potential for a very rare back-to-back years with the S&P 500 returns over 20% (not seen since the Clinton years and TMT boom and never seen in the 1980s), a disappointing UST curve move relative to the consensus view to start 2024, and the ugliest election since 1860. After all that, 2025 begins with high multiples and tight spreads.
The bond math for excess returns is challenging enough at current spreads, but the policy changes dead ahead (measured now in a few weeks to “Day 1” promises) in the form of high tariffs (on our largest trade partners), mass deportation, and slamming the Federal employee base will translate into multiplier effects that will mean uncertain macro risk ahead once it gets real. Decisions will get made in the real economy not based on the hopes of policy architects.
For the UST challenge and how that flows into many sectors (notably homebuilding, real estate, and capital budgeting cost assumptions), the laws of supply and demand will play a role in UST curve expectations (high, steep, etc.) just as tariff-induced price impacts will be a basic cause-and-effect matter for goods with the inherent risk evident in any attempt to demolish low cost sourcing alternatives that companies have built over decades.
Risk appetite stayed high after a very bullish finish to 2023…
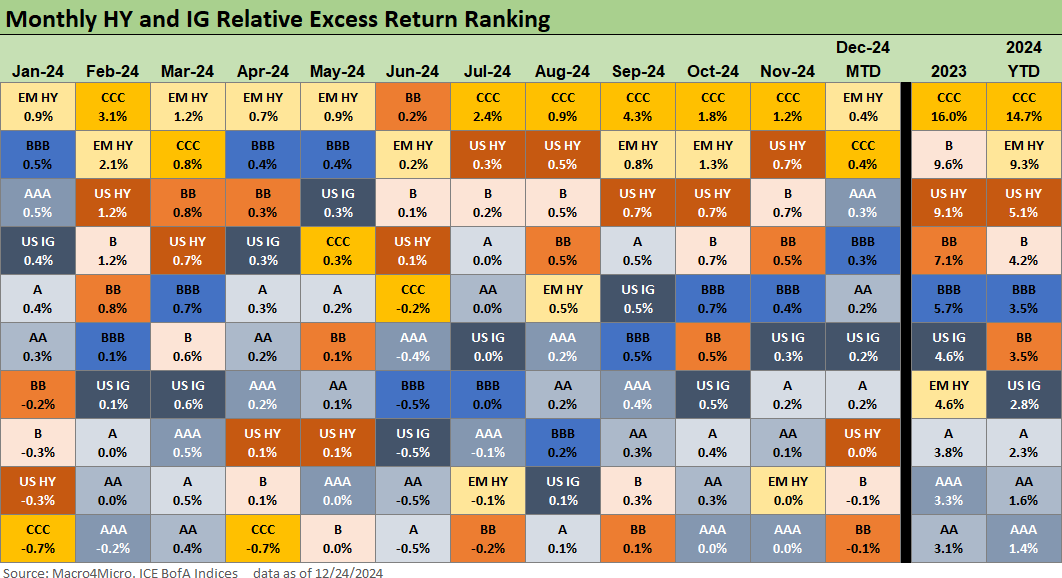
The above chart tells a simple story – credit risk maximization won during 2024. That happened more evenly in 2024 than in 2023, when the monster UST and spread rally of Nov-Dec 2023 carried the day. The BBB vs. BB story is one we looked at in our recent commentary Footnotes & Flashbacks: Credit Markets 12-23-24. The convergence of excess returns there stands out.
During 2023, the B tier ran to a +341 bps OAS after -174 bps tightening for the year (see Credit Performance: Excess Return Differentials in 2023 1-1-24, Return Quilts: Resilience from the Bottom Up 12-30-23). We have covered the price action across the years and various histories (see links at bottom). The main takeaway in the current credit market backdrop is that HY OAS currently is around June 2007 and late 1997 levels, and that pricing backdrop shifts the risk-reward symmetry into a negative bias for HY (see HY OAS Lows Memory Lane: 2024, 2007, and 1997 10-8-24, HY Spreads: Celebrating Tumultuous Times at a Credit Peak 6-13-24 ).
The silver lining in HY is that it takes a hefty dose of spread widening to offset the coupon and push HY into negative excess returns for a HY bond. We believe the current spreads are unsustainable at sub-300 bps levels for US HY. The HY market is two bad months away from being where 2023 ended, which was also well inside long-term medians. The HY asset class remains an excellent long-term core allocation when considering reinvestment and compounding and intrinsic cash flow generating ability of the sector. At this point in the credit cycle and the realities of the risk pricing profile, however, HY is not an attractive add.
The inevitable question of “Where do you go?” gets some help from 4% handles on 3M UST (above 4.3% this morning), but that ties into the broader asset allocation game plan and portfolio parameters and income needs. That also gets back to the issue of time horizons, income strategies, and where you are positioned along the credit spectrum. That is a topic for other commentaries.
Income assets during an easing cycle will remain a major debate into 2025 as will duration. We are 100 bps above the lows in the 10Y UST. For income, we have been in an out of BDC stocks in a dividend and income focused portfolio, but the asset quality questions in the private credit sector is no picnic right now. Manager selection has seen winners and losers. We mostly reduced our exposure to BDCs by then end of 2024 even just given our own sensitivity on the damage tariffs and deportation will eventually do to the macro picture. We will see how that unfolds in early 2025.
The HY bond market has seen mild default rates and expectations than in past cycles, and the headlines on dicey deals and distressed exchanges have moved over into the loan-only markets and private credit with the private equity connection. HY bonds did not get the heavy mix of late cycle aggressive deals seen in past cycles.
We also see recurring headlines around small business bankruptcies on the high cost of loans and the lingering pain from the inflation bout and ensuing tightening cycle. That is when the asset allocation language can get blurred when talking generic “credit risk” vs. HY bonds.
UST curve spoiled the party for total returns…
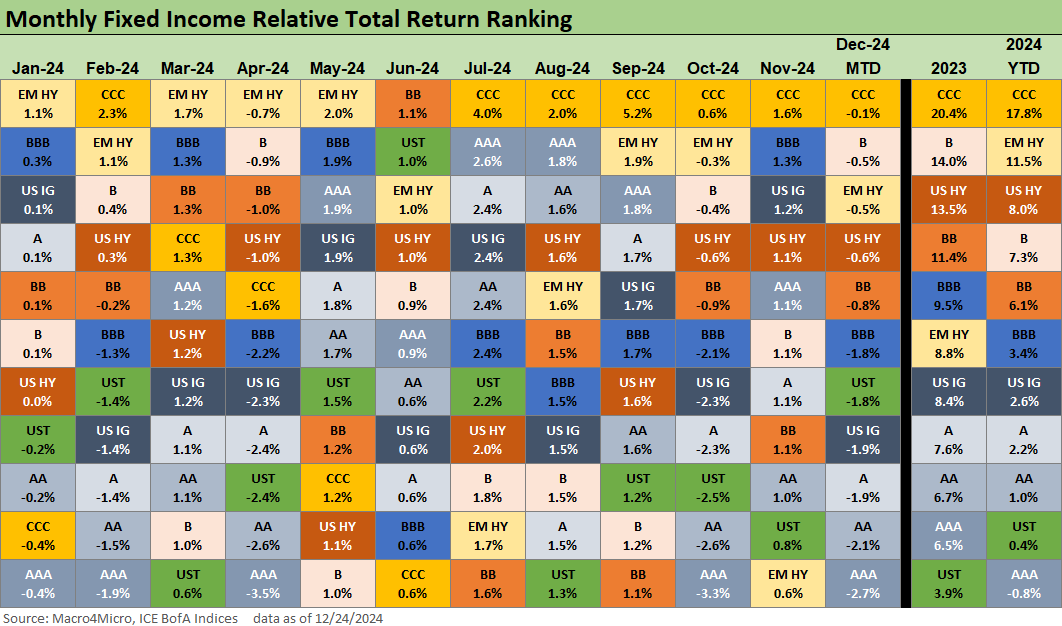
The above chart highlights the rougher time that total returns have faced in 2024 relative to the bullish finish of 2023. As covered routinely in the weekly Footnotes publication on credit markets and asset returns (see Footnotes & Flashbacks: Asset Returns 12-22-24), the balancing act of spread tightening and coupon returns has been a running give-and-take with essentially a bear steepening of the UST curve unfolding as the crow flies in 2024.
Duration has been the victim overall in 2024. We had the dip down to 3.6% in the 10Y UST with the start of easing by the Fed in Sept, but then it was back to steepening and rising in longer maturities (see Footnotes & Flashbacks: State of Yields 12-22-24). The long duration AAA sector came in negative YTD in total returns.
As we go to print this morning, we see just over 4.6% for the 10Y UST at 1220 p.m. with the 2Y UST at 4.35% and 30Y UST at 4.78%
Glenn Reynolds, CFA glenn@macro4micro.com
Kevin Chun, CFA kevin@macro4micro.com
See also:
New Home Sales: Thanksgiving Delivered, What About Christmas? 12-23-24
Footnotes & Flashbacks: Credit Markets 12-23-24
Footnotes & Flashbacks: State of Yields 12-22-24
Footnotes & Flashbacks: Asset Returns 12-22-24
Mini Market Lookback: Wild Finish to the Trading Year 12-21-24
Trump Tariffs 2025: Hey EU, Guess What? 12-20-24
PCE, Income & Outlays Nov 2024: No Surprise, Little Relief 12-20-24
Existing Home Sales Nov 2024: Mortgage Vice Tightens Again 12-19-24
GDP 3Q24: Final Number at +3.1% 12-19-24
Fed Day: Now That’s a Knife 12-18-24
Credit Crib Note: Iron Mountain 12-18-24
Housing Starts Nov 2024: YoY Fade in Single Family, Solid Sequentially 12-18-24
Industrial Production: Nov 2024 Capacity Utilization 12-17-24
Retail Sales Nov24: Gift of No Surprises 12-17-24
Inflation: The Grocery Price Thing vs. Energy 12-16-24
Toll Brothers: Rich Get Richer 12-12-24
CPI Nov 2024: Steady, Not Helpful 12-11-24
Mini Market Lookback: Decoupling at Bat, Entropy on Deck? 12-7-24
Credit Crib Note: Herc Rentals (HRI) 12-6-24
Payroll Nov 2024: So Much for the Depression 12-6-24
Trade: Oct 2024 Flows, Tariff Countdown 12-5-24
JOLTS Oct 2024: Strong Starting Point for New Team in Job Openings 12-3-24
Mini Market Lookback: Tariff Wishbones, Policy Turduckens 11-30-24
3Q24 GDP Second Estimate: PCE Trim, GPDI Bump 11-27-24
New Home Sales Oct 2024: Weather Fates, Whither Rates 11-26-24
Mexico: Tariffs as the Economic Alamo 11-26-24
Tariff: Target Updates – Canada 11-26-24
Mini Market Lookback: Market Delinks from Appointment Chaos… For Now 11-23-24
Credit Crib Note: Ashtead Group 11-21-24
Mini Market Lookback: Reality Checks 11-16-24
Credit Crib Note: United Rentals (URI) 11-14-24
Mini Market Lookback: Extrapolation Time? 11-9-24
The Inflation Explanation: The Easiest Answer 11-8-24
Fixed Investment in 3Q24: Into the Weeds 11-7-24
Select Histories:
Mexico: Tariffs as the Economic Alamo 11-26-24
Tariff: Target Updates – Canada 11-26-24
Tariffs: The EU Meets the New World…Again…Maybe 10-29-24
Trump, Trade, and Tariffs: Northern Exposure, Canada Risk 10-25-24
Trump at Economic Club of Chicago: Thoughts on Autos 10-17-24
HY OAS Lows Memory Lane: 2024, 2007, and 1997 10-8-24
Credit Returns: Sept YTD and Rolling Months 10-1-24
HY Industry Mix: Damage Report 8-7-24
Volatility and the VIX Vapors: A Lookback from 1997 8-6-24
HY Pain: A 2018 Lookback to Ponder 8-3-24
Presidential GDP Dance Off: Clinton vs. Trump 7-27-24
Presidential GDP Dance Off: Reagan vs. Trump 7-27-24
The B vs. CCC Battle: Tough Neighborhood, Rough Players 7-7-24
HY Spreads: Celebrating Tumultuous Times at a Credit Peak 6-13-24
Credit Markets Across the Decades 4-8-24
Credit Cycles: Historical Lightning Round 4-8-24
Histories: Asset Return Journey from 2016 to 2023 1-21-24
Credit Performance: Excess Return Differentials in 2023 1-1-24
Return Quilts: Resilience from the Bottom Up 12-30-23
HY vs. IG Excess and Total Returns Across Cycles: The UST Kicker 12-11-23
HY Multicycle Spreads, Excess Returns, Total Returns 12-5-23
US Debt % GDP: Raiders of the Lost Treasury 5-29-23
Wild Transition Year: The Chaos of 2007 11-1-22
Greenspan’s Last Hurrah: His Wild Finish Before the Crisis 10-30-22