
Industrial Production: Nov 2024 Capacity Utilization
We see another mild fade in industry capacity utilization, but the big story lies ahead as tariff day approaches.


Warning Will Robinson! Tariffs approaching!
Industrial production was off by -0.1 after posting -0.4 in October, and that in turn saw the various moving parts translated into a slight decline in Total Industry Capacity Utilization rates (77.0% to 76.8%) but a slight sequential rise in Manufacturing (75.9% to 76.0%).
Manufacturing is running below the first 3 quarters of 2024 and well below the 78.3% average of 1972-2023.
Durables ticked higher on the back of favorable increases in Motor Vehicles/Parts and an uptick in Machinery while Aerospace and Nondurables declined.
The trick from here will be what type of inventory building actions and order rates will prevail in Dec 2024 and Jan 2025 ahead of “Tariff D-Day 1” under Trump as supplier chains could end up under the tariff knife.
Peter Navarro was on CNBC this morning terming EV support dead when Trump takes the helm and Navarro takes the wheel as a senior counselor and de facto Manufacturing and Trade Czar. The forward risks to the manufacturing sector remain uncertain since it is still about the cycle, tariffs, retaliation, supplier chain impacts, and whether a very strong dollar will pile on the inevitable export challenge.

The above chart updates the time series for Manufacturing capacity utilization as the current 76.0% runs below the long-term median from 1967 of 78.7%. We include some other timeline medians in the box within the table, and the current 76.0% only beats the July 2009 to Jan 2020 period median, which reflects the slow demand and jobs recovery from the systemic crisis.
Oct 2024 saw a higher decline (Industrial Production: Capacity Utilization Circling Lower 11-15-24), so the pressure remains modest but with some material policy decisions ahead around the North American supplier-to-OEM chain (Mexico and Canada) as well as critical Asian supplier chains. The working capital management decisions would seem to encourage as much inventory building as possible to get in under the tariff wire, but there are lag times in orders and deliveries with OEMs facing different schedules than Tier 1, 2 and 3 suppliers depending on where they are located (international vs. domestic).
The problem with supplier chains is that many are highly vulnerable to even a few suppliers “breaking.” That can unsettle OEM production schedules (notably in motor vehicles but also in areas such as pharma (ingredients) and aerospace and defense (critical metals). The OEM might need to stall or slow down production. That outcome then reverberates back along the entire chain.
The risk of supplier chain disruption was a well-worn path in auto supplier chain financial stress in the 2007-2009 period. This tariff threat is a variation on that theme. Simplistic repetitive recitation by the pro-tariff policy advocates (“we did not have inflation in 2018-2019”) typically leave out lots of facts and the bad side effects (the things that led the FOMC to ease in 2019). They also seem to forget lag times and the COVID X factor.
These debates will start anew in 2025 with a lot more scrutiny and a much better learning curve for those who will need to defend their policies against critics. The real-world test beckons and is dead ahead depending on what gets implemented.

The above chart updates the capacity utilization numbers for the high-level categories. They are self-explanatory with Total Industry off slightly on declines in Mining and Utilities while Manufacturing hung in with a slight uptick on Durables, which was sequentially higher.
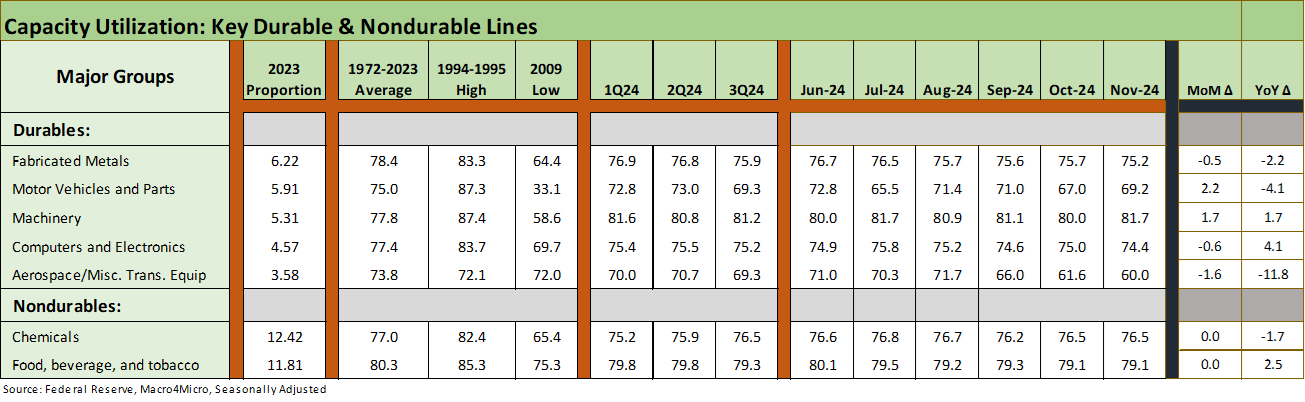
The above chart updates the largest groups under Durables and Nondurables. Durables are more interesting with 3 of the Top 5 down, but the Nondurables leaders were flat. Motor Vehicles popped sequentially as did Machinery. Fabricated Metals, Computers and Electronics, and Aerospace declined among the 5 largest durable sectors. Aerospace has been especially volatile YoY with Boeing strikes, production delays/disruptions, and just a relative crash landing at the #1 aerospace company and a leading US exporter.

The above chart updates the capacity utilization medians across the timelines of historical expansions and recessions. Each cycle - whether expansion or recession - has its own set of dynamics and industry divergence stories from manufacturing to durables and nondurables and various commodity-based groups.
The ability of more industries to operate very profitably at lower cap ute levels comes down to pricing power and unit cost management by producers. Various industries overhauling efficiency and the increased use of tech vs. labor has made a big difference for many industries in lowering breakeven volumes (a sibling of cap ute). A big part of the lower cost story has been reliance on low-cost global sourcing options. All of this will be in for a big shakeup under the policies being bandied about.

The above chart offers another angle on median capacity utilization levels across expansions and recessions lined up from lowest to highest. The early 1970s was the peak with 1973 as the last of the great booms with steel humming and the Detroit 3 in charge of autos with GM as king.
Then came the late 1973 oil embargo on the way into what would then become the longest recession since the Great Depression before the post-crisis recession of Dec 2007 to June 2009 (see Business Cycles: The Recession Dating Game 10-10-22). The 1974 to 1982 period was one of gut-wrenching change in manufacturing with the 1980-1982 double dip especially brutal.
See also:
Footnotes & Flashbacks: State of Yields 12-15-24
Footnotes & Flashbacks: Asset Returns 12-15-24
Mini Market Lookback: Macro Grab Bag 12-14-24
Toll Brothers: Rich Get Richer 12-12-24
CPI Nov 2024: Steady, Not Helpful 12-11-24
Mini Market Lookback: Decoupling at Bat, Entropy on Deck? 12-7-24
Credit Crib Note: Herc Rentals (HRI) 12-6-24
Payroll Nov 2024: So Much for the Depression 12-6-24
Trade: Oct 2024 Flows, Tariff Countdown 12-5-24
JOLTS Oct 2024: Strong Starting Point for New Team in Job Openings 12-3-24
Mini Market Lookback: Tariff Wishbones, Policy Turduckens 11-30-24
PCE Inflation Oct 2024: Personal Income & Outlays 11-27-24
3Q24 GDP Second Estimate: PCE Trim, GPDI Bump 11-27-24
New Home Sales Oct 2024: Weather Fates, Whither Rates 11-26-24
Mexico: Tariffs as the Economic Alamo 11-26-24
Tariff: Target Updates – Canada 11-26-24
Mini Market Lookback: Market Delinks from Appointment Chaos… For Now 11-23-24
Credit Crib Note: Ashtead Group 11-21-24
Existing Home Sales Oct 2024: Limited Broker Relief 11-21-24
Housing Starts Oct 2024: Economics Rule 11-19-24
Mini Market Lookback: Reality Checks 11-16-24
Retail Sales Oct 2024: Durable Consumers 11-15-24
Credit Crib Note: United Rentals (URI) 11-14-24
Mini Market Lookback: Extrapolation Time? 11-9-24
The Inflation Explanation: The Easiest Answer 11-8-24
Fixed Investment in 3Q24: Into the Weeds 11-7-24
Morning After Lightning Round 11-6-24