
Credit Returns: Sept YTD and Rolling Months
We look at the 3Q24 monthly lead-in to the 4Q24 period after strong YTD performance in credit with some big moving parts ahead.


Pricing election risk has a wide range of outcomes…
We look at total returns and excess returns across the 3Q24 period for each month in a period that gave the YTD return profile renewed strength as duration got back on track after a very strong end to 2023 in both duration and spreads gave hope for better times.
We also look at the credit spread walk from 4Q23 through 3Q24 as credit markets avoided any lasting selloffs in 3Q24 despite the early August noise.
The Nov-Dec 2023 HY credit spread tightening is sill the main event over the past year for spreads in the -100 bps tightening from the end of 3Q23 to the end of 3Q24.
The -103 bps of Nov-Dec 2023 tightening after starting 4Q23 at a 400 bps handle (+403 bps) was a big slice of the LTM compression.
When it comes to fixed income returns from the UST asset class, across IG and then down into the riskier credit tiers of HY and EM, the period through the end of Sept 2024 came up strong. The recurring debates around soft landings, contraction scenarios, and a wave of evolving risk factors are still in play around tariffs, mass deportations side effects, and such offshore issues as geopolitics (read “war”) and China tension (Taiwan) beyond those risks we see on the screen today in the Middle East.
With the election dead ahead and global harmony not at imminent risk of breaking out in Ukraine, Israel, or in the lingering Cold War tension of China/Taiwan, there will be no shortage of the same items on the checklist into the 4Q24 period. More immediately there will be the post-election drama that will inevitably unfold as to “Who won the election?” After all, the actual vote count is secondary to the election discussion these days in a fact-free world. Then comes the debt ceiling battle, which will be a risk proportionate to uniform party alignment in the House of Reps and White House.
A quick run-through on returns…
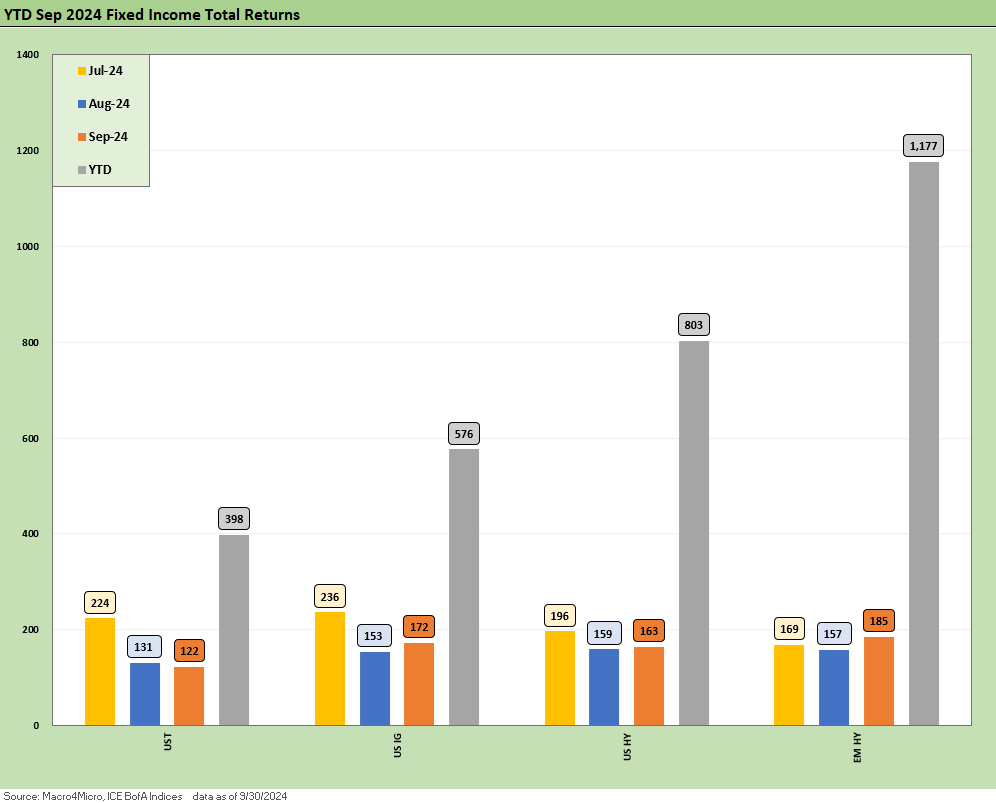
The above chart updates total returns for the main bond asset classes. We look at each month of the quarter and for the YTD period. We break out UST, IG, HY and EM HY. After torturing the “6 Fed cuts” expectations of the UST bulls for much of the year, duration finally joined the party as payroll doubts spread and the dual mandate changed the calculus.
The FOMC finally took action in the face of the Mother-of-all-Inversions on the front end and sustained progress on CPI and PCE. The shelter price dynamics and sticky Services inflation is slowing the process down, but the consumer has shown resilience as manufacturing limps along.
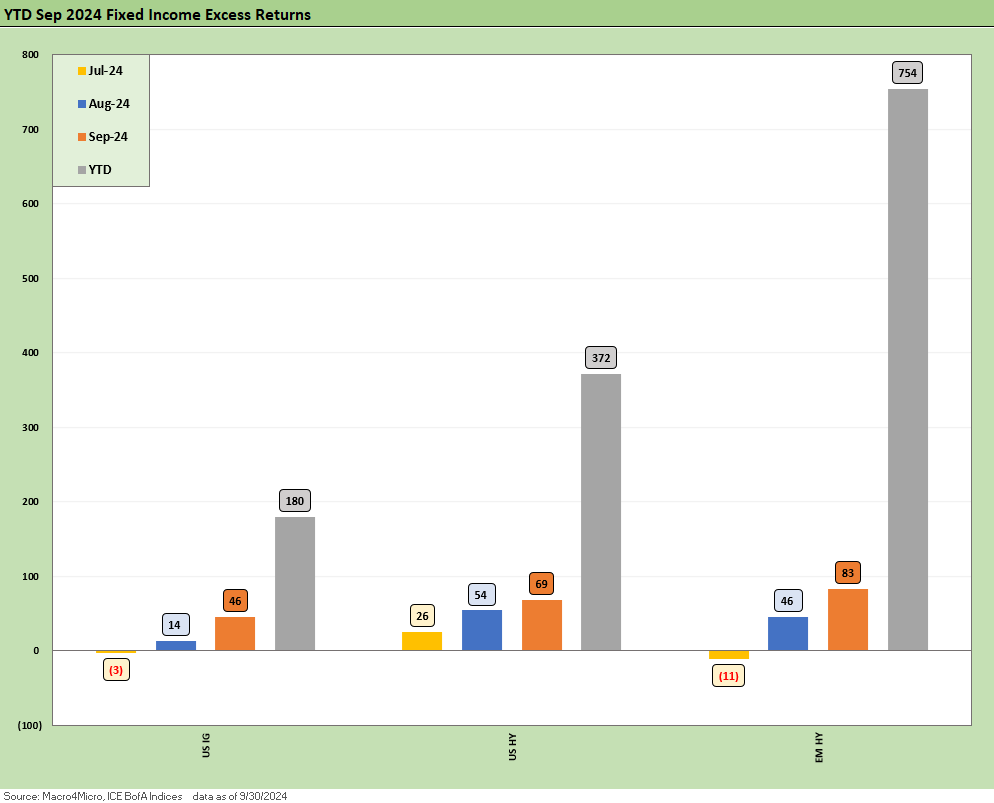
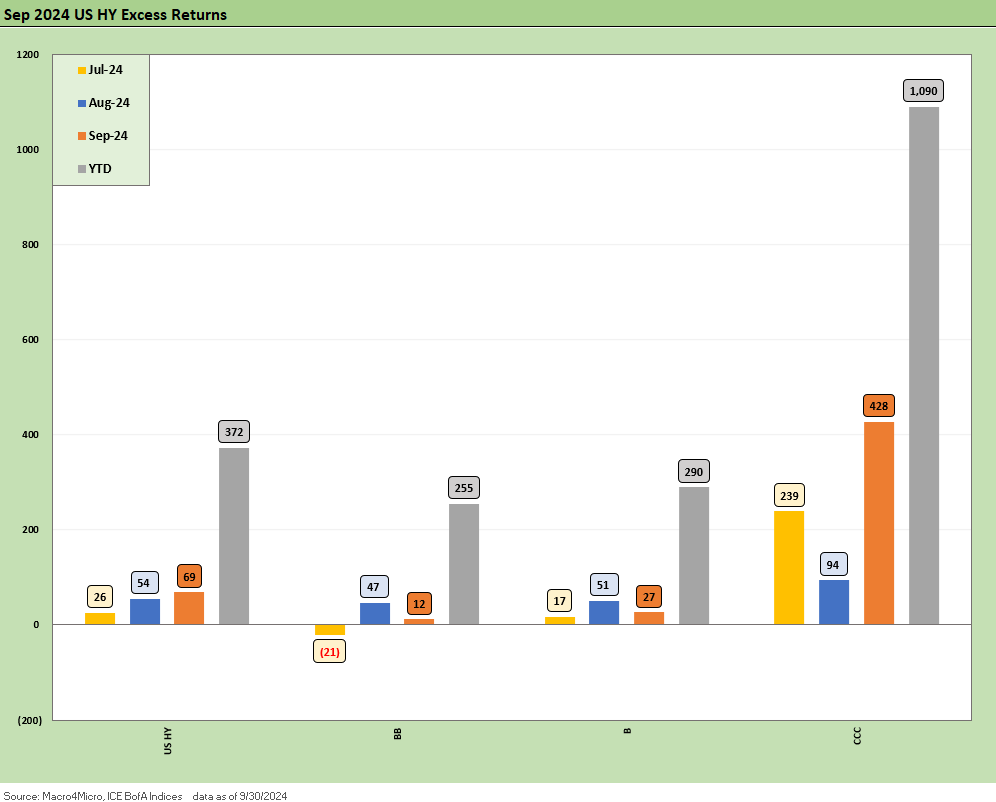
As we shift to excess returns, we see EM HY as the clear winner with US HY as a solid performer also. The 3Q24 months are rolling along and taking YTD excess returns for HY at 2X the IG YTD excess returns. The relative positions across the credit markets in total returns finish will turn on whether the 10Y UST will in fact chase fed funds and drive duration returns. The current 3.7% 10Y UST level out the curve is extremely low in historical context of non-ZIRP periods (see Footnotes & Flashbacks: State of Yields 9-29-24). Running from 3.7% to the low 3% range is a big ask outside a recession scenario.
IG allocation attracted those playing a mix of credit and the curve…
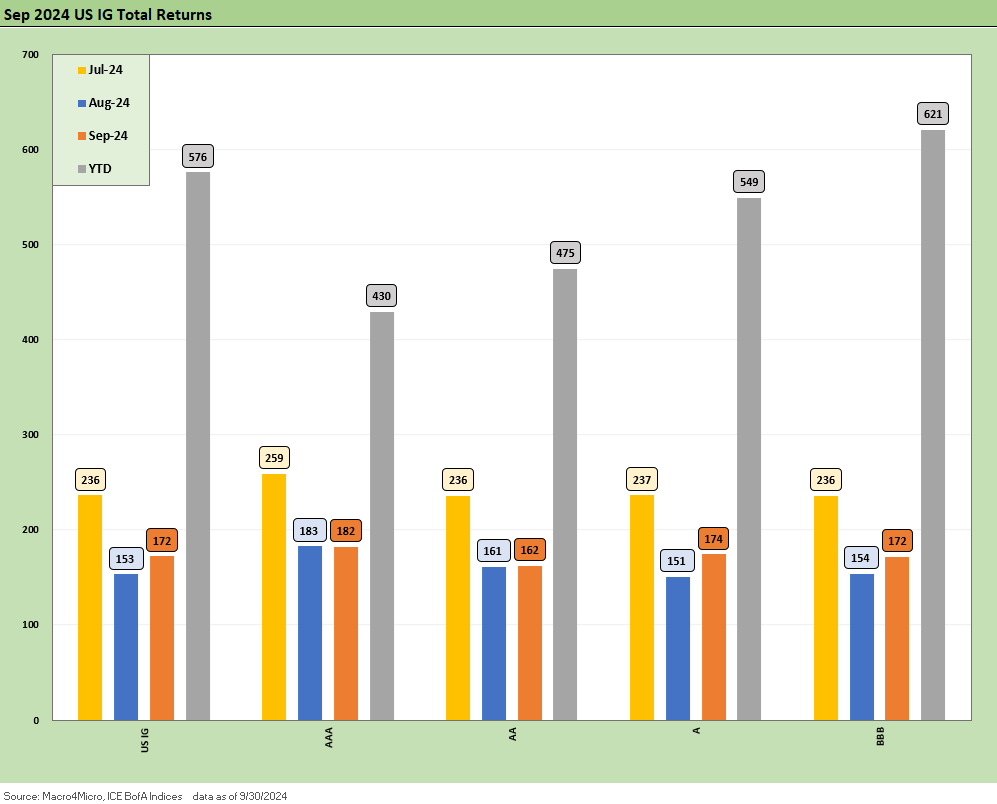
The above chart offers a closer look at total returns across the IG credit tiers. The BBB tier wins on a rational combination of duration and excess returns as we detail below.
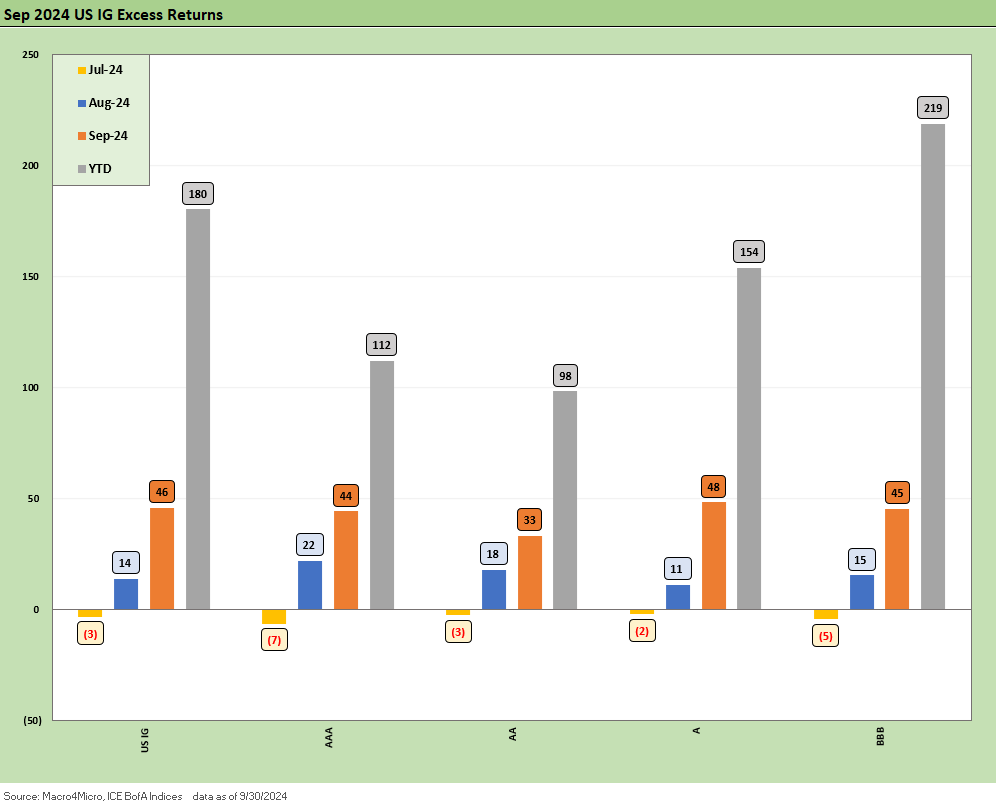
The IG excess return pattern is in rational order for the meat of the IG credit lineup in the A and BBB tier. The long duration AA tier (duration 9.2) has its share of measurement quirks, but you are not buying the AAA tier for credit risk.
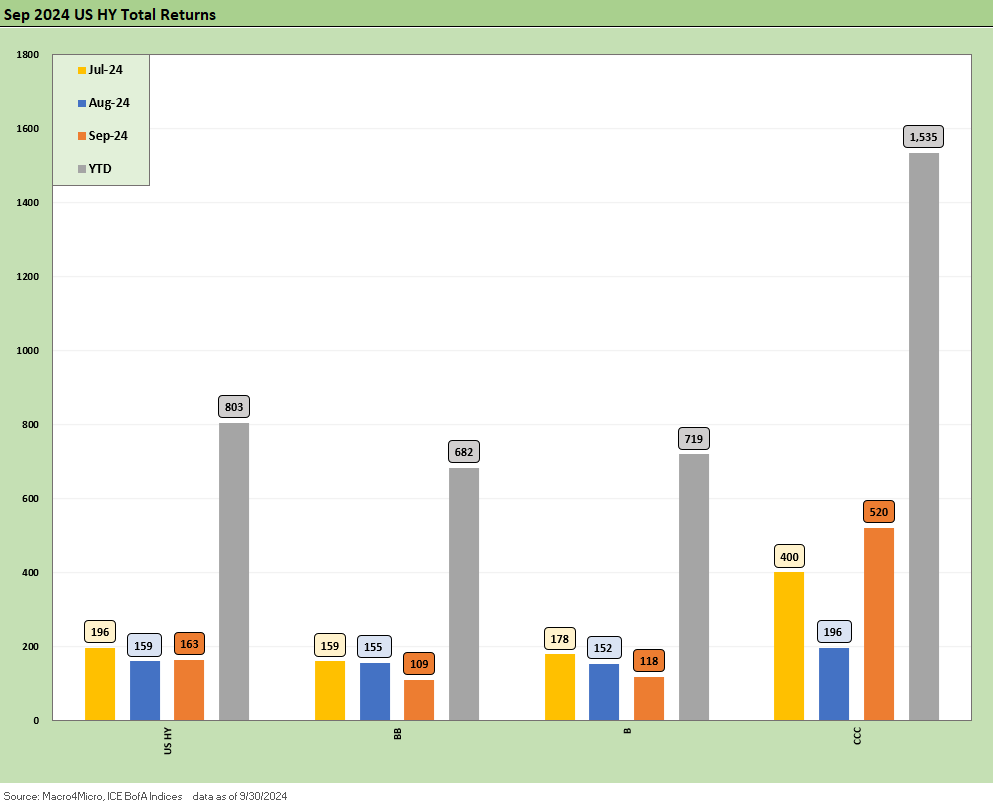
HY total returns across the tiers are broken out above across the months of 3Q24 and for the YTD period. The BB and B tiers are likely too close for relative value comfort at this point, and the same is true for the BB vs. BBB excess returns (see earlier IG chart with credit tiers).
We see what a major winner the CCC tier has been in this market even if those 10 points (points, not bps!) of excess returns come with a lot of constituent idiosyncrasies, CCC tier drop-ins and drop-outs, and distressed exchanges. Those moving parts can distort the spread deltas, but the main takeaway is that all the credit tiers have been solid performers in the speculative grade range (see Footnotes & Flashbacks: Credit Markets 9-30-24).
LTM HY Spreads dominated by Nov-Dec 2023…
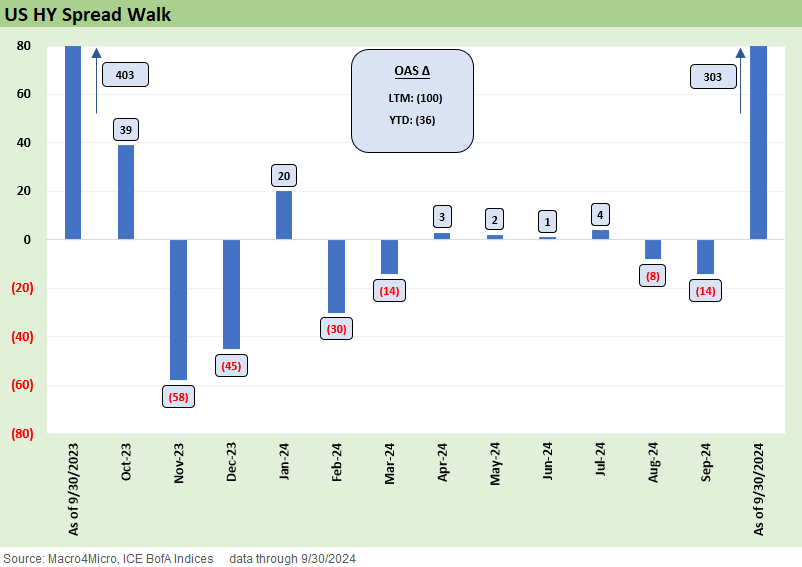
The above chart looks back across the trailing 1 year by month. We saw consistent good news or “no news” along the way with a very impressive rally in 4Q23 including -103 bps of tightening in Nov-Dec 2023. That set the stage for a mixed start in 2024 that stepped up the pace in 3Q24 as FOMC optimism setting the stage for what is likely to be a wild finish with election noise and some geopolitics that could go in any direction from here. Through 9 months, the -36 bps of HY OAS tightening is respectable with the UST curve finally kicking in with some duration support later in the year.
We usually put a period like the one we are entering under the heading of “wide range of potential outcomes.” For now, the market is willing to say “call me when we get there” around items such as widespread tariffs, trade clashes, mass deportations, and the specter of a debt ceiling fuse burning into Jan 2025.
For those of us who have been around a while, this election presents the highest stakes by far with autocracy a legit risk and the use of military to put down demonstrations not a “sticks and stones” name-calling exercise (dictator etc.). This is not Nixon vs. Humphrey vs. Wallace in 1968 (in the interest of disclosure, my parents voted for 2 of the 3 and not for Humphrey).
IG spreads remain in the traditional credit peak zone…
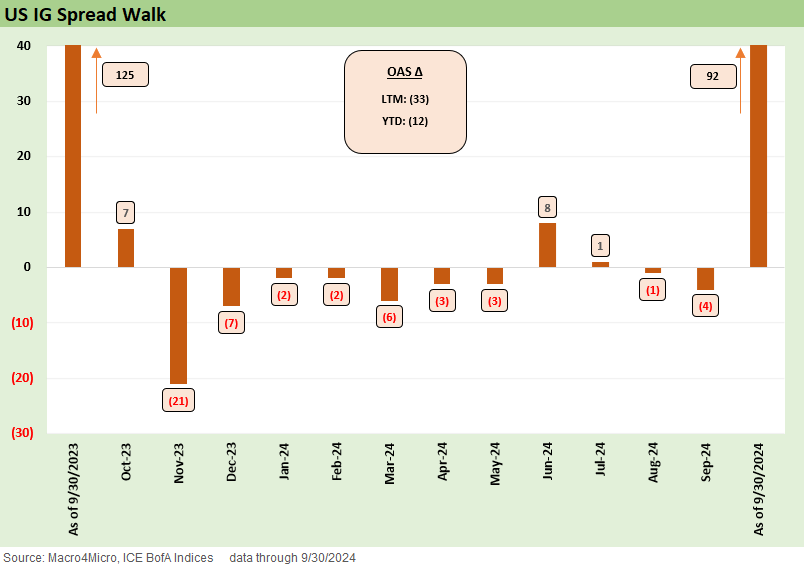
The above spread walk for IG shows a respectable run from the start of 4Q23 with -33 bps of tightening LTM and -12 bps YTD for IG OAS. Once you get into the low to mid 90s range for IG OAS, that backdrop of reminiscent of periods from period credit peaks in the late 1990s and the credit peak (and eventual bubble) of 1H04 to 1H07 (see Footnotes & Flashbacks: Credit Markets 9-23-24). We know how that 2007 one ended (!), but the health of the US banking system and level of counterparty exposure is very different and much heathier today.
Glenn Reynolds, CFA glenn@macro4micro.com
Kevin Chun, CFA kevin@macro4micro.com
See also:
JOLTS Aug 2024: Openings Up, Hires Down, Layoffs Down, Quits Rate Down 10-1-24
Footnotes & Flashbacks: Credit Markets 9-30-24
Footnotes & Flashbacks: Asset Returns 9-29-24
Footnotes & Flashbacks: State of Yields 9-29-24
Mini Market Lookback: PCE Tailwinds, GDP Holds Serve 9-28-24
State Level Economic Reality Check: Employment, GDP, Personal Income 9-28-24
PCE Prices Aug 2024: Personal Income & Outlays 9-27-24
KB Home: Steady Growth, Slower Motion 9-26-24
Durable Goods Aug 2024: Waiting Game 9-26-24
2Q24 GDP: Final Estimate and Revision Deltas 9-26-24
New Home Sales Aug 2024: Waiting Game on Mortgages or Supply? 9-25-24
Lennar: Bulletproof Credit Despite Margin Squeeze 9-23-24
Footnotes & Flashbacks: Credit Markets 9-23-24
Footnotes & Flashbacks: State of Yields 9-22-24
Footnotes & Flashbacks: Asset Returns 9-22-24
Mini Market Lookback: FOMC Week 9-21-24
FOMC Action: Preemptive Strike for Payroll? 9-18-24
Home Starts Aug 2024: Mortgage Rates to Kickstart Hopes Ahead? 9-18-24
Retail Sales: Down to the Wire? 9-17-24
Industrial Production: Aug 2024 Capacity Utilization 9-17-24
Consumer Sentiment: Inflation Optimism? Split Moods 9-13-24
CPI Aug 2024: Steady Trend Supports Mandate Shift 9-11-24
August 2024 Payrolls: Slow Burn, Negative Revisions 9-6-24