
Annual and Monthly Asset Return Quilt
The year in total returns was all about equities as the #1 ranking included 3 double digit months before limping home in Dec.


What are the questions around what already has happened?
As we look back across the asset returns of past months and years, we thought we should invoke Johnny Carson’s Carnac character even if just to say there is always more than a single question to match up against so many complex moving parts. The periods captured in the return quilts that follow include some major bouts of volatility (the word “vol” implies upside and downside).
During 2024, we had more bouts to the upside than downside with Tech as usual distinguishing itself on the back of the Mag 7. More surprisingly, we saw Financials and the Russell 2000 putting up some big winnings with some overlap of financials in the small cap results. It was easier to be bullish on large financials than regional banks, but the latter also did quite well after so many jaded views on commercial real estate exposure and the March 2023 crisis memories.
In the first chart, we look back at the timeline of monthly returns across the lineup of asset classes and equity benchmarks. We rank them for each month of 2024. We then rank annual returns for each year since 2008. Do they tell a story? The chart uses a range of asset classes and benchmark proxies with a heavy mix of ETFs for ease of comparison and updates.
We detail the tickers and mix below:
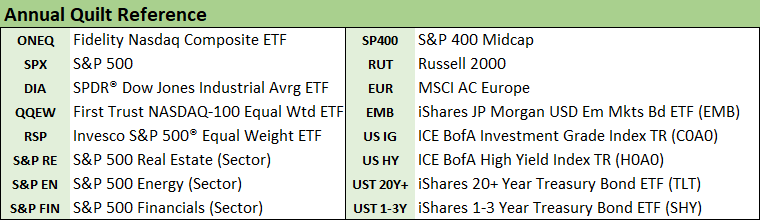
The goal in the mix was to cover the range of equities as well as a full spectrum of credit risk tiers. In the first chart we look back at the monthly details starting on Dec 2023 as that year ended with a massive rally in debt and equities. The second chart looks back at annual returns from 2008 as Bush handed off a cascading systemic bank crisis to Obama along with a few bellwether industrial meltdowns (notably Autos) on the way to a March 2009 S&P 500 low and June 2009 cyclical trough.
The monthly rankings in 2024…

The rankings run from Dec 2023 to Dec 2024 (YTD 12-26-24). The Russell 2000 small caps posted 3 double-digit months starting with Dec 2023, another in July 2024 when HY spreads hit lows, and another in Nov 2024 as HY spreads were rocking to new, lower credit spread lows (see Mini Market Lookback: Wild Finish to the Trading Year 12-21-24). November soon gave way to some chaos in December as the FOMC weighed in with revised 2025 guidance and equities and duration hit some turbulence evident in the above chart (see Fed Day: Now That’s a Knife 12-18-24).
Scanning the returns and rankings across the months offers a reminder of what powered a very strong year for equities in 2024 following a very good year in 2023 that ended with a monster Dec rally in equities as well as favorable moves in the UST curve supporting duration.
The only 2024 month that weighed in with a negative return in the #1 spot was April when the Mag 7 got roughed up, UST was roiled, and the Middle East was getting very messy (see Footnotes & Flashbacks: Asset Returns 4-21-24). Even with periodic bouts of volatility, when the lower end months post 2% returns, you know it is a good year. The year 2024 saw 7 months at 5% or higher and 3 months at 10% or higher.
The annual rankings from 2008…

The above chart updates the annual rankings across multiple asset classes and benchmarks from 2008 through YTD 2024 (12-26-24). The annual total return numbers are at least objective indicators in a world where such items tend to get set aside in the interest of partisan falsehoods and deflections from basic facts. If you just picked two crucial indicators for the markets (equity performance) and economic trends (GDP growth), the obvious conclusions could be very different around “who achieved what and when.”
As you look at the winning benchmarks and ETFs across the years, the one year that stands out as a bad one in the mix is 2018, where basically everything below cash (not shown, but also less than +2%) and below the short UST 1Y-3Y ETF (SHY) was negative. That is a grim year considering the tax plan, low inflation, and low unemployment.
We often reference 2018 since that was the year of NAFTA 2.0 which became USMCA was agreed upon (effective after final national legislative approval in 2020). It was also the first year after the Dec 2017 record tax cuts and a year when tariffs served as a dominant theme that flowed into the aggressive tariff action of 2019 (see Histories: Asset Return Journey from 2016 to 2023 1-21-24, HY Pain: A 2018 Lookback to Ponder 8-3-24)
We would love to see a policy discussion take place with the White House economics team, who could face some corporate media personalities with basic economic skills and market knowledge (they tend to hang out around Loch Ness). The economics could get grilled on each of the above years and what happened in each year. The problem there is the interviewers would not ask tough questions and would not know what to ask in follow-up. Inspiring times.
We have looked at the periods leading into the Bush-to-Obama transition in some of the histories in Macro4Micro (see links for Histories at the bottom) and worked through them in prior lives (see Credit Markets Across the Decades 4-8-24, Credit Cycles: Historical Lightning Round 4-8-24). The 2007 to 2008 transition was one for the ages (see Wild Transition Year: The Chaos of 2007 11-1-22).
The layers of events, policy actions (monetary or fiscal), and reverberating effects cut across the direct and indirect. We find the 2018-2019 transition very relevant to 2025 and what is soon to unfold in tariffs, deportation and trade partner retaliation. The set of asset returns above in 2018 demand some consideration when the period is billed by Trump as the “greatest economy in history.” The same is true in considering why the FOMC eased in 2019 (aka came to the rescue) to relieve the pressure on weak exports and soft corporate investment.
Glenn Reynolds, CFA glenn@macro4micro.com
Kevin Chun, CFA kevin@macro4micro.com
See also:
New Home Sales: Thanksgiving Delivered, What About Christmas? 12-23-24
Footnotes & Flashbacks: Credit Markets 12-23-24
Footnotes & Flashbacks: State of Yields 12-22-24
Footnotes & Flashbacks: Asset Returns 12-22-24
Mini Market Lookback: Wild Finish to the Trading Year 12-21-24
Trump Tariffs 2025: Hey EU, Guess What? 12-20-24
PCE, Income & Outlays Nov 2024: No Surprise, Little Relief 12-20-24
Existing Home Sales Nov 2024: Mortgage Vice Tightens Again 12-19-24
GDP 3Q24: Final Number at +3.1% 12-19-24
Fed Day: Now That’s a Knife 12-18-24
Credit Crib Note: Iron Mountain 12-18-24
Housing Starts Nov 2024: YoY Fade in Single Family, Solid Sequentially 12-18-24
Industrial Production: Nov 2024 Capacity Utilization 12-17-24
Retail Sales Nov24: Gift of No Surprises 12-17-24
Inflation: The Grocery Price Thing vs. Energy 12-16-24
Toll Brothers: Rich Get Richer 12-12-24
CPI Nov 2024: Steady, Not Helpful 12-11-24
Mini Market Lookback: Decoupling at Bat, Entropy on Deck? 12-7-24
Credit Crib Note: Herc Rentals (HRI) 12-6-24
Payroll Nov 2024: So Much for the Depression 12-6-24
Trade: Oct 2024 Flows, Tariff Countdown 12-5-24
JOLTS Oct 2024: Strong Starting Point for New Team in Job Openings 12-3-24
Mini Market Lookback: Tariff Wishbones, Policy Turduckens 11-30-24
3Q24 GDP Second Estimate: PCE Trim, GPDI Bump 11-27-24
New Home Sales Oct 2024: Weather Fates, Whither Rates 11-26-24
Mexico: Tariffs as the Economic Alamo 11-26-24
Tariff: Target Updates – Canada 11-26-24
Mini Market Lookback: Market Delinks from Appointment Chaos… For Now 11-23-24
Credit Crib Note: Ashtead Group 11-21-24
Mini Market Lookback: Reality Checks 11-16-24
Credit Crib Note: United Rentals (URI) 11-14-24
Mini Market Lookback: Extrapolation Time? 11-9-24
The Inflation Explanation: The Easiest Answer 11-8-24
Fixed Investment in 3Q24: Into the Weeds 11-7-24
Select Histories:
Mexico: Tariffs as the Economic Alamo 11-26-24
Tariff: Target Updates – Canada 11-26-24
Tariffs: The EU Meets the New World…Again…Maybe 10-29-24
Trump, Trade, and Tariffs: Northern Exposure, Canada Risk 10-25-24
Trump at Economic Club of Chicago: Thoughts on Autos 10-17-24
HY OAS Lows Memory Lane: 2024, 2007, and 1997 10-8-24
Credit Returns: Sept YTD and Rolling Months 10-1-24
HY Industry Mix: Damage Report 8-7-24
Volatility and the VIX Vapors: A Lookback from 1997 8-6-24
HY Pain: A 2018 Lookback to Ponder 8-3-24
Presidential GDP Dance Off: Clinton vs. Trump 7-27-24
Presidential GDP Dance Off: Reagan vs. Trump 7-27-24
The B vs. CCC Battle: Tough Neighborhood, Rough Players 7-7-24
HY Spreads: Celebrating Tumultuous Times at a Credit Peak 6-13-24
Credit Markets Across the Decades 4-8-24
Credit Cycles: Historical Lightning Round 4-8-24
Histories: Asset Return Journey from 2016 to 2023 1-21-24
Credit Performance: Excess Return Differentials in 2023 1-1-24
Return Quilts: Resilience from the Bottom Up 12-30-23
HY vs. IG Excess and Total Returns Across Cycles: The UST Kicker 12-11-23
HY Multicycle Spreads, Excess Returns, Total Returns 12-5-23
US Debt % GDP: Raiders of the Lost Treasury 5-29-23
Wild Transition Year: The Chaos of 2007 11-1-22
Greenspan’s Last Hurrah: His Wild Finish Before the Crisis 10-30-22