
PCE, Income & Outlays Nov 2024: No Surprise, Little Relief
The release was on the lighter side of PCE price consensus but +2.4% headline and +2.8% Core is flattish sequentially.


The PCE price index YoY of +2.4% headline ticked higher from +2.3% in Oct while Core PCE was flat at +2.8%. The MoM numbers ticked lower to 0.1% headline PCE (vs. +0.2% Oct) and to +0.1% Core (vs. +0.3% Oct), so the very recent PCE inflation trend is going the right way.
It was a strange week for inflation dynamics and the UST curve after the FOMC meeting and dot plot sent the UST curve steeper and higher in 10Y UST. This morning’s PCE relief sent longer UST into a mini-rally but still higher on the week (see Fed Day: Now That’s a Knife 12-18-24, Footnotes & Flashbacks: State of Yields 12-15-24).
The 11th hour Trump-Musk push to basically scrap the debt ceiling out past midterm elections raised a lot of UST supply anxiety to add to the handicapping of what tariffs and inflation will mean in a potential hit to household purchasing power. Last night at 1 a.m., Trump threw some threats at the EU into the mix to add to the drama already seen with Canada and Mexico (see Trade: Oct 2024 Flows, Tariff Countdown 12-5-24, Tariff: Target Updates – Canada 11-26-24, Mexico: Tariffs as the Economic Alamo 11-26-24)
Even if everyone fixates on the PCE price index in this release, the Personal Income and Outlays information is the main body of content, and we see current dollar Disposable Personal Income (DPI) lower MoM and down in chained dollars but Consumption (PCE) ticking higher MoM in real and chained terms, sending the saving rates slightly lower to +4.4%.
There is no shortage of crosscurrents that will be on the front and back burner with the latest PCE and CPI numbers quickly forgotten since there was not explicitly bad news (see CPI Nov 2024: Steady, Not Helpful 12-11-24, PCE Inflation Oct 2024: Personal Income & Outlays 11-27-24).
The real action lies ahead with tariffs and mass deportation. At least this week ducked any more bad news from the PCE release to pile on to the chaos of the latest FOMC dot plot and the budget deficit signals (and thus UST supply) being sent by Trump as he looks to escape any debt ceiling restraints.
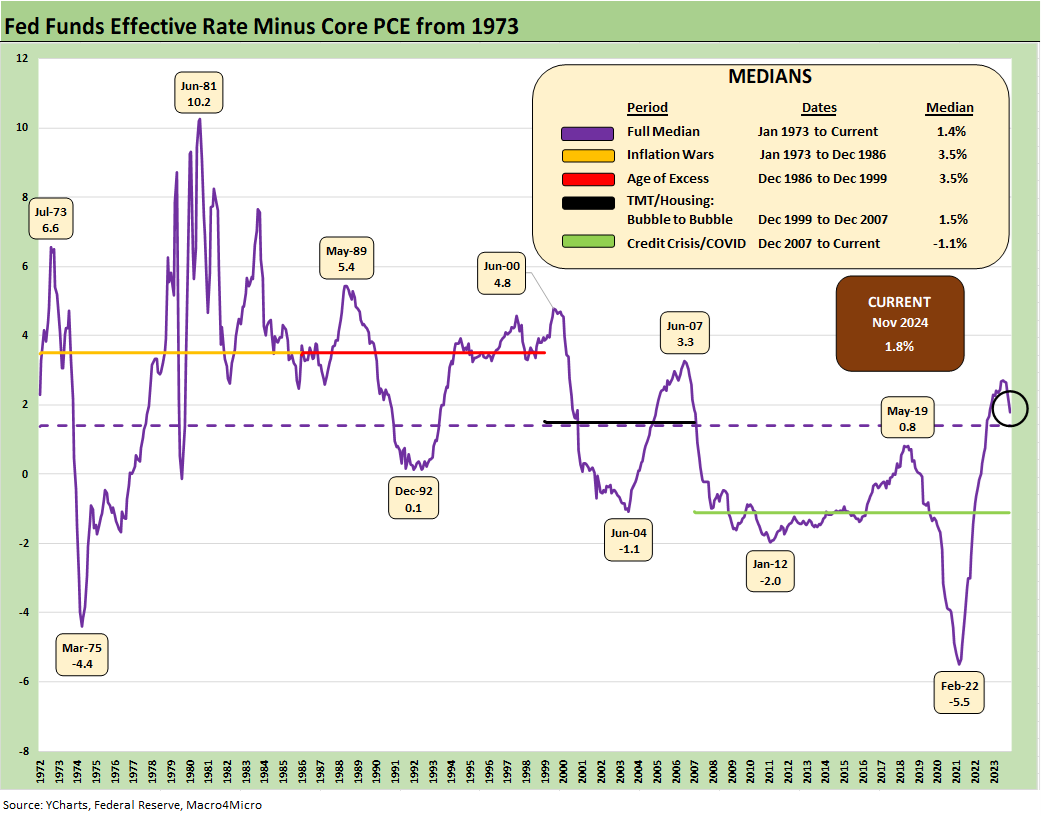
As FOMC policy gets debated, the topic of real fed funds comes up less than it used to back in 2022 when the tightening cycle saw fed funds falling short of inflation by an unhealthy amount that essentially added up to “accommodation” in economic substance. There were many in the market calling for a pause during 2022 when the real fed funds was still negative (see Fed Funds vs. PCE Price Index: What is Normal? 10-31-22). The same was true vs. CPI (see Fed Funds-CPI Differentials: Reversion Time? 10-11-22).
We have come a long way since 2022 as noted in the above chart. Inflation is way down and the fed funds level is gradually declining. The current differential of 1.8 points is where easing bulls can come up with some ammo to highlight the unnatural shape of the front-end inversion with much lower inflation and in a steady manageable expansion (that is manageable until we see trade wars and outsized tariffs).
We look at the inversion and shapeshifting histories in our weekly Footnotes publication on yields. The simple idea is that flat to upward sloping is the normal state of affairs. Lower fed funds is getting the front end of the market there, and the UST rallied with the PCE numbers but remains materially higher than the Sept lows out the curve with the 10Y UST just under 4.5% as we go to print vs. 3.6% in Sept. We will be updating the weekly UST wrap in our Footnotes publications that we post on the weekend.

The above time series updates the headline PCE vs. Core PCE levels since the stagflationary 1970s. We see a long-term median of +2.6% in headline and +2.4% in Core vs. the current 2.4% headline and 2.8% Core.
With respect to Headline vs. Core, we saw Trump go into a moonwalk recently on Food inflation and his promise to reduce the price of “groceries” (see Inflation: The Grocery Price Thing vs. Energy 12-16-24). Meanwhile, his drill, drill, drill mantra is supposed to send Energy into deflation mode.
We saw threats to the EU overnight from Trump saying they had to buy all their energy from the US. That ability to export more crude and LNG gets swept up in his threats against Canadian crude oil and China tariffs and his expected Russia policies (global supply). There are also these guys called OPEC who have a say. There is not a lot of supply and demand intellectual consistency at work when he sprays the globe with tariff threats. There is also the matter of the upstream industry cooperating in a planned oversupply strategy to cure all inflation ills.
As we regularly detailed across time, Food inflation can go higher and lower but rarely ever deflates to an earlier starting point (e.g. 2021 levels). Prices in the grocery aisle are not going back to where they were for many reasons from labor to operating costs (freight logistics, packing costs, power, electricity, etc.) to the pricing behavior of large branded packaged goods companies and a long list of other factors. Econ professors in the 1970s would often dump that under the banner of inflation being quick to rise but “sticky on the downside.”
As someone who grew up in a house with a lot of canned vegetables, it is not as easy as supply and demand to dictate the aisle prices when it comes to branded, packaged goods, but it is important. Supply-demand is obviously a big part of the equation. Anyone can just check on the eggs section in the aisles (We think they blamed Biden for avian influenza and the death of a generation of chicks).

The above chart updates the Headline PCE and Core PCE differential. The 0.0% differential is tied to food and energy prices with both having a role to play along the path. Energy was the curse of 2022 with the Ukraine invasion and supply-demand panic in global oil LNG and natural gas broadly in Europe. You seldom if ever heard “Russia” in the partisan inflation talking points. The long-term median of 0.0% shows that PCE and Core PCE essentially converge with energy being the most volatile across time, but Food is also a major factor in the 1970s stagflation.

When we shorten up the Headline PCE and Core timeline to a start date in 1997, we see the distortion of the demand shocks after the systemic crisis of late 2008 and later COVID make it possible for both PCE metrics to post a median below 2.0%. That offers a reminder of how hard it is to get prices under that 2.0% target. The longer timeline posted in the earlier chart did not get to 2.0%. All you need is a few major crises that need a monetary and fiscal rescue.

The above chart plots MoM Disposable Personal Income vs. PCE as a read on how wild things got during and right after the pandemic peak. This is a replay chart we use each month to flag the DPI swings that came with the three COVID relief/stimulus packages with two under Trump and one under Biden.
As a reminder, Trump signed the CARES Act in March 2020 (shows up in the DPI in April 2020) and Trump also signed the Dec 2020 legislation disbursed in Jan 2021 (he never seems to mention that one!). Biden signed the America Rescue Plan (disbursed in March 2021). The DPI and PCE wave tied to each of those shows up in the chart above.
The vaccine had just been announced in early Nov 2020. That was soon a factor in PCE patterns and lag effects. The typical blame game from some is to lay all the cause-and-effect on the March 2021 disbursement. The idea is that a single stimulus plan signed by Biden in early 2021 was the cause of all inflation. That is a mix of partisan and dumb and certainly “politically axed.”
That Biden plan certainly made things worse from the demand side. The invasion of Ukraine by Russia in Feb 2022 also drove the ensuing spike in inflation to a June 2022 CPI high of 9.1%. The omission approach to the causes of inflation and price increases will come up again in 2025 given the tariff plans (buyer pays, what then?) and labor shocks (deportation and wage fallout).
Debates without a winner are typical in inflation history. People still debate who to blame for the bouts of 1970s/early 80s inflation decades later. Nixon? Ford? Carter? Arab Oil? M1/M2/M3?). A generation of econ Professors have moved on (most of them actuarially). This coming tariff and deportation price and inflation debate will be no different.
The positions on tariffs and prices will be set early (probably in advance) and the explanations will be unlikely to change as events unfold. Higher prices are often tied to higher costs when pricing power exists (that should merit a “duh”), but economists tend to stand based on where they sit in Washington. It is “facts and concepts by affiliation” these days.
Our memory bank to the 1970s tends to point at supply-demand imbalances as the natural explanation (oil, food especially). Maybe gasoline rationing was a hint? If only they slowed monetary growth, the gas line would be shorter? The “money supply only crowd” is not as loud now as they used to be, but those discussions never get resolved anyway. Citing money supply gets you to derail a supply and demand and supplier chain discussion that you are probably losing.

The above table is a checklist for framing the monthly DPI vs. PCE swings from 2019 to this latest release. Watching where sustained PCE moves occurred relative to income can be useful for the direction of the consumer cycle vs. more defensive saving.
The Real PCE growth YoY was +2.9% vs. Real DPI growth of +2.6%, so the consumer keeps spending ahead of income growth. Both were down from the Oct YoY numbers.
For this latest month. PCE was slightly ahead of DPI trends. Across the YTD 2024 period, we see 8 months with PCE higher than DPI, 2 with DPI higher than PCE, and one even. That paints a picture of a bullish consumer sector but also one that is “dropping the plastic” and clicking on Amazon a little too often.
The trend in 2024 feeds the theory that PCE stomachs will get full, indigestion will set in, and/or we could be heading to asset quality problems. As we cover in the next chart, savings rates can be volatile across cycles, and we are down from a 5% handle in the spring to the current low 4% range.

The above time series looks back at the savings rate, and it is a study in consumer exuberance and consumer stress across different periods of employment, wages, inflation, and cyclical conditions since the early 1970s.
The current 4.4% is well below the long-term median. Peaks such as 1975 (right after the end of a serious recession and brutal stagflation) and 1981 (the double dip recession, stagflation, and Volcker rate spike) and 1992 (the original “it’s the economy stupid” leading to Clinton victory) are long-ago story lines.
The more recent savings rate lows in June 2022 came in the month of peak inflation in this current cycle and speak to the price pressure and affordability challenges while 2005 arguably could be linked to extreme habits in the time of subprime and blank check mortgage credit lines and a false sense of home equity wealth effects (125% LTVs anyone?).
See also:
Existing Home Sales Nov 2024: Mortgage Vice Tightens Again 12-19-24
GDP 3Q24: Final Number at +3.1% 12-19-24
Fed Day: Now That’s a Knife 12-18-24
Housing Starts Nov 2024: YoY Fade in Single Family, Solid Sequentially 12-18-24
Industrial Production: Nov 2024 Capacity Utilization 12-17-24
Retail Sales Nov24: Gift of No Surprises 12-17-24
Inflation: The Grocery Price Thing vs. Energy 12-16-24
Footnotes & Flashbacks: State of Yields 12-15-24
Footnotes & Flashbacks: Asset Returns 12-15-24
Mini Market Lookback: Macro Grab Bag 12-14-24
Toll Brothers: Rich Get Richer 12-12-24
CPI Nov 2024: Steady, Not Helpful 12-11-24
Mini Market Lookback: Decoupling at Bat, Entropy on Deck? 12-7-24
Credit Crib Note: Herc Rentals (HRI) 12-6-24
Payroll Nov 2024: So Much for the Depression 12-6-24
Trade: Oct 2024 Flows, Tariff Countdown 12-5-24
JOLTS Oct 2024: Strong Starting Point for New Team in Job Openings 12-3-24
Mini Market Lookback: Tariff Wishbones, Policy Turduckens 11-30-24
PCE Inflation Oct 2024: Personal Income & Outlays 11-27-24
3Q24 GDP Second Estimate: PCE Trim, GPDI Bump 11-27-24
New Home Sales Oct 2024: Weather Fates, Whither Rates 11-26-24
Mexico: Tariffs as the Economic Alamo 11-26-24
Tariff: Target Updates – Canada 11-26-24
Mini Market Lookback: Market Delinks from Appointment Chaos… For Now 11-23-24
Credit Crib Note: Ashtead Group 11-21-24
Mini Market Lookback: Reality Checks 11-16-24
Credit Crib Note: United Rentals (URI) 11-14-24
Mini Market Lookback: Extrapolation Time? 11-9-24
The Inflation Explanation: The Easiest Answer 11-8-24
Fixed Investment in 3Q24: Into the Weeds 11-7-24
Morning After Lightning Round 11-6-24