
Payroll Nov 2024: So Much for the Depression
Payroll heads into the last month of the year with a full plate and policy uncertainty ahead in early 2025.


We are still adding jobs? What about the Oct Depression?
Only a month after the soon-to-be-victorious candidate dubbed the October jobs report as signs of a “depression,” we appear to be on the other side of the “crisis” a month later as Sept and Oct are revised higher, a major strike ends, weather improves, and broad hiring continues.
The reaction for those with inflation worries focused on the +4.0% hourly wage growth YoY and the +0.4% MoM at a time when the market is staring down a potential major labor force disruption from mass deportation starting in early 2025. The impact will depend on what Stephen Miller’s strike force does with its “shock and awe” plan in gross numbers and by region.
The Household Survey vs. Establishment Survey differences got airtime again with the path to the 4.2% unemployment rate including a -193K decline in the civilian labor force (to 168.3 million) and a 161K increase in unemployed (to 7.14 million) that was accompanied by a -355K decline in the total employed to 161.1 million. In contrast, the SAAR Establishment Survey payroll total rose by +227K to 159.3 million.
Among notable job stats outside the usual major service line swings (Health Care at +54K, Leisure and Hospitality at +53K) was Government payrolls at +33K (entirely State and Local), and Transportation equipment at +32K (Boeing strike over) comprising more than 100% of the very weak manufacturing adds.
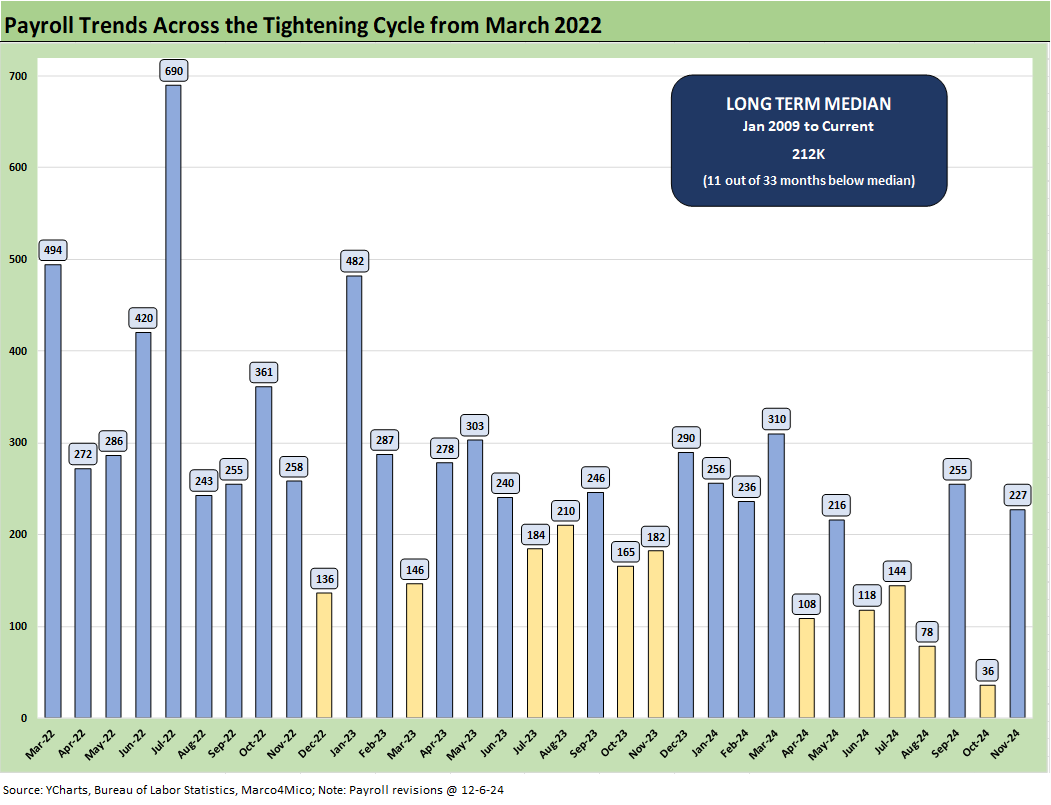
The above chart plots the monthly job adds from March 2022, which is when ZIRP ended and the tightening cycle kicked into gear. The+227K is back above the median adds of +210K seen since Jan 2009 although it comes with the asterisk of the strike add-backs and storm setbacks. People can debate what the normalized number is, but if you deduct 75K to 100K the adds move back in the zone of various rolling averages seen in recent stretches.
We heard more than a few comments that we are in a 125K to 150K type of job adds market that is not inflationary despite the +4.0 YoY earnings growth. The worry is that if you start tightening up the supply with mass deportation, the services inflation with so much low-cost labor is going to see labor imbalances driving wages higher.
The other part of the “indirect labor pressure” is that punitive tariffs on the “labor arb” of Mexico via tariffs (or China in a variation on that theme), and buyers of products will see gross margin pressure that will need price offsets or will face lower margins. That is not ideology but rather double-entry accounting, or one of the Newtonian finance laws.

The above chart updates the time series for the unemployment rate vs. job adds since Jan 2009 when the systemic crisis was in full swing. That was on the way to a lagging 10.0% unemployment rate and very slow recovery of payroll as the shock worked its way through the system in a ZIRP and QE world.
We separated some of the worst of the COVID impacts in the box within the chart to protect the visuals of the swings across the cycles from 2009. We would highlight the Jan 2009 plunge of -820K as the world was melting down. COVID of course is in a class by itself. We also highlight the 3.4% low for unemployment in April 2023.

The above chart updates the time series for the U-3 unemployment rate and U-6 structural underemployment rate across the years from 1994. The current U-3 rate of +4.2% ticked higher sequentially from 4.1%. The U-3 is up from +3.7% last year on a SAAR basis. That offers some easy data points on the softer payroll trends.
As a reminder, the U-6 metric is defined with the numerator as “total unemployed + persons marginally attached to the labor force + total employed part time for economic reasons.” The denominator is “civilian labor force + workers marginally attached to the labor force.”
The U-6 ticked higher sequentially to 7.8% from 7.7%, and that is well above the 6% handles seen in spring of 2023 and 7.0% in Nov 2023 on a SAAR basis. If we use “not seasonally adjusted” numbers, the U-6 is up from 6.7% in Nov 2023 to 7.4% in Nov 2024.
Overall, payrolls are going in the wrong direction for households with this mix of metrics, but that is not a recession risk at low 4% unemployment rates. In the 1990s that would be considered full employment.

The above chart posts the “U-6 minus U-3” differential as a frame of reference. The current 3.6% differential is below the post-1994 median of 4.0%. The March 2009 and Sept 2011 peaks in the 7% area show the cyclical pain and weak employment backdrops. COVID is a radical outlier.
The Sept 2011 period was during a fresh dip into systemic fears on global sovereign and bank worries. March 2009 marked the stock market lows and was a few months ahead of the recession bottom in June 2009. In the chart, one notable trend is how well employment metrics held in during the 2022 tightening cycle.

The above chart updates the total payroll numbers against the unemployment rate from Jan 1972. The chart shows the dramatic swings across time during some ugly periods such as the late 1973 oil embargo on the way into a nasty stagflation bout in 1974 during a recession that ended in March 1975. That was the longest postwar recession until the financial crisis (see Business Cycles: The Recession Dating Game 10-10-22, Expansion Checklist: Recoveries Lined Up by Height 10-10-22, Misery Index: The Tracks of My Fears10-6-22).
The median CPI metrics from 1972 (+5.8%) and from Jan 2009 (+5.2%) give some context to what today’s CPI looks like at 2.6% headline CPI for Oct 2024 (see CPI Oct 2024: Calm Before the Confusion 11-13-24). We get the Nov CPI reading next week.

The above chart plots Total payroll vs. Job Openings from Jan 2009. The “counting heads” approach goes back to the old rule we always invoke of “Mo paychecks, Mo money, Mo spending” which of course should include many jobs that are “off the books” of monthly payroll reporting. How those numbers and related PCE spending might get hit by mass deportation will be a topic for 2025.
As of now, the recent JOLTS report came in bullish for labor demand at a level above the peak numbers of Trump 1.0 during Nov 2018 (see JOLTS Oct 2024: Strong Starting Point for New Team in Job Openings 12-3-24). Strong labor demand with a shrinking labor force will need to flow into the low end of the wage structures. That raises inflation anxiety and labor cost pressures.

The above chart adds another angle from 1972 to current times as we plot CPI vs. the unemployment rate. The inflationary bounce from lows such as 1972, Dec 1986, March 1998, and the deflation of July 2009 offer some reminders of how inflation can move quickly. It is also a reminder that inflation spikes of the sort seen in 2022 are very rare. We saw much worse episodes in the 1970s/early 1980s. The catalysts to get there have run the gamut from shooting wars to oil shocks to a pandemic. We hope not to add “trade war” to the list in 2025 and pray a shooting war does not pile on. We shall see.

This month's report shows a strong month of payroll growth at +227K and just above the post-crisis median. Last month was affected by hurricane disruptions and the Boeing strike, which led to renewed debates around what the “normalized” run rate would be at this point of the economic cycle as we discussed above. The return to a healthy print this month is a positive signal for the economic cycle and sets a “no excuses” bar for the incoming administration with one month to book in 2024.
This month saw Durable Goods (+26K) standing out as a major winner largely on the rebound from the October low. As noted earlier, Durables was about Transportation Equipment at +32K with Boeings strike over but autos slightly contracting. Other areas include Leisure and Hospitality at +53K.
Retail trade stands out on the lefthand side of the chart at -28K with more evidence of the secular shift from brick and mortar to online shopping. Retail is a major line item at over 15.6 million, so it does not take much of a shift to move the needle. The holiday season still leads to buildup of staffing to cover increased traffic and seasonality adjustments are getting second-guessed by some. However, the changing behavior of retailers means lower staffing levels are needed as e-commerce channels take more share, so the magnitude of that buildup has diminished over the years. This month’s print reflects the structural changes within the retail business as the holiday shopping season started strong.

The chart above shows the changes by industry since Jan 2020, and we use it as a reminder of overall industry trends. The top 3 on the righthand side (Health Care, Professional and Business Services, and Transportation and Warehousing) account for over half of the payroll adds post-COVID and have shown little evidence of slowing down given secular and cyclical tailwinds. Leisure and hospitality underwent a slow recovery, only returning to pre-COVID levels in December 2023.

In the next series of charts, we reproduce key line items across industries and start with a top-level view in the above chart. November saw relatively even growth across Private (+194K) and Public payrolls (+33K) MoM.
We break out the Goods-producing lines where the LTM period has been tough coming in down -61K in Manufacturing jobs. As covered earlier, durable goods payrolls bounced back some this month, but the total is still down on the year. All manufacturing has seen anemic growth since pre-COVID.
We look at more of the underlying trends in the charts below but current and future policy initiatives to reignite the manufacturing base (e.g., CHIPS and Science Act, Inflation Reduction Act, tariffs, etc.) come up against a long history of offshoring and recalibration of supply chains that promise an uphill battle.
With one more month to go, the 2024 payroll numbers are shaping up as a respectable year for payroll growth at 1.3% YTD. Though it underperformed the massive job growth in the past 3 years, it resembles the 2010-2019 stretch of slow growth in a mature economy that saw mid to high 1%-handle growth.

This chart covers the manufacturing line items with a focus on the Durable Goods lines (Nondurables below). As we covered last month, the Boeing strike weighed on Other Transportation Equipment to the tune of -33K and its recovery this month of +32K makes for a good headline. It is not material in the context of ongoing industry trends.
Removing the impact of the strike, November reflects another down month for manufacturing that continues to struggle in 2024. The YTD column shows negative growth across the board with exceptions for Nonmetallic mineral products (+0.6%) and Other transportation equipment (+0.2%). November is slightly rosier than the year but still mixed with 2 positive, 5 flat on the month, and 4 negatives.

The above chart shows the nondurable manufacturing industry mix. There is little to highlight across the myriad secular decline stories that are recurring for most in the above mix. Chemicals is the sole positive variance this month as it joins Food Manufacturing in looking to close out 2024 with minor growth.

The above chart details the Services layers that make up about 84% of private sector payrolls and just over 71% of Nonfarm payrolls. We already covered the decline of Retail trade this month above, and the rest of the lines reflect the varying levels of positive growth experienced in these sectors in recent memory.
Services is teed up to be one of the most affected by planned deportation efforts of the incoming administration with clear implications for Leisure and Hospitality, Administrative and Waste Services (e.g., janitorial, landscaping, maintenance services), and Healthcare sectors. Deportation efforts could lead to potential labor shortages resulting in upward wage pressure.
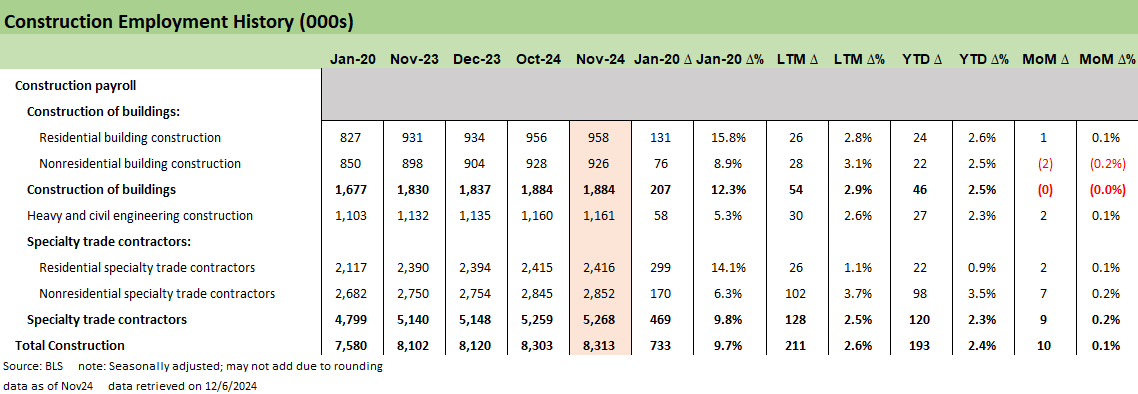
The chart above presents the construction employment picture that was generally positive in November at +10K but lower than the year’s run rate that has added +193K construction jobs YTD. Specialty trade contractors were the lion’s share of growth in November as it likely benefitted from an uptick in demand following this hurricane season. On the other hand, Residential and Nonresidential building saw minimal movement.

Finally, the last chart above depicts the government hiring picture which has been relatively stable across the year with especially strong hiring at the State and Local levels. This month saw a small pullback in Federal payrolls of -2K but was offset by +20K State and +15K Local payroll adds.
The lines above roll up a range of roles across education, public safety, emergency services, and various levels of support that make up the 23.5 million government payroll. We await what materializes from Federal cost cutting and efficiency programs under the next administration (“DOGE”) to see their impact and breadth of the numbers above. It could get ugly quickly.
Contributors
Glenn Reynolds, CFA glenn@macro4micro.com
Kevin Chun, CFA kevin@macro4micro.com
See also:
Trade: Oct 2024 Flows, Tariff Countdown 12-5-24
JOLTS Oct 2024: Strong Starting Point for New Team in Job Openings 12-3-24
Footnotes & Flashbacks: Credit Markets 12-2-24
Footnotes & Flashbacks: State of Yields 12-1-24
Footnotes & Flashbacks: Asset Returns 12-1-24
Mini Market Lookback: Tariff Wishbones, Policy Turduckens 11-30-24
PCE Inflation Oct 2024: Personal Income & Outlays 11-27-24
3Q24 GDP Second Estimate: PCE Trim, GPDI Bump 11-27-24
New Home Sales Oct 2024: Weather Fates, Whither Rates 11-26-24
Mexico: Tariffs as the Economic Alamo 11-26-24
Tariff: Target Updates – Canada 11-26-24
Mini Market Lookback: Market Delinks from Appointment Chaos… For Now 11-23-24
Credit Crib Note: Ashtead Group 11-21-24
Existing Home Sales Oct 2024: Limited Broker Relief 11-21-24
Housing Starts Oct 2024: Economics Rule 11-19-24
Mini Market Lookback: Reality Checks 11-16-24
Industrial Production: Capacity Utilization Circling Lower 11-15-24
Retail Sales Oct 2024: Durable Consumers 11-15-24
Credit Crib Note: United Rentals (URI) 11-14-24
CPI Oct 2024: Calm Before the Confusion 11-13-24
Mini Market Lookback: Extrapolation Time? 11-9-24
The Inflation Explanation: The Easiest Answer 11-8-24
Fixed Investment in 3Q24: Into the Weeds 11-7-24
Morning After Lightning Round 11-6-24