
Credit Crib Note: Ashtead Group plc (AHT)
We frame the credit quality, operating fundamentals, and financial risk profile of the #2 equipment leasing player behind leader United Rentals.


CREDIT TREND: Stable
Ashtead’s migration from the BB tier into full investment grade ratings and a low BBB tier index composite rating has been consistent with the solid credit trends. The solid credit risk profile is also consistent with what we see at industry leader United Rentals (URI). Those two are over ¼ of the industry. The fundamentals of secular growth and end market demand have been consistently working in favor of equipment rental since COVID as the two leading companies press their advantages in this consolidating subsector of capital goods.
A lot of low coupons were locked in as these leaders grew both sides of their balance sheet while maintaining low leverage. For Ashtead we will use the plc ticker “AHT” for purposes of this commentary. EBITDA growth went hand in hand with the top line growth and business risk kept on declining as they built out their competitive advantages vs. the industry and executed on plans to grow and diversify the fleet and their customer base and by geographic region.
The main difference between the two leaders was the very aggressive and highly successful M&A strategy of URI across good economic times and during macro shocks. URI became synonymous with buying up the major rental operators. Ashtead was more about growth capex and bolt-ons. Both have ridden the secular growth trends in equipment leasing relative to overall growth in demand for equipment with leasing grabbing share from “ownership” and increasing penetration of a range of markets and industry verticals. AHT’s Sunbelt brand ranks as a strong #2 in US equipment leasing behind the United Rentals brand with Herc (HRI) a more distant #3.
The financial metrics are comparable, but the Ashtead capital structure is “cleaner” with fewer layers of secured and without the 1L/2L bonds that we see at URI. We would argue the credit risk of URI is investment grade caliber as well. If the capital structure layers are the main event, the case could easily be made that both companies could be rated higher given how they have demonstrated extraordinary cash flow resilience and very favorable asset protection across periods of extreme volatility in the economy from the credit crisis through COVID and across the most aggressive tightening cycle by the Fed since Volcker.
The URI differentiator in the equity markets has been the increased embrace of URI as an M&A driven growth story. The acquisitions also demonstrated low execution risk across over two decades of successful growth-by-acquisition by URI running in tandem with high rates of growth capex. Notably, we have seen AHT materially increase their acquisition totals over the past 3 years.
The UK operations of Ashtead are a secondary factor in the equity and credit picture with less compelling economics and financial performance. While Ashtead is a “plc” headquartered in London, the company is in substance a US operation tied to the US equipment markets with smaller operations in Canada and legacy operations in the UK.

OPERATING PROFILE
We cover much of the North American Equipment Leasing industry dynamics in our Crib Note on industry leader United Rentals, so we won’t replay all of that in this commentary (see Credit Crib Note: United Rentals 11-14-24). We refer the reader to URI for more fundamental top-down views on the secular growth trends in equipment leasing and the numerous key drivers that will keep those trends going. For those with holdings or interests only in Ashtead in this sector, you should be paying attention to URI as well for the competitive playing field and for more signals on the leasing industry dynamics and consolidation scenarios in the space.
Ashtead’s North American operations fall under the Sunbelt brand, and you see a lot of these names on equipment around the US. When you see other names, think of “consolidation candidates” in what is still a long tail of medium-sized and smaller players numbering near 3600 (per AHT). Both Ashtead and URI have been enormously successful in the space even if URI equity has pulled away in recent years in stock performance and market visibility. As noted in the stock chart above, the top 3 leasing operators as a group outperformed the broad market benchmarks since before COVID.
Growth rates in the US and Canada remain very favorable. Ashtead’s UK operations have been a laggard in its overall mix but with UK legacy operations still ranking #1 in the UK in equipment leasing market share at around a 10% share. Ashtead also uses the Sunbelt name in the UK.
As we look ahead at the leasing industry after such a boom period of megaprojects and economic expansion (regardless of what tall tales political campaigns were spinning), the biggest question marks into the future will be around rental rate declines and fleet planning in a downturn. There is also the question of what happens in non-construction capital budgets as the “reshoring” questions get answered in the face of tariffs and retaliation.
There are other questions for the supplier chain trends in the next few years in the face of tariffs, but the direction of the dollar can cut both ways. A strong dollar can ease the impact of tariffs but can also hurt exports. Fixed investment and the absolute rate of economic activity the main event for leasing companies and growing economies generally are the main driver. Contractions are rare and the question then is “How well are the operators positioned by subsector and fleet positioning?” There is always something growing and contracting, whether data centers on the rise or office buildings on the decline in a given market.
FINANCIAL TRENDS
Balance sheet, profitability, and liquidity trends all remain very strong for Ashtead. The company recently lowered the bottom range of its leverage target to 1.0x to 2.0x from the earlier 1.5x to 2.0x. The leverage range gives Ashtead plenty of room to maneuver as demonstrated by the more aggressive rate of acquisitions seen in the 3 fiscal years from FY 2022 to FY 2024 (reminder: AHT is an April 30 fiscal year). The pace of acquisitions by AHT the past 3 years saw an average above $1.1 bn per year in deals with a heavy tally of bolt-on transactions.
As Ashtead rolled into its latest multiyear strategic plan, the company marked the end of “Sunbelt 3.0” and announced “Sunbelt 4.0” at its April 2024 Capital Markets presentation. The company looked back at the 3 years of Sunbelt 3.0 and cited AHT’s growth success with a 25% CAGR in their Specialty Equipment business and 18% in the General Tool operations. The next leg of the journey is underway with Sunbelt 4.0 in the current FY 2025 (4-30-25).
The success at Ashtead mirrored many of the same themes we see at URI with diversification of equipment and customer markets and multiple pathways to keep growing the company via capex and acquisitions. Along the way, both URI and AHT keep an eye on returning cash to shareholders via dividends and buybacks as results allow.
Terms such as “geographic reach” and “density of clusters” and “cross-selling” heard in analyst presentations are consistent with the industry strategies heard across the years with a mix of growth capex, bolt-ons and “greenfields” driving steady growth.
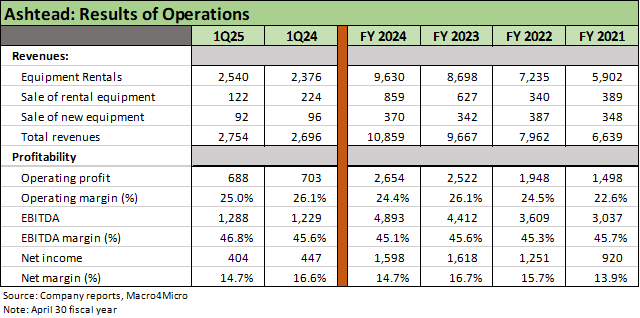
Ashtead 1Q25 results (1Q25 = quarter ended 7-31-24) were solid with the usual lofty EBITDA margins (mid to upper 40% range across the cycle) ticking slightly higher YoY from 45.6% in 1Q24 to 46.8% in 1Q25 after printing 45.1% in FY 2024. We note that AHT reports its 2Q25 results for the Oct quarter on Dec 10, 2024.
Rental revenues growth of over 6.9% was favorable in 1Q25 with guidance for FY 2025 calling for 5% to 8% rental revenue growth with a wide guidance range of 4% to 7% in the US, 15% to 19% in Canada, and 3% to 6% in the UK. Rental growth will be slowing in coming years in % terms after such a heady period of organic and acquisition driven growth.
The EBITDA line was a record for 1Q25 as sustained growth in fleet equipment ran alongside favorable rate and volume trends. The results were in line with the expected effects from the growth capex and bolt-on acquisitions. The rental equipment line rose to $11.7 billion at 1Q25 from $10.3 bn at 1Q24.
The infrastructure support in 1Q25 included growth by 33 locations with 22 greenfield locations and 11 through bolt-on acquisitions. The higher interest expense on higher debt levels to grow the business put some pressure on operating margins with those narrowing slightly.

The interim and annual segment breakdown above highlights the dominance of the US operations across the geographic segments of Ashtead with US at 86% of segment revenue in FY 2024 and 94% of total segment profit.
For the US operations, rates and volume were both favorable. Organic growth (same-store and greenfield openings) generated +5% while bolt-on deals since the start of the FY 2024 delivered 2% rental revenue growth. As with URI, AHT saw strong numbers from Specialty equipment revenues at +17% vs. 3% growth from general rentals (see Credit Crib Note: United Rentals (URI) 11-14-24).
As we saw at URI, Ashtead shows General Rental growth is fading from the higher rates seen in 2023 on the initial wave of post-legislation ramp-ups for so many major projects.
Higher rates have taken a toll on many segments of commercial real estate and slowed multifamily off the peaks, but the megaprojects have brought major tailwinds. The ability to sustain growth could get called into question subject to what could end up as a stark change in economic policies that could drive higher long rates and softer investment trends.
Canada saw favorable trends in rate and volume also, but the Canadian business is still in the process of recovering from the Writers and Actors strike (Note: Canada broadly and locations such as Vancouver are major sites for US TV series and movies etc., with related equipment around 17% of the AHT fleet mix).
The UK business has been a laggard and an area where the company says the operations need to make progress. AHT is #1 in the UK and made market share gains in FY 2024, but the cyclical question marks remain a challenge in recovering the inflation pressures the business has absorbed.
Megaprojects with long tails and long-term needs across a wide range of equipment types have been a tailwind for a materially higher rate of fixed investment than what was seen before COVID. Local markets were reported as mixed by the industry leaders while national accounts have been major beneficiaries of robust nonresidential activity (see Fixed Investment in 3Q24: Into the Weeds 11-7-24).
The political reality will change materially in 2025, and it will take time for any disruptions from tariffs and budget moves by Team Trump to unwind Biden initiatives and flow into capital budgeting actions. One fear is that funding plans for a range of the EV investments could get dialed back (battery infrastructure needs, suppliers, assembly plants). The infrastructure bill plans appear safe, but the CHIPS Act could be subject to some headline risk on the high spend rates on semis with some vocal opposition from the House.

Ashtead maintains a solid balance sheet and has kept within its historical leverage range of 1.5x to 2.0x. The recent moves to reduce the lower end of the band to 1.0x is a positive sign for the credit story but the company had already migrated to full investment grade and a heavily unsecured bond mix under the old leverage guidelines.
The company has a heavy slate of unsecured bond maturities from 2026 every year through 2034 with the exception of the year 2030. The total at 1Q25 of bonds was approximately $6.2 bn in the BBB index.
The senior secured bank facility at 1Q25 had $1.86 bn outstanding. At 7-31-24, there was $2.757 bn available under the facility. The only covenant is a fixed charge coverage ratio as defined that includes EBITDA adjusted for net capex and framed against interest and cash tax payments and dividends. The fixed charge ratio covenant (a 1.0x test) does not apply when availability exceeds $450 mn. Per Ashtead’s financial report, “the covenant did not apply at 31 July 2024 and is unlikely to apply in forthcoming quarters.”
The collateral provisions in the credit agreement speak to the quality of the asset coverage with receivables at 85% in the borrowing base, fleet and vehicles at the lower of 85% of appraised value and 95% of book, and inventory at 50% of book.
The ability of the major equipment leasing companies to essentially pick their balance sheet metrics has been demonstrated by both URI and AHT as they seek to balance expansion of the fleet (growth capex and acquisitions) with shareholder rewards (buyback and dividends).
Ashtead is growing both sides of its balance sheet with a higher earning asset base and higher debt to finance that equipment growth while cash flows keep growing along the way with net asset values riding to the benefit of shareholders. The dynamic is straightforward, and the low execution risk has been demonstrated by the major players across the cycles.
Buybacks are dictated by what is available after investment in organic growth capex, bolt-on-M&A and dividends.
Financial flexibility is enhanced by high margins and high rates of free cash flow and inherent flexibility to sell used equipment, slow down orders in a market with shorter lead times, and either pay down debt or build balance sheet liquidity.
The quality of the large base of highly diversified accounts receivable and readily available secondary market depth for used equipment is very supportive of collateral quality and lender confidence, so the mix of asset protection and high cash flow generation makes for a very clean credit story.

The above chart frames the LTM 1Q25 period and details a range of fiscal year periods for free cash flow and the cash flow sources/uses. We see the growth in scale in operating cash flow across the cycles for Ashtead with details on capex (growth and replacement), acquisition activity, and capital allocation across buybacks and dividends. During the 1Q25 earnings call and related disclosure, AHT is guiding investors to a $1.2 bn free cash flow number for the full year. Capex could come in lower than the current guidance.
The material increase in acquisition activity across fiscal years 2022 (4-30-22) to 2024 (4-30-24) shows signs of AHT moving close to the strategy so successfully employed by URI and rewarded by the stock market since 2019. The main distinction is that AHT has executed on a mix more biased toward bolt-on deals with dozens of deals broken out in their annual report each year (Footnote 27).
The acquisition volumes rose to an average of $1.1 billion per year over the past 3 years, which was double the level of the rolling prior 3 fiscal years (2019-2021) or prior 5-year average (2017-2021). The materially higher cash flows, broad acceptance in the unsecured bond market, and superior equity returns vs. broad market benchmarks have increased equipment rental industry awareness in the capital markets and the name recognition of the leaders.
With respect to growth vs. replacement capex, AHT has always provided superior disclosure in this area and offers a reminder that very high EBITDA margins require sustained high capex to replace the cash generating asset base.
The growth capex story is supported by the secular growth in the industry and the reality that earnings growth requires sustained increased investment in equipment but in a balance with the other players that does not undermine pricing via “overfleeting.”
In terms of bolt-on opportunities, AHT clearly stated that there are “thousands” of independent equipment dealers in the US and Canada that are potential sellers and bolt-on candidates and thus there is no shortage of acquisitions to consider. Higher interest rates in theory tend to pressure multiples of such bolt-on targets but also potentially could slow growth opportunities.
History and Highlights
Ashtead is the #2 player in equipment leasing behind #1 United Rentals with the most recent calendar year showing United Rentals at a 15% market share in the US and Ashtead’s Sunbelt brand #2 at 11% with Herc Rentals a distant #3 at 4% followed by Home Depot and H&E Equipment Services at 2% each, leaving the top 5 with just over 1/3 of the industry share. The top 3 players grew from a total 10% share in 2008 to the current concentration of 30% for URI, AHT, and HRI.
The company continues to evolve its business in multiyear stages with the latest Sunbelt 4.0 heavily focused on diversification of its customer base and expanding the addressable markets as we also have seen at industry leader URI.
The secular growth of equipment leasing in the overall share of equipment financing activity (lease vs. buy) has been ongoing since the 1990s with the 1980s having experienced a wide range of changes in the leasing sector across the Reagan years in the US with shifting tax codes and in international markets with a range of leasing structures across various equipment and fleet groups (general equipment, aircraft, vehicles, etc.)
Ashtead estimates the North American Equipment Leasing industry at $77 bn as of 2023 with a projection to 2027 that could total $94 bn. Ashtead’s expectation is that the Top “2 or 3” will have over 50% of the market in the future (Does that imply Herc gets consolidated?)
The US fleet mix for Sunbelt is comprised of Mobile Elevating Work Platforms 29%, Forklifts 19%, Earth Moving 14%, Power and HVAC 11%, Scaffold 2% and then “Other” at 25%.
The Canada fleet mix is led by Mobile elevating platforms at 28%, Film and TV at 17%, Power and HVAC at 15%, Earth Moving at 12% and Forklift at 10% with “Other” at 18%.
The UK fleet mix is oriented toward Accommodation markets at 15% of its mix, Panels, Fencing, and Barriers at 11%, Earth Moving at 9%, Forklifts at 9%, Mobile Elevating Work Platforms at 9% and “other” at 47%.
As covered in various commentaries on United Rentals, the pace of consolidation continued across the record-long cycle pre-COVID and has stayed at a high rate since then as detailed in the capital allocation records of URI and AHT. Herc Rentals as the #3 player was spun off by Hertz in 2016.