
HY Multicycle Spreads, Excess Returns, Total Returns
We look across HY credit cycles for some context on total returns and excess returns.


We look back across a wild series of credit cycles for some perspective as a very solid year takes shape for US HY in the home stretch.
Looking back since 1997 across the HY cyclical spread highs and lows, we see 8 better years compared with 2023 and 18 worse in excess returns based on where we stand YTD 2023.
For total returns, we see 9 better years and 17 worse as the ZIRP years and volatility of a few ugly downturns kept HY pricing busy.
With a few weeks to play out, 2023 basically frames out as an upper second quartile performance for HY since the period when OAS and excess return tracking was available.
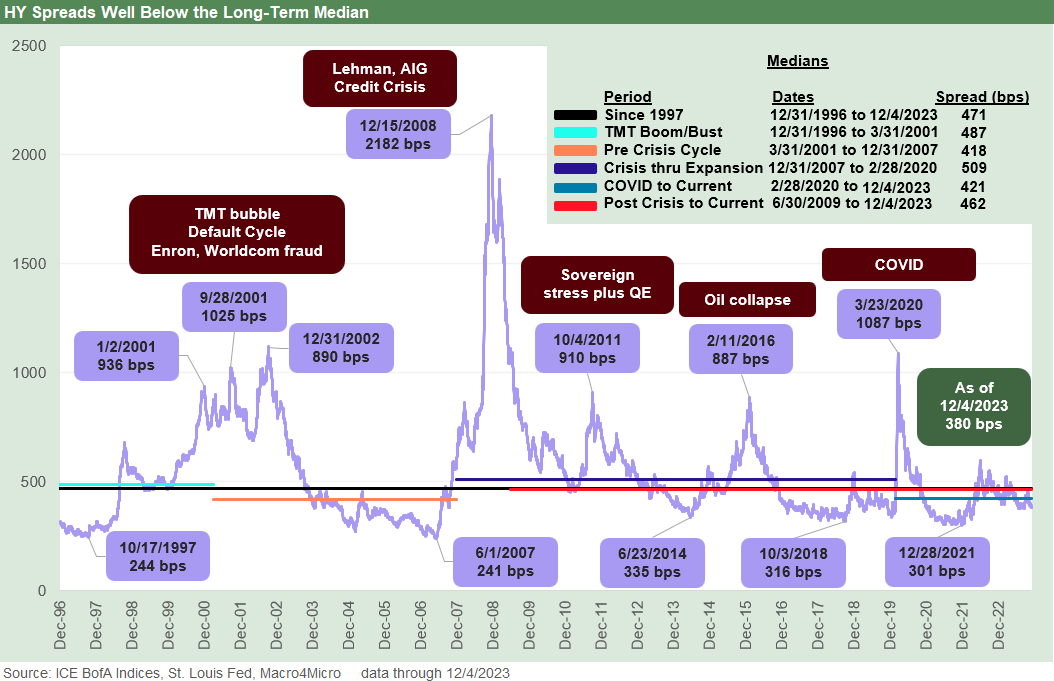
In this commentary, we look again at where HY stands in multicycle context and how that translates into running total returns and excess returns with a few weeks to play out in the measurement period and less than that in market activity. With the solid numbers in spread compression for HY YTD 2023 (-101 bps through Monday close), it would take the worst setback since that hideous month of Dec 2018 to rattle a solid overall HY performance.
Looking back across the cycles…
We recently looked at the timelines of HY OAS and quality spread differentials across the tiers (see HY Credit Spreads: Migration, Medians, and Misdirection 11-6-23). The theme was one of compression in historical context whether in proportionate terms or OAS spreads vs. history. In terms of incremental returns for the additional risk moving down the credit spectrum compensation remains skinny. The allure of 8% handle yields is not an experience the market has had at a time when UST curve scenarios are also offering some UST upside as well. That UST upside opens up the debate on what OAS will do, but that has been covered in other commentaries.
With the UST a moving target, just putting HY OAS levels in the context of UST rates (we call that the “proportionate risk” compensation) also reinforced where HY YTW as a % UST framed up. Any way you slice it, spreads remain tight. As we saw in some years such as 2014 and 2018, vulnerabilities can show up quickly with any signs of a shift in risk factors. We gave more history on spreads in our recent weekly Footnotes commentary on yields (see Footnotes & Flashbacks: State of Yields 12-3-23).

The above chart revisits the timeline across the cycles for HY excess returns. The swings within cycles offer a stark reminder of how the numbers can move around each year. Each year has its own set of stories, but 2014 and 2018 offer some food for thought with cyclical lows in HY OAS. They will be worth revisiting again in other commentaries.
The variances across annual measuring periods can be material whether tied to cycles, major sector stress, or event-driven changes in market risks based on exogenous shocks (e.g., Saudi market share wars such as late 2014/2015, China market panics such as summer 2015, COVID in 2020). Sometimes the moves are very hard to trace to anything broad or specific, and often sudden whipsaws create the best opportunities.
The poor performance in 2018 on the way into a 2019 Fed easing and risk rally offer an example. The memory of 2018 is that it was a terrible year for asset performance while 2019 saw weakness driving the Fed to react and then risk rebounded (we would note some on the Trump team don’t remember it that way).
During Dec 2018, the market continued a wild ride after an early Oct 2018 cyclical low in HY spreads. That HY low came on the heels of a wave of all-time highs in most stock benchmarks in the late summer. That year saw a post-2014 high for the year in oil ($76 WTI in Oct 2018) followed by a downward swoon to around $37 by Christmas Eve. Oil was thus a major catalyst even if it was clearly overdone.
HY widened by +104 bps in Dec 2018 with the CCC tier taking a dramatic plunge, widening by +183 bps. That was one for the ages as HY posted a negative excess return year of -3.7% after closing 3Q18 at a YTD +3.4%. That is one of many reminders over the years that HY tends to overshoot on the upside and the downside. After such an ugly month in Dec 2018, the Fed stopped its attempt to normalize rates and was soon easing again.

The above chart plots the timeline for total returns for US HY. We don’t want to do more lookback moments in this current piece. There are a lot of interesting twists (literally at the Fed) and turns along the way. We see some of the same major swings in credit cycles on the excess return charts, but the 2022 total return jumps out on yield curve pain.
We see some yield curve relief in 2001 when Greenspan ran wild on easing (see Greenspan’s Last Hurrah: His Wild Finish Before the Crisis 10-30-22). We also see some material differentials between total returns and excess returns in such active Fed policy years as 2010-2011 (ZIRP + QE).
As we look at the above timeline on total returns and the yield curve shapeshifting impact, it is worth remembering that the years from late 2008 to late 2015 were ZIRP years with ZIRP revisited again in March 2020 with COVID up until March 2022. One favorable element in the current backdrop is that the Fed now has ammo to fire off in the event of a fresh crisis with 5% handle fed funds.
That idea of renewed monetary flexibility may be digging into the frozen ground for a silver lining, but the risk symmetry helps. We saw that work in 2019 and numerous other periods if the world gets stranger than it already is. We saw it in late 1998 also.
Of course, if Trump gets elected, he will want negative rates. Those who remember those demands of Powell on that score know that is not a joke. Some of the tough guy Senators who were bashing Powell over the last few years for easy money and ignoring inflation were hiding in the Cloak Room when Trump demanded Germany-level fed funds rates (as in negative). The Senators were correct on the Fed being late to the party, but they did not speak up when Trump was demanding “ZIRP minus.”
Contributors:
Glenn Reynolds, CFA glenn@macro4micro.com
Kevin Chun, CFA kevin@macro4micro.com