
New Home Sales Oct 2024: Weather Fates, Whither Rates
A material setback in new home sales saw volumes plunge by 27% in the South and thus gain the tag of “weather related.”


Mother Nature had a mood swing. Might not get better soon…
The rise in mortgage rates since the late Sept and early Oct lows are a routine headwind for builders, but the seasonal slow period will also bring a lot of new cyclical inputs with the change in administration and some major policy shifts already heating up.
Oct saw a deep decline of almost -28% in the South, which is by far the dominant single family home region and one that fueled sales declines in completed homes, homes under construction, and homes not started with a slight uptick in homes for sale at the end of the period.
The overall picture in total was a -17.3% sequential decline from Sept and -9.4% drop YoY with a rise in the median price to $437.3K to a new high over the past year.
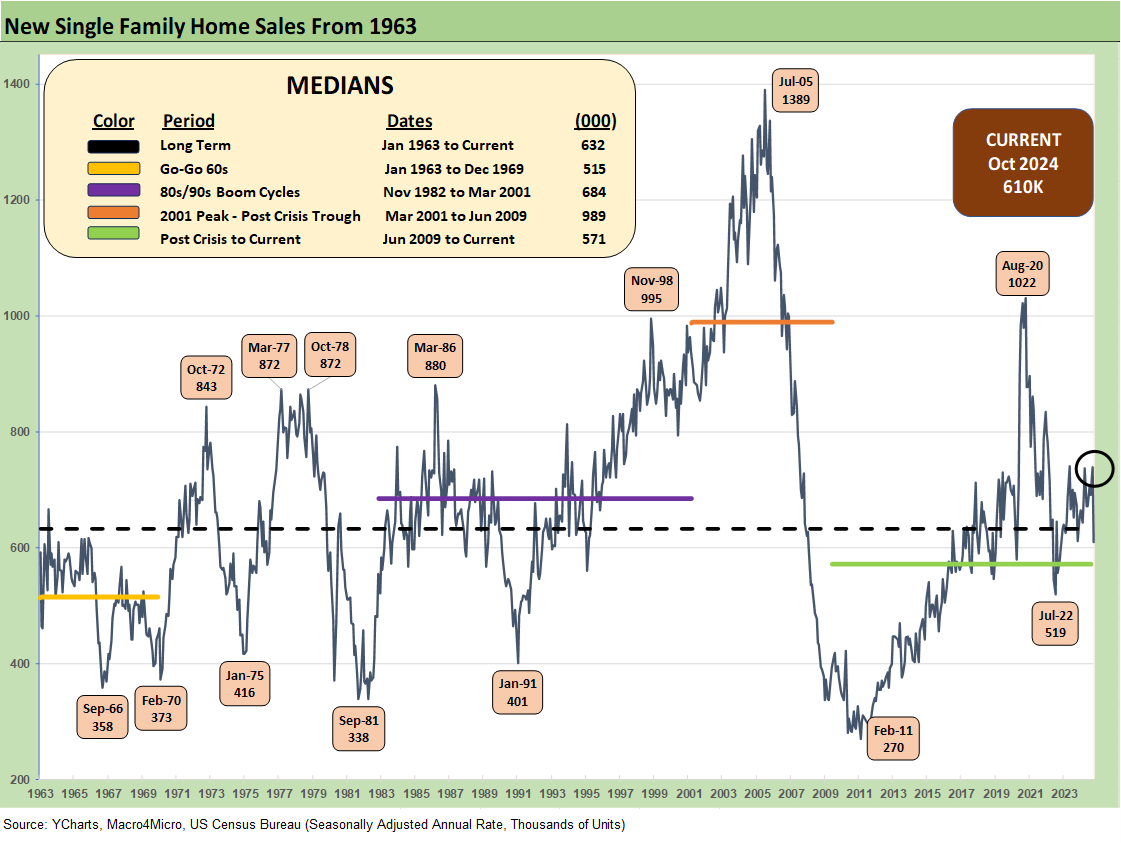
The above chart plots the single family time series since the early Go-Go 1960s, then across the volatile and inflation-riddled 1970s into the Volker inflation war of 1979-1982, through the 1980s-1990s boom, the new millennium housing bubble and sector crash, and then a rare inflation spike after COVID with the tightening cycle now giving way to easing mode.
The latest single family sales volume of 610K is modestly below the long-term median and well below the median of the 2001-2009 cycle. We are now in a market with a much more favorable demographic profile but considerable headwinds for existing home sellers that we cover each month (see Existing Home Sales Oct 2024: Limited Broker Relief 11-21-24). The result is that it is hard to be pessimistic about homebuilders given their demonstrated ability to navigate a 7% handle mortgage market using their array of incentive tools.
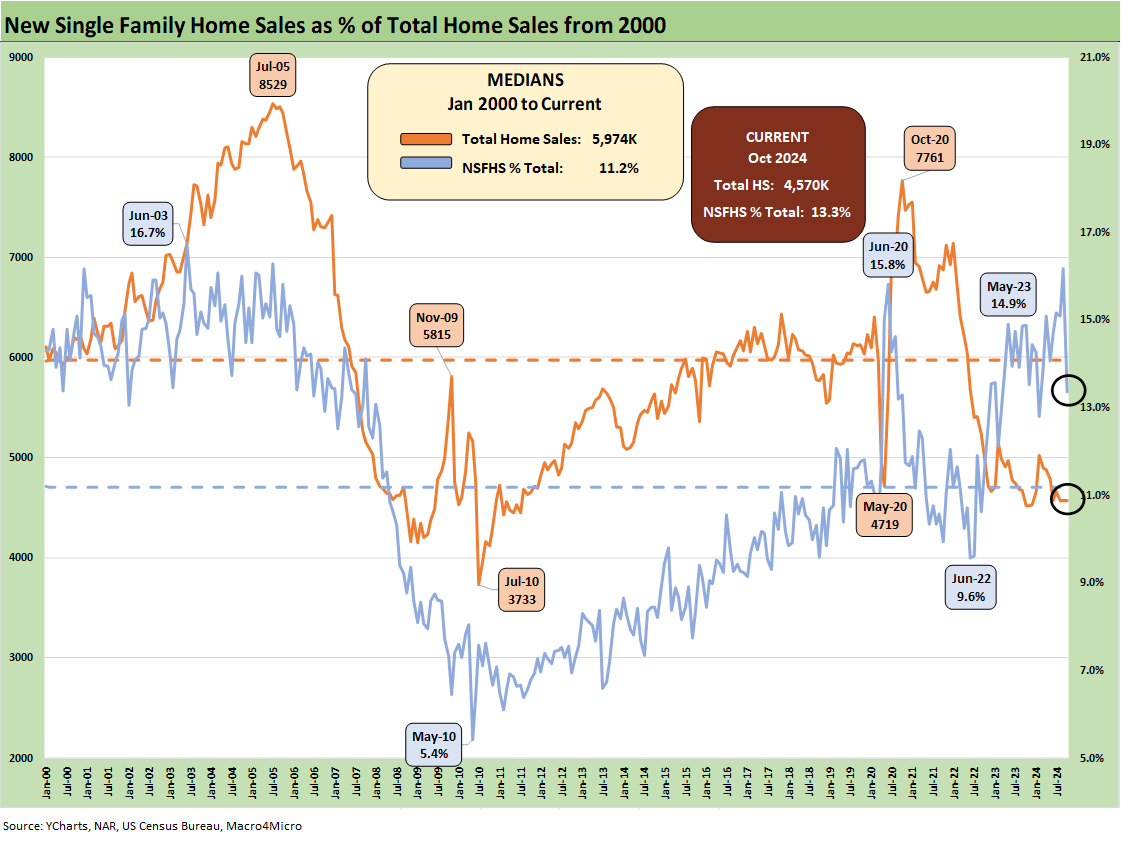
The above chart plots the market share of total home sales captured by homebuilders in this recent tightening and now easing cycle. At the current 13.3% share of total home sales, the builders have picked up a few points of share from the existing home sales volumes which always dominate the total. Existing homes have seen inventory constraints and a shortage of willing sellers with so many owners locked into sub-4% mortgages including just under 1/3 with 3.0% or below.
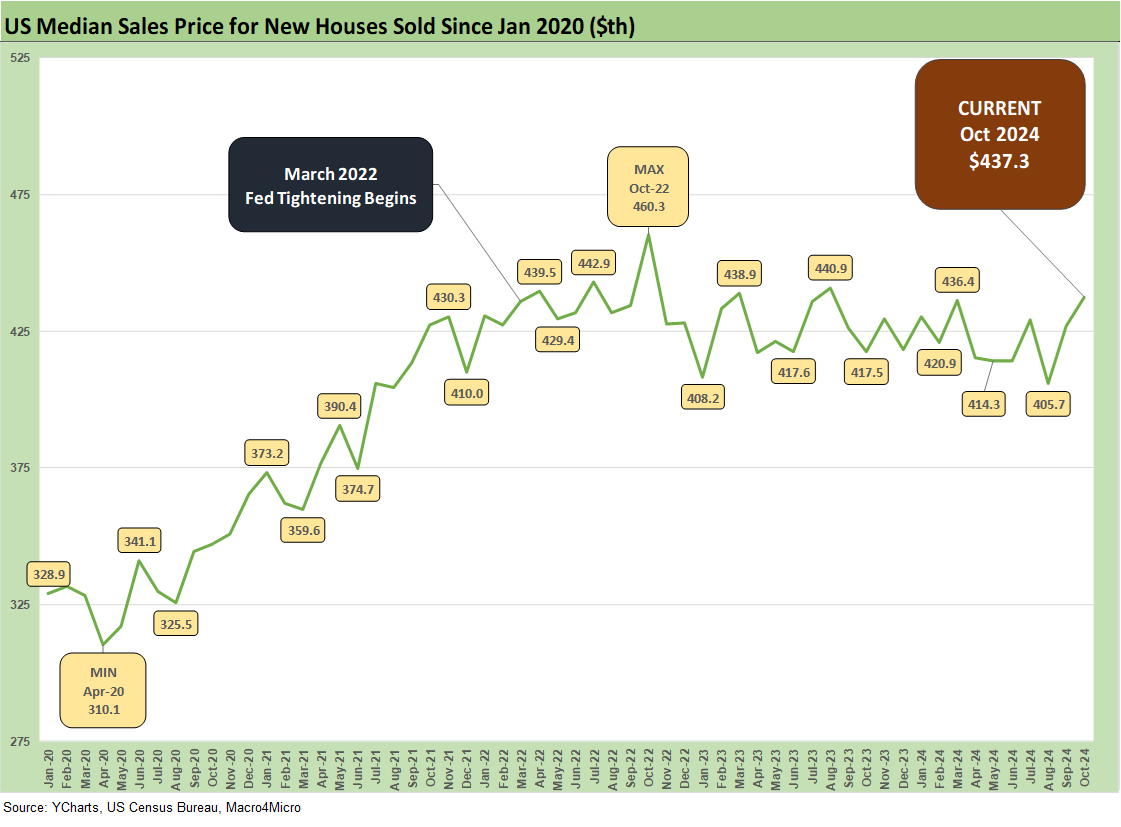
The above chart updates the median price for new home sales, and these remain well above the low $300K handle of COVID and sub-$400K range during most of 2021.
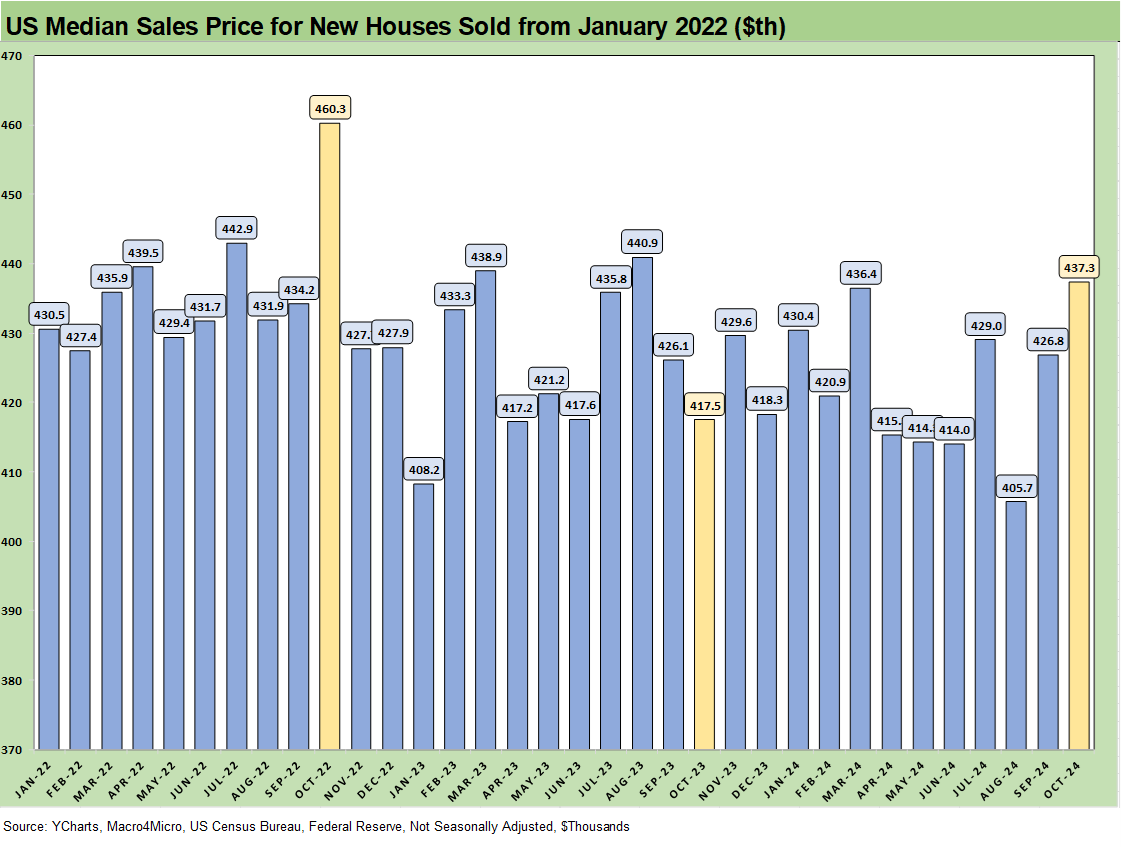
The above chart offers more monthly visibility on median home prices back to Jan 2022 just ahead of the end of ZIRP and the tightening cycle. Given the nature of home sale contracts and mortgage commitments, the full mortgage impact was only felt at a lag across 2022 as the UST curve headed higher.
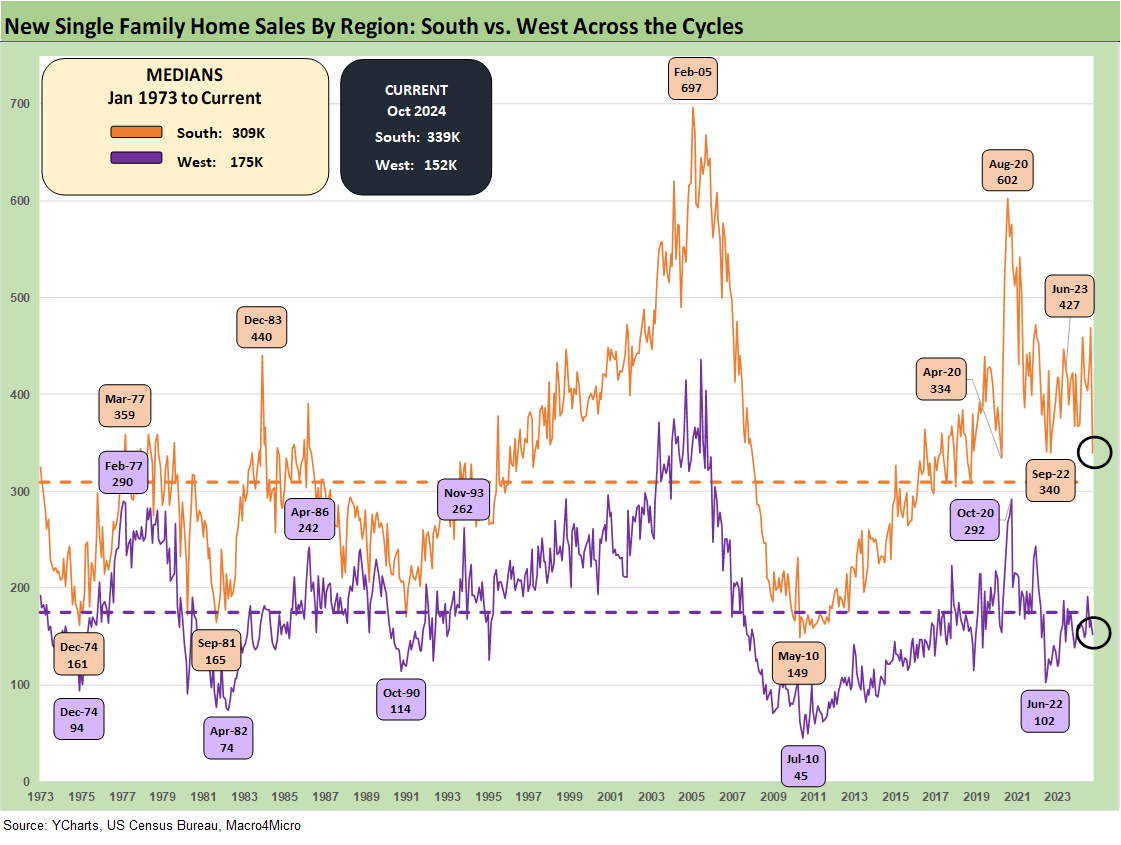
The above chart offers some visibility on the history of the two largest single family markets of the South (56% of Oct sales) and the West (25% of Oct sales). The growth in the South for single family to a majority of sales leans heavily on Texas and Florida.
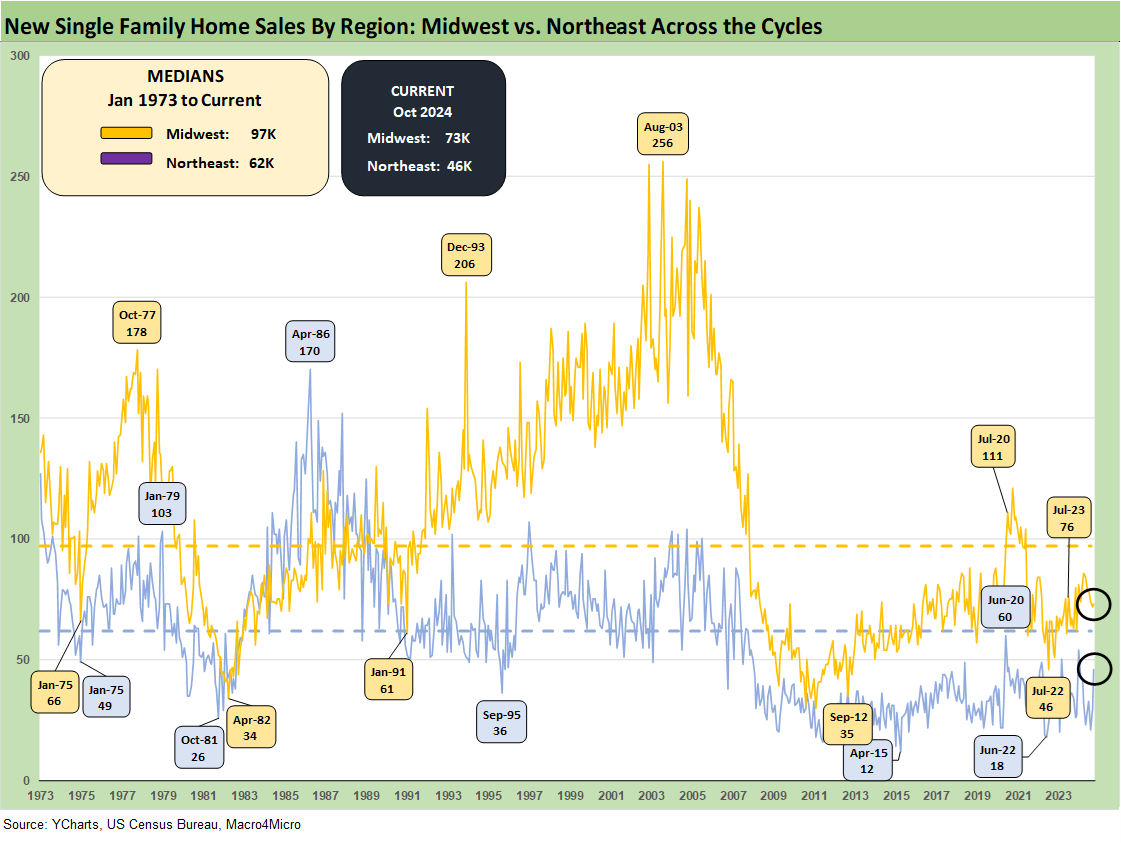
The above chart shows the history for the two smallest markets of the Midwest (12% of total) and Northeast (7% of total) which combined are just under 20% of sales.
See also:
Mexico: Tariffs as the Economic Alamo 11-26-24
Tariff: Target Updates – Canada 11-26-24
Footnotes & Flashbacks: Credit Markets 11-25-24
Footnotes & Flashbacks: State of Yields 11-24-24
Footnotes & Flashbacks: Asset Returns 11-24-24
Mini Market Lookback: Market Delinks from Appointment Chaos… For Now 11-23-24
Credit Crib Note: Ashtead Group 11-21-24
Existing Home Sales Oct 2024: Limited Broker Relief 11-21-24
Housing Starts Oct 2024: Economics Rule 11-19-24
Mini Market Lookback: Reality Checks 11-16-24
Industrial Production: Capacity Utilization Circling Lower 11-15-24
Retail Sales Oct 2024: Durable Consumers 11-15-24
Credit Crib Note: United Rentals (URI) 11-14-24
CPI Oct 2024: Calm Before the Confusion 11-13-24
Mini Market Lookback: Extrapolation Time? 11-9-24
The Inflation Explanation: The Easiest Answer 11-8-24
Fixed Investment in 3Q24: Into the Weeds 11-7-24
Morning After Lightning Round 11-6-24
Payroll Oct 2024: Noise vs. Notes 11-2-24
PCE Inflation Sept 2024: Personal Income and Outlays 10-31-24
Employment Cost Index Sept 2024: Positive Trend 10-31-24
3Q24 GDP Update: Bell Lap Is Here 10-30-24
Tariffs: The EU Meets the New World…Again…Maybe 10-29-24
Trump, Trade, and Tariffs: Northern Exposure, Canada Risk 10-25-24
Durable Goods Sept 2024: Taking a Breather 10-25-24
PulteGroup 3Q24: Pushing through Rate Challenges 10-23-24
Trump at Economic Club of Chicago: Thoughts on Autos 10-17-24