
Footnotes & Flashbacks: State of Yields 12-22-24
This week saw some bad days at the office for duration and equities with fewer expected cuts from the FOMC in 2025.


No Jacob, not fewer cuts! Anything but that!
The very busy week of economic releases and FOMC action and commentary left a roll-your-own mix of scenarios. The Fed guidance for 2025 carried the day with its projection for less easing than had been forecasted back in Sept and also with its forecast for a decline in annual GDP growth from 2024 to 2025 (see Fed Day: Now That’s a Knife 12-18-24).
The UST curve and equity markets took some solace from a constructive PCE release Friday that was more muted in MoM data even if not closer to 2.0% YoY, but there was still no hiding from the bear steepener beyond 2Y UST even with the FOMC -25 bps cut (see PCE, Income & Outlays Nov 2024: No Surprise, Little Relief 12-20-24, Mini Market Lookback: Wild Finish to the Trading Year 12-21-24).
Trump and Musk tried to avoid letting any 24-hour news cycle escape their domination, so the markets had to work through a near miss on a government shutdown and derailed legislation while renewing tariff threats against the EU via Truth Social (see Trump Tariffs 2025: Hey EU, Guess What? 12-20-24).
The final 3Q24 numbers this week weighed in at +3.1% for the last reading ahead of Biden’s exit. Besides a round of fresh data showing a healthy consumer sector, the +3.1% in 3Q24 and +3.0% in 2Q24 leave Biden with more back-to-back 3% or higher GDP growth quarters than Trump or Bush and tied with Obama, whose tally covers two terms (see GDP 3Q24: Final Number at +3.1% 12-19-24). We’ll see what 4Q24 brings.

The above plots our weekly replay chart for the history of UST curves across some useful cyclical and market transition periods. We start with the 1978 Carter inversion, then across the inflation pain and Volcker period of 1980, the credit cycle peak in early 1989 before the financial system hit the skids (FIRREA, thrifts, bridge loans, commercial real estate, etc.) on the way into a summer 1990 recession (and eventual Gulf War), then across the 1990s to the 2000 TMT meltdown, and finally the 2006 housing bubble.
We choose those dates for a range of reasons, but they all came before the credit crisis, the global systemic near-meltdown and protracted period of ZIRP and QE that distorted the curve for more than a decade.
We then plot the post-COVID UST 10Y peak date of 10-19-23 and then Friday’s close as the easing cycle is underway. The easy takeaway is that rates are very, very low in remotely normal cyclical context. So, when policy makers promise much lower rates out the curve along with high growth and lower inflation running alongside tariffs and shrinking the labor supply, believe them at your own peril. The meaningfully lower UST rates would take a crisis or a weak economic backdrop and even lower inflation. The variables and promises need context and logic – or celestial support.

The above chart posts the three UST curves for the recent cycle’s peak on the 10Y UST (10-19-23), the end of 2023, and Friday’s rates. We post the UST deltas in the box. We see the YTD numbers as a bear steepening beyond 2Y UST that has beaten up bond returns but shows great running news for yields since the UST 10Y peak in Oct 2023. That UST curve progress was concentrated in Nov-Dec 2023.

The above is a replay chart we run each week that follows the upward UST migration since the 12-31-21 date from the time of ZIRP and the economy seeing demand back up (and pent up) with lighter strains of COVID by then and supplier chains not able to keep up with demand.
We see the steady march of rates higher as ZIRP ended (March 2022), oil and LNG soared after the invasion of Ukraine got underway (Feb 2022 invasion), and the tightening cycle kicked into gear as inflation hit June 2022 highs. We did see a brief dip lower in yields with the regional bank crisis (we include the 3-31-23 UST curve), but the current curve is at the top of the stack for the longer end.
We had been using the convergence of the 12-31-22 and 12-31-23 10Y UST to drive home the point that the 10Y does not have to follow the fed funds action as many were claiming during the summer. The fed funds rate of 12-31-22 and 12-31-23 were 100 bps apart and yet the curve converged in the 10Y. Now we are back to a 100 bps differential again for fed funds and the 10Y UST went higher - not lower. That is the flip side of what we saw in 2023 when the 10Y did not move higher. This time it did not move lower. On the contrary, it went higher.
We are now back to an easing cycle in 2025 and similar questions lurk:
Does the 10Y UST need to go lower as the year continues with lower fed funds?
Will 10Y UST keep rising if the economy holds up well and UST supply keeps going off the charts?
Will we need to see more of a decline in inflation and/or a weak economy to push 10Y rates lower?
Will a more normalized term premium be needed to push demand for longer UST higher? If so, then how does the 10Y decline?
If the normal state of the curve is upward sloping, will the fed fund cuts be enough to allow slope normalization?
There are a lot of crosscurrents to sort through early in 2025 with tariffs, inflation (or a reduction in household purchasing power and household discretionary cash flow even if you call higher prices “not inflation” as some economists are trying to sell in support of tariffs).
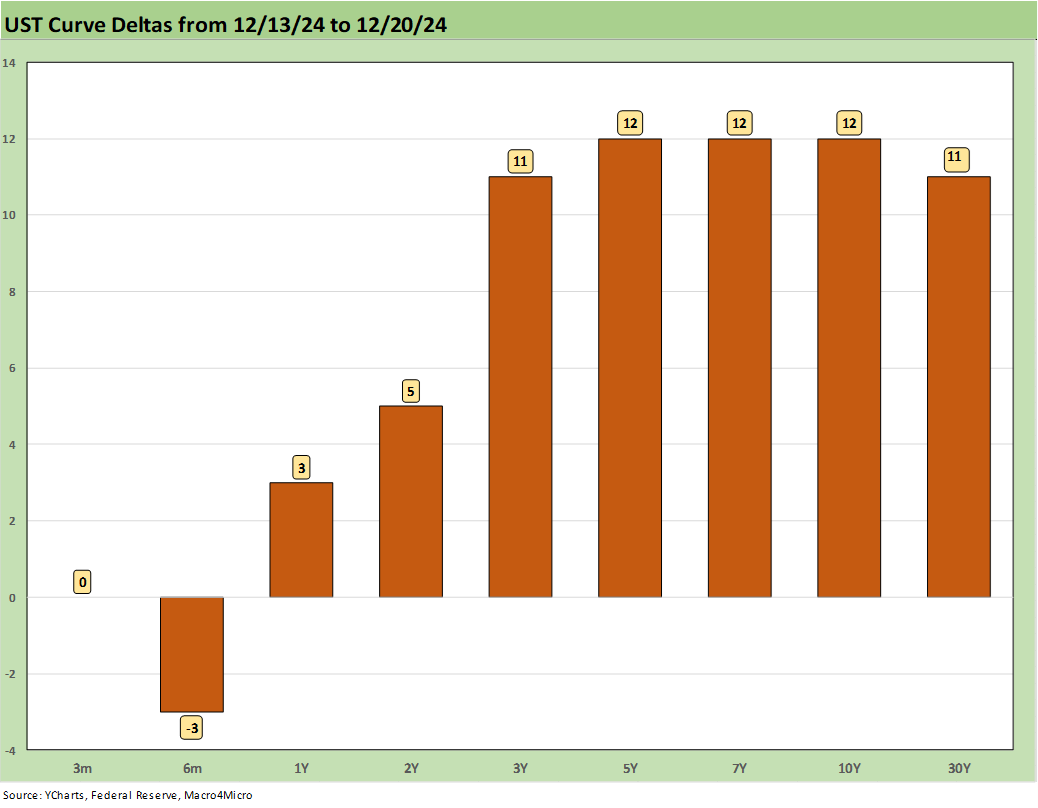
The weekly UST deltas were covered in our Mini Market Lookback: Wild Finish to the Trading Year (12-21-24). The risk of steepening is hard to dismiss given the longer-term histories as noted above. The UST borrowing needs are so massive and rising to record levels and some of the natural buyers are not exactly getting a warm embrace from Washington (notably China) given tariff threats and generally bad manners.
With Japan also a major lender to the US in the form of UST holdings, the eventual tariff threats will aim at Japan as well. Tariffs are bound to be refreshed against South Korea regardless of existing agreements. Tariffs on light vehicles and supplier chain products will be a big topic in 2025.
With the EU in tough shape from the macro side and always the target of Trump’s ire and the Japanese and South Korean auto markets always getting his blood up, a few key questions might be as follows:
If most every major, developed nation is a net borrower, who is supposed to be the net lender?
With Trump now seeking to remove the debt ceiling and execute on his many promises while cutting taxes, how will that flow into a forward view on the supply-demand profile for UST?
Is the easy assumption that the UST curve moves higher and steeper?
For the UST curve assumptions, it is hard to use excessive logic in assessing the fiscal game plan when high growth, lower rates, lower inflation, high tariffs, and mass deportation are the ingredients. If someone can claim that the “selling country pays” the tariffs and that he won an election he lost by 7 million votes, we don’t doubt the eagerness to run with a storyline. We also don’t doubt the willingness to effect such massively incongruous trade policies. In the end, the great equalizer of concepts vs. salesmanship is the fact that funding will need to take place, and someone will need to get paid for that funding.
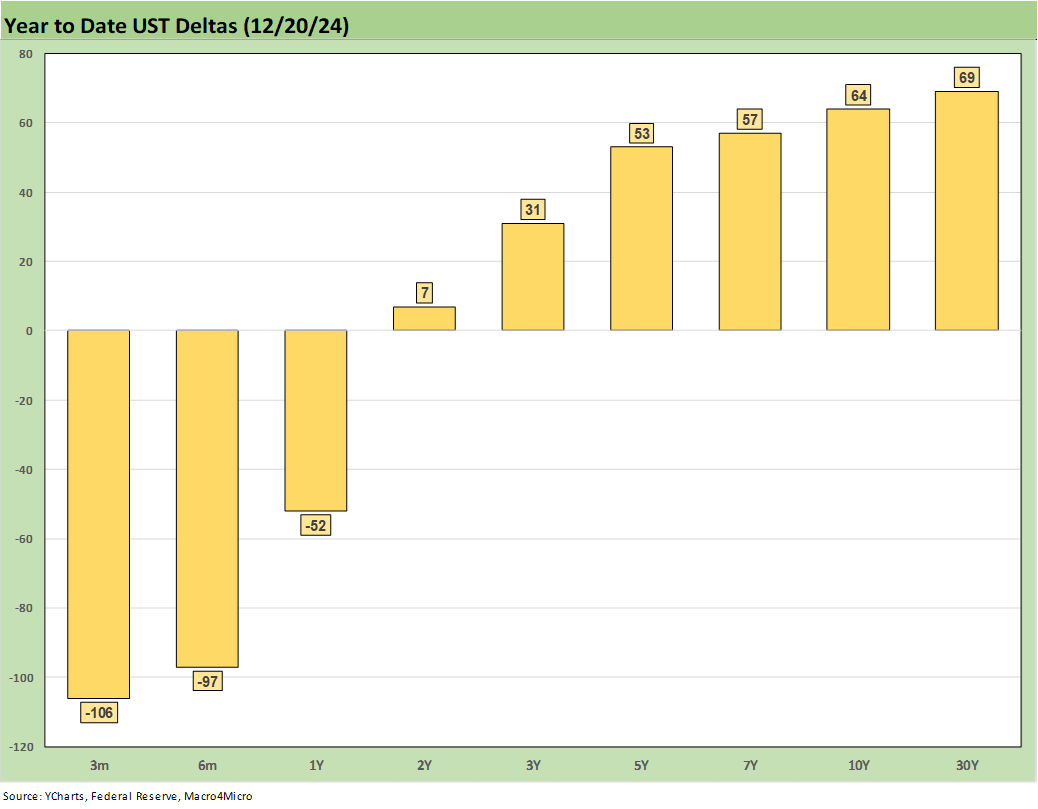
The above YTD UST deltas tell a story of easing and declining on the front end inside 2Y UST and steepening and rising beyond the 2Y UST. This was not the playbook consensus of this time last year. The UST saw a flurry of monetary action in the fall with the 100 bps of easing as inflation declined or went sideways, but the economy stayed strong in the real world (as opposed the fictional world of election rhetoric land).

The above UST delta frames the differences along the curve for the Friday close vs. the date of the peak 10Y UST (10-19-23). That is a very impressive bull steepener with the huge rally in Nov-Dec 2023.

The mortgage rate topic has been picked over each week since it bottomed out in Sept with the 10Y UST leading 30Y mortgages lower before bouncing higher with the bear steepener beyond 2Y UST.
After the FOMC actions and Fed forecasts this week, many mortgages went north of 7% even if the lagging Freddie Mac 30Y benchmark only moved 12 bps higher to 6.72% (released each week on Thursday at noon). We see the Mortgage News Daily survey at just over 7.0% to end the week.
The above chart also includes the Freddie Mac 30Y benchmarks (horizontal lines) at some key historical comp dates using the end of the peak year for homebuilding (2005) and mid-2006 when the UST curve was higher but subprime and RMBS quality was coming under scrutiny. We also include the UST curves for each date.
The longer dated UST is now above 12-31-05 and the 30Y mortgage well above that date. For mid-2006, the UST curve then was materially higher, but the all-in mortgage rates for June 2006 was only slightly higher than current levels.
You could make the case that such a period of housing and mortgage boom (2005-2006) across regions would offer some confidence that a 6% handle level could still be a very robust housing market with strong demand today. The complicating factor is the much higher selling prices. There is also the credit availability factor and legal exposure on credit in this market vs 2005-2006, or back in the days of “Got a pulse? Get a loan!”.

The above chart plots the long-term timeline from 1984 for the 2Y to 10Y slope. We include the other UST curve segment slopes we like to watch in the box with their long-term medians as well. The 2Y to 10Y slope is back to upward sloping as the 2024 bear steepening of that segment still leaves only a +22 bps slope which is well short of the long-term median of +93 bps.
The pace of easing is now forecasted to slow down in 2025 given the recent dot plots and projections released by the Fed this week. The new median forecast for 2025 for fed funds posted from the most recent Dec meeting was +50 bps higher than the projection released back after the Sept easing.
As we cover in our separate asset return Footnotes publication, that fed funds revision was likely the main trigger to set off the negative equity and UST market reactions. The stronger economic numbers in the 3Q24 GDP release at +3.1% reassured on consumer fundamentals and a high rate of nonresidential investment (see GDP 3Q24: Final Number at +3.1% 12-19-24). That did not get much airtime this week in all the noise.
The assumptions around what policies will actually be implemented by Trump (rather than jawboned) in the area of tariffs, deportation, taxes, and regulatory cleansing provide a wide range of outcomes.
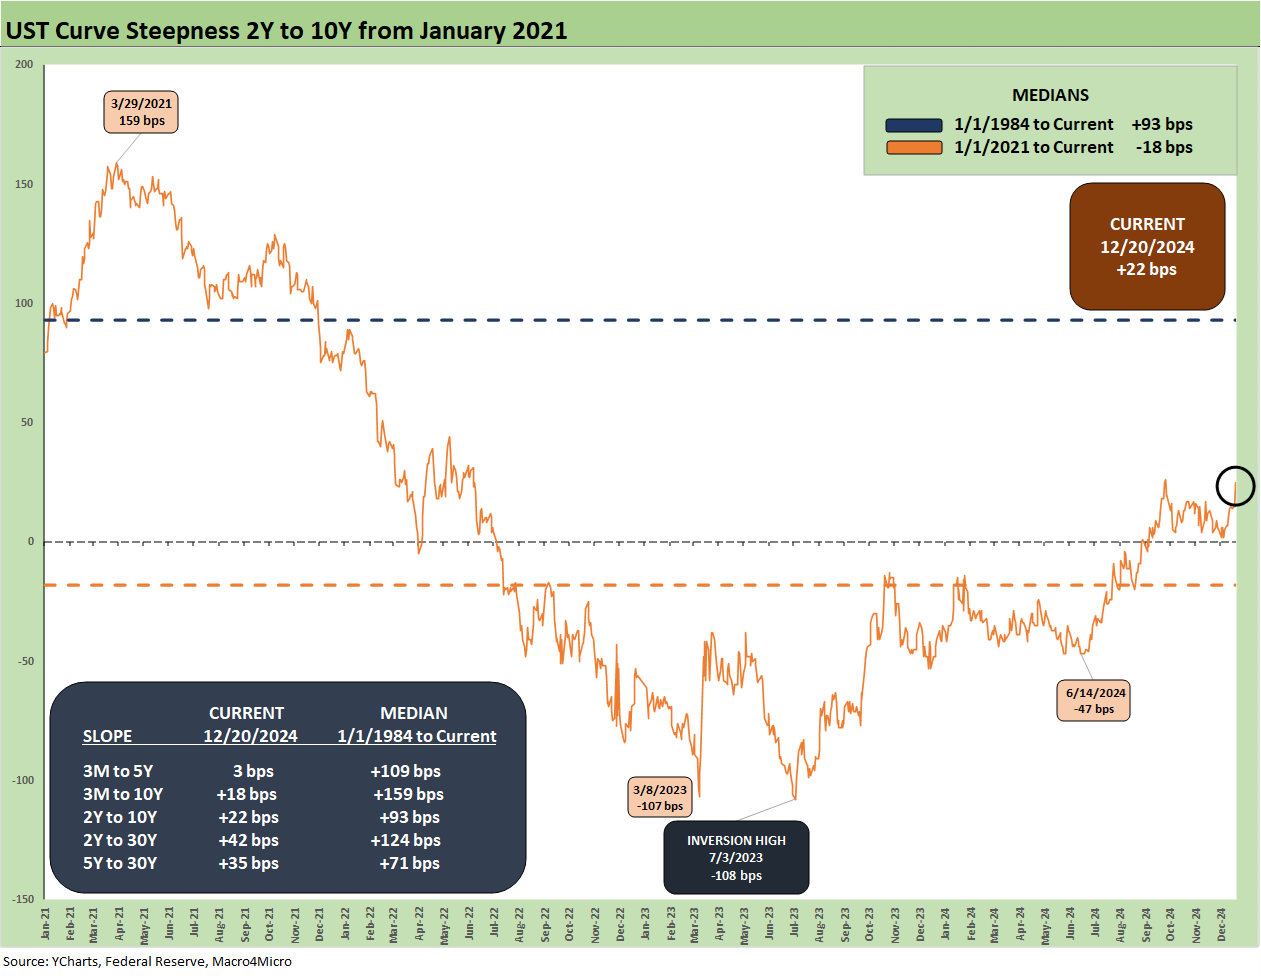
The above chart shortens the timeline on the 2Y to 10Y slope from a Jan 2021 starting point for a better visual on the scale of the movement from the ZIRP days. We see the +159 bps peak back on March 2021 as the COVID vaccine delivery was accelerating and demand was soaring into what would continue to be many supply-demand imbalances on the way to the 2022 inflation spike. The supply-demand imbalance only got worse after the Russian invasion of Ukraine in Feb 2022.
We see the peak inversion of -108 bps in July 2023 (-107 bps March 2023) on the way to the current +22 bps with the fall 2024 easing cycle now -100 bps with uncertain timing in what comes next.

We wrap with the running UST deltas since March 1, 2022, which is the month when ZIRP ended (effective March 17, 2022). The +402 bps on the 3M still allows income-oriented investors to take their time and get back to investing. There are some very big variables that will supposedly clear on “Day 1.”
See also:
Footnotes & Flashbacks: Asset Returns 12-22-24
Mini Market Lookback: Wild Finish to the Trading Year 12-21-24
Trump Tariffs 2025: Hey EU, Guess What? 12-20-24
PCE, Income & Outlays Nov 2024: No Surprise, Little Relief 12-20-24
Existing Home Sales Nov 2024: Mortgage Vice Tightens Again 12-19-24
GDP 3Q24: Final Number at +3.1% 12-19-24
Fed Day: Now That’s a Knife 12-18-24
Housing Starts Nov 2024: YoY Fade in Single Family, Solid Sequentially 12-18-24
Industrial Production: Nov 2024 Capacity Utilization 12-17-24
Retail Sales Nov24: Gift of No Surprises 12-17-24
Inflation: The Grocery Price Thing vs. Energy 12-16-24
Footnotes & Flashbacks: Credit Markets 12-16-24
Footnotes & Flashbacks: State of Yields 12-15-24
Footnotes & Flashbacks: Asset Returns 12-15-24
Mini Market Lookback: Macro Grab Bag 12-14-24
Toll Brothers: Rich Get Richer 12-12-24
CPI Nov 2024: Steady, Not Helpful 12-11-24
Mini Market Lookback: Decoupling at Bat, Entropy on Deck? 12-7-24
Credit Crib Note: Herc Rentals (HRI) 12-6-24
Payroll Nov 2024: So Much for the Depression 12-6-24
Trade: Oct 2024 Flows, Tariff Countdown 12-5-24
JOLTS Oct 2024: Strong Starting Point for New Team in Job Openings 12-3-24
Mini Market Lookback: Tariff Wishbones, Policy Turduckens 11-30-24
Tariff: Target Updates – Canada 11-26-24
Mexico: Tariffs as the Economic Alamo 11-26-24
Tariffs: The EU Meets the New World…Again…Maybe 10-29-24
Trump, Trade, and Tariffs: Northern Exposure, Canada Risk 10-25-24
Trump at Economic Club of Chicago: Thoughts on Autos 10-17-24