
Footnotes & Flashbacks: Credit Markets 12-23-24
HY finally posted double-digit widening, but that was dwarfed by equity market headlines, UST setbacks, the Fed, and Washington noise.


A lot of market noise a week before Christmas.
The +18 bps widening in HY this past week still saw HY outperform many equity asset lines in our universe of benchmarks and ETFs as the entire group of 32 came up with none in positive return range.
When the smoke clears, some equity correlation effects for HY do not erase a strong 3Q24 final GDP number of +3.1% for back-to-back 3.0% numbers, giving Biden more consecutive 3+% handle GDP quarters in a single term than Bush, Obama or Trump. The economy remains healthy, and that has anchored HY and IG bond spreads.
Strong bank profiles and steady economic trends and low absolute rates in pre-ZIRP context does not make HY or IG cheap at June 2007 type credit spreads, but the credit cycle dagger remains hard to find unless full-blown trade wars end up on the menu.
After such a very heady run in credit risk pricing in late 2023 and across 2024, the headwinds to incremental outperformance are more about the math than the fundamentals, and price risk symmetry is not great with tariff fixation and mass deportation dead ahead.

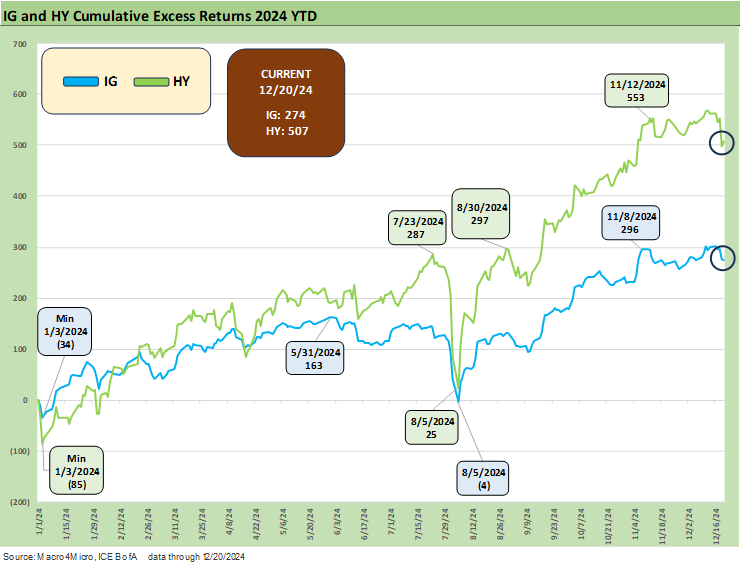
The above chart updates the running total returns and excess returns for IG and HY and the credit tiers. The spread compression trend across 2024 has been the friend of excess returns but the UST curve has been unkind to duration as we cover in our weekly Footnotes publication on Asset Returns (see Footnotes & Flashbacks: Asset Returns 12-22-24).
The IG total returns above pale in comparison with the +8.4% total return posted by IG during 2023. Excess returns for HY YTD 2024 of +5.07% also fall short of the +9.1% seen in the rebound year of 2023. Tight spreads seen in a sustained expansion during a tightening cycle with upward UST migration is naturally hard on bond returns. The fact that we are now in a post-tightening easing mode only gets you so far when the UST curve is already exceptionally low in historical context when framing yields against “normal cycles” outside crisis-era ZIRP and QE. That is a topic we review each week in Footnotes & Flashbacks: State of Yields (12-22-24).
2024 was a solid year for HY and at least positive in IG even if below the par weighted coupon of +4.3%. The 2023 performance was very impressive for HY in total returns at +13.5% (excess returns of +9.1%). Those 2023 returns came after the negative total returns and negative excess returns seen in 2022 as spreads were slammed and the UST curve felt the tightening cycle and inflation fallout. At the tail end of 2023, Nov-Dec 2023 UST shifts and credit spread tightening really drove home the rebound.
For HY, following a bad year is clearly the easier task in an expanding economy with declining inflation and a major equity rally. After the initial rebound wave, the return math gets trickier. At +507 bps YTD 2024, we see HY excess returns in 2024 running well behind the numbers put up in 2023. That would be a below median year in the mix of positive years since 1997 but not a bad year as we discuss in the next chart.
As we look back across time, we can get some perspective on the negative and positive excess return histories (see Credit Performance: Excess Return Differentials in 2023 1-1-24, Return Quilts: Resilience from the Bottom Up 12-30-23). From 1997 through this late Dec 2024 period, the 28 years in HY show 17 positive years and 11 negative returns for excess returns on a calendar year basis. Unsurprisingly, the best years seem to often come after bad years (like 2022). We are just about to wrap the second consecutive good year for credit risk pricing. That makes it tough to turn in a strong excess return year in 2025.
We had looked back at some of the historical timeline comps in last week’s Credit Market Footnotes piece (see Footnotes & Flashbacks: Credit Markets 12-16-24). The running HY vs. IG excess returns are framed above with HY running at +507 bps and IG at +274 bps. Those running excess returns were clipped this past week with the spread widening we detail further below. IG was +4 bps wider and HY +18 bps wider. As a frame of reference, the HY excess return was +6.7% in 2019 (IG 3.0%) and HY was +6.1% in 2017 (IG +3.8%). The 2018 volatility saw HY excess returns at -3.7% (IG -2.8%).
The good news is that the rule of “get paid more for taking more risk” is satisfied. That is not the case many times on a calendar year basis across the cycles. Coming off a good year and tighter starting spot for HY OAS made this year’s excess return performance quite impressive, but starting 2025 at June 2007 area HY spreads is no picnic just on the math – let alone the highly unpredictable policy risk that could be economically damaging even if ideologically satisfying.
The tariffs and deportation threats to fundamentals are at the top of our list for macro risks and industry level micro risks. The plans pack punch on the expense line and how that might flow into the inflation line. For those economists who object to the use of the term “inflation” for tariff-driven price increases, we could easily call it “materially deteriorating household purchasing power.” That does not roll off the tongue, so we will stick with inflation.
The other risk is an inability to pass along the tariff costs, and that is an expense increase and weaker margins for the buyer (who pays the tariff, not the seller!). The economists can spin definitions and “wordsmith” their way around, but there is no hiding from the accountants and double-entry accounting.

The convergence of BBB and BB tier is not the way they write it up in the playbook or textbook since you are supposed to get paid more for more risk. The BB vs. BBB excess return convergence has been not all that shocking in 2024 given the overlap of the buyer base and the question marks around some mega issuers in the BBB tier with an abundance of long dated paper. We see the excess returns of BB and BBB running in a near dead heat with BBs seeing a small spread wave of +17 bps wider this week while the BBB tier was +4 bps wider.
The BB tier run rate in excess return YTD of +348 bps is positive, but it is light relative to some pre-COVID years. BB tier excess returns were +10.2% in 2019 coming off the late 2018 selloff. The 2017 BB tier excess return was +5.6% coming off a major rally in 2016 that saw a BB excess return of +11.9% as energy rallied. The -3.8% negative excess return in 2018 was driven by a sharp sell-off in 4Q18 and Dec 2018 that saw spreads spike from the cyclical low posted in early Oct 2018 to start the quarter.
The 4Q18 pricing dynamics was one of the stranger cyclical price actions we have seen in a long time. A brief oil crash was a contributor as oil plunged from a $70 handle to a $40 handle, but the broader economy was still in expansion mode. The US was mired in a renegotiation of NAFTA and tariff threats but was also enjoying Trump’s record tax cuts signed in Dec 2017. Then a series of FOMC easing actions later in 2019 got everything back on track until COVID in March 2020.

For excess returns, the material outperformance of CCCs comes closer to 2012-2013 that saw 14% handles for CCC in 2013 and just under 19% in 2012. While the CCC tier always has its share of issuer profile and constituent distortions and defaults/dropouts and distressed exchanges, 2024 has proven to be a credit risk maximization year in HY bonds.
A look at spreads…

The week in IG spreads was relatively uneventful as investors, underwriters and issuers wind down the year. The +4 bps on the week to +82 bps leaves IG set to start 2025 very much in the zone of prior cyclical credit peaks.
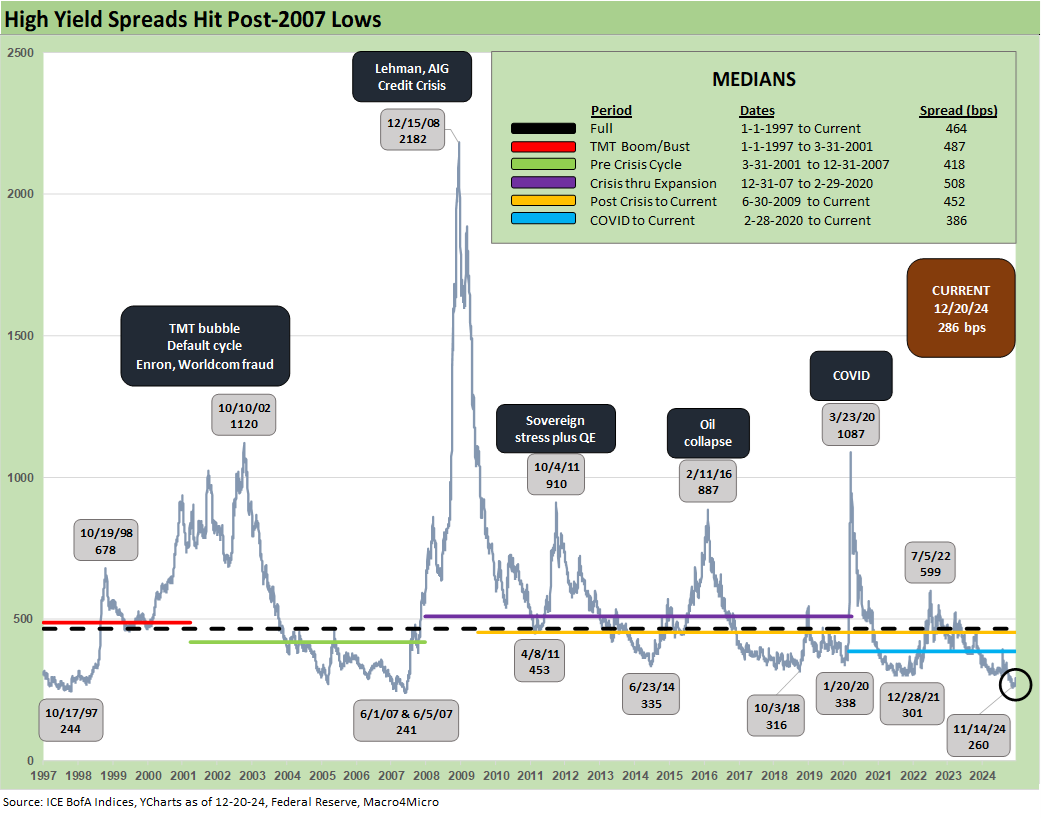
HY OAS saw a double-digit widening by +18 bps with HY remaining below the +300 bps line and right in the June 2007 strike zone.
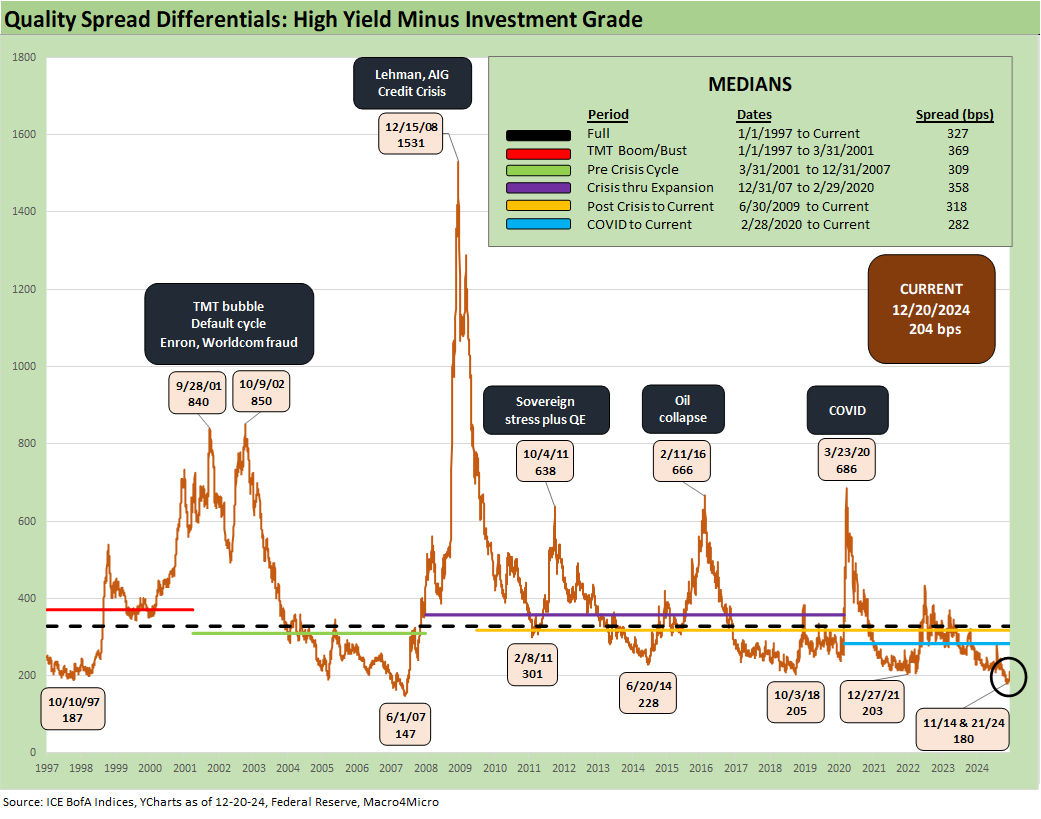
The move back above +200 bps line for the “HY minus IG” quality spread differentials still leaves the current market around the levels seen in the lows of Dec 2021, Oct 2018, and June 2024 even if well above the early June 2007 lows.

The +80 bps quality spread differential for “BB OAS minus BBB OAS” is wider than a range of low ticks seen in July 2024, March 2022, Dec 2019, and Oct 2018 but still inside June 2014. The current level is also distinctly wide to the low ticks of early June 2007 and March 2005.

The BB tier OAS moved +17 bps wider this past week to +182 bps, which is still tight to the levels seen in periods such as Oct 2018 and June 2014 in the pre-COVID period but closer to the Jan 2020 lows as the BB tier was trading well above par and many BB bonds traded above call prices.

The B tier is -53 bps tighter YTD 2024 after seeing B tier spreads narrow by -174 bps during 2023. The running effects of two solid spread compression years puts B tier OAS at +288 bps even after the +21 bps widening this past week. The +288 bps is well inside the credit cycle low points of +334 bps in Dec 2021, +335 in Jan 2020, +334 bps in Oct 2018, and +327 bps in June 2014.

The B vs. CCC time series above flags the points of more radical divergence between the two tiers when the CCC tier can take on the profile of higher risk equities with a coupon (see The B vs. CCC Battle: Tough Neighborhood, Rough Players 7-7-24 ). Those histories have been covered in past commentaries (see links below).

We plot the “CCC OAS minus B tier OAS” historical quality spread differential above in basis points. We highlight that there are times when the gap is better measured in dollar price points than bps such as during the TMT meltdown of 2000-2002 and during the peak of the systemic crisis in late 2008.
The current differential of + 442 bps is inside the long-term median of +484 bps. That translates into just under a 13-point differential. As a frame of reference, the Jan 2002 TMT meltdown (with an Enron-inspired accounting fraud anxiety contagion kicker) saw a B vs. CCC tier price differential of over 43 points.
A look at yields…
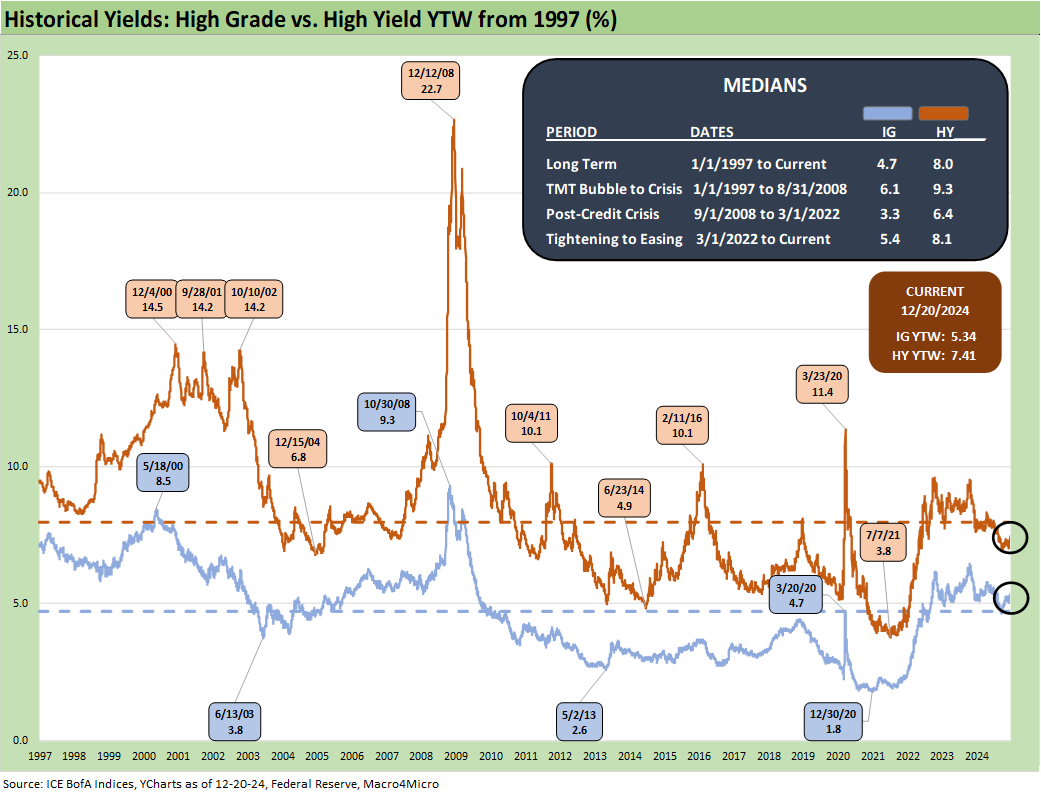
The above chart updates the time series and various timeline medians for the HY and IG index yields. Current yields ended the week at 5.34% for IG and 7.41% for HY after all the UST gyrations and recent spread widening.
As we have frequently pointed out in past commentaries, we view the pre-ZIRP yield framework as the most rational cyclical comparison and frame of reference for the current post-tightening cycle comparisons. That means that 6.1% for IG and 9.3% for HY set the bar.

The above chart updates our weekly comparison of the IG Yields for the recent close and for two notable credit cycle peaks in late 1997 and June 2007. Those are dates we often use for peak credit cycle comparison on yields and spreads (see HY OAS Lows Memory Lane: 2024, 2007, and 1997 10-8-24, HY Spreads: Celebrating Tumultuous Times at a Credit Peak 6-13-24). We also include the UST curves for each of those dates as a frame of reference.

The above chart does the same drill for HY index yields that we did for IG yields and the relevant UST curves. With extremely low spreads, the UST curve still sets the bar and the current HY index is the lowest yield of the three credit peaks posted by a comfortable margin.
See also:
Footnotes & Flashbacks: State of Yields 12-22-24
Footnotes & Flashbacks: Asset Returns 12-22-24
Mini Market Lookback: Wild Finish to the Trading Year 12-21-24
Trump Tariffs 2025: Hey EU, Guess What? 12-20-24
PCE, Income & Outlays Nov 2024: No Surprise, Little Relief 12-20-24
Existing Home Sales Nov 2024: Mortgage Vice Tightens Again 12-19-24
GDP 3Q24: Final Number at +3.1% 12-19-24
Fed Day: Now That’s a Knife 12-18-24
Credit Crib Note: Iron Mountain 12-18-24
Housing Starts Nov 2024: YoY Fade in Single Family, Solid Sequentially 12-18-24
Industrial Production: Nov 2024 Capacity Utilization 12-17-24
Retail Sales Nov24: Gift of No Surprises 12-17-24
Inflation: The Grocery Price Thing vs. Energy 12-16-24
Toll Brothers: Rich Get Richer 12-12-24
CPI Nov 2024: Steady, Not Helpful 12-11-24
Mini Market Lookback: Decoupling at Bat, Entropy on Deck? 12-7-24
Credit Crib Note: Herc Rentals (HRI) 12-6-24
Payroll Nov 2024: So Much for the Depression 12-6-24
Trade: Oct 2024 Flows, Tariff Countdown 12-5-24
JOLTS Oct 2024: Strong Starting Point for New Team in Job Openings 12-3-24
Mini Market Lookback: Tariff Wishbones, Policy Turduckens 11-30-24
3Q24 GDP Second Estimate: PCE Trim, GPDI Bump 11-27-24
New Home Sales Oct 2024: Weather Fates, Whither Rates 11-26-24
Mexico: Tariffs as the Economic Alamo 11-26-24
Tariff: Target Updates – Canada 11-26-24
Mini Market Lookback: Market Delinks from Appointment Chaos… For Now 11-23-24
Credit Crib Note: Ashtead Group 11-21-24
Mini Market Lookback: Reality Checks 11-16-24
Credit Crib Note: United Rentals (URI) 11-14-24
Mini Market Lookback: Extrapolation Time? 11-9-24
The Inflation Explanation: The Easiest Answer 11-8-24
Fixed Investment in 3Q24: Into the Weeds 11-7-24
Select Histories:
Mexico: Tariffs as the Economic Alamo 11-26-24
Tariff: Target Updates – Canada 11-26-24
Tariffs: The EU Meets the New World…Again…Maybe 10-29-24
Trump, Trade, and Tariffs: Northern Exposure, Canada Risk 10-25-24
Trump at Economic Club of Chicago: Thoughts on Autos 10-17-24
HY OAS Lows Memory Lane: 2024, 2007, and 1997 10-8-24
Credit Returns: Sept YTD and Rolling Months 10-1-24
HY Industry Mix: Damage Report 8-7-24
Volatility and the VIX Vapors: A Lookback from 1997 8-6-24
HY Pain: A 2018 Lookback to Ponder 8-3-24
Presidential GDP Dance Off: Clinton vs. Trump 7-27-24
Presidential GDP Dance Off: Reagan vs. Trump 7-27-24
The B vs. CCC Battle: Tough Neighborhood, Rough Players 7-7-24
HY Spreads: Celebrating Tumultuous Times at a Credit Peak 6-13-24
Credit Markets Across the Decades 4-8-24
Credit Cycles: Historical Lightning Round 4-8-24
Histories: Asset Return Journey from 2016 to 2023 1-21-24
Credit Performance: Excess Return Differentials in 2023 1-1-24
Return Quilts: Resilience from the Bottom Up 12-30-23
HY vs. IG Excess and Total Returns Across Cycles: The UST Kicker 12-11-23
HY Multicycle Spreads, Excess Returns, Total Returns 12-5-23
US Debt % GDP: Raiders of the Lost Treasury 5-29-23
Wild Transition Year: The Chaos of 2007 11-1-22
Greenspan’s Last Hurrah: His Wild Finish Before the Crisis 10-30-22