
Toll Brothers: Rich Get Richer
We update Toll’s results and financial profile and revisit running homebuilder stock returns as the industry winds down 2024 with a fade.


I am bored. I think I’ll surf the Toll Brothers website.
Toll’s numbers show strong home sales gross margins for 4Q24 but only slightly tighter for FY 2024 vs. FY 2023 while comfortably ahead of 2019 to 2022.
Annual price per unit weighed in at a cool $977K per unit, which is lower than 2023’s $1.03 million on regional mix but well ahead of prior years with the Pacific continuing to tip the scale with average selling prices of $1.5 million.
The balance sheet keeps getting stronger as Toll clears 2024 with total debt materially lower since 2019, the debt to cap % halved over 5 years, and cash + inventory coverage of total debt at a high of 3.9x, up from 2.3x in 2019-2020.
The TOL stock price took a hit after earnings but still ranks #1 YTD and LTM in the peer group and is running well ahead of the S&P 500 during those time frames until the recent weakness in homebuilder equities and notably the past 1-month horizon.
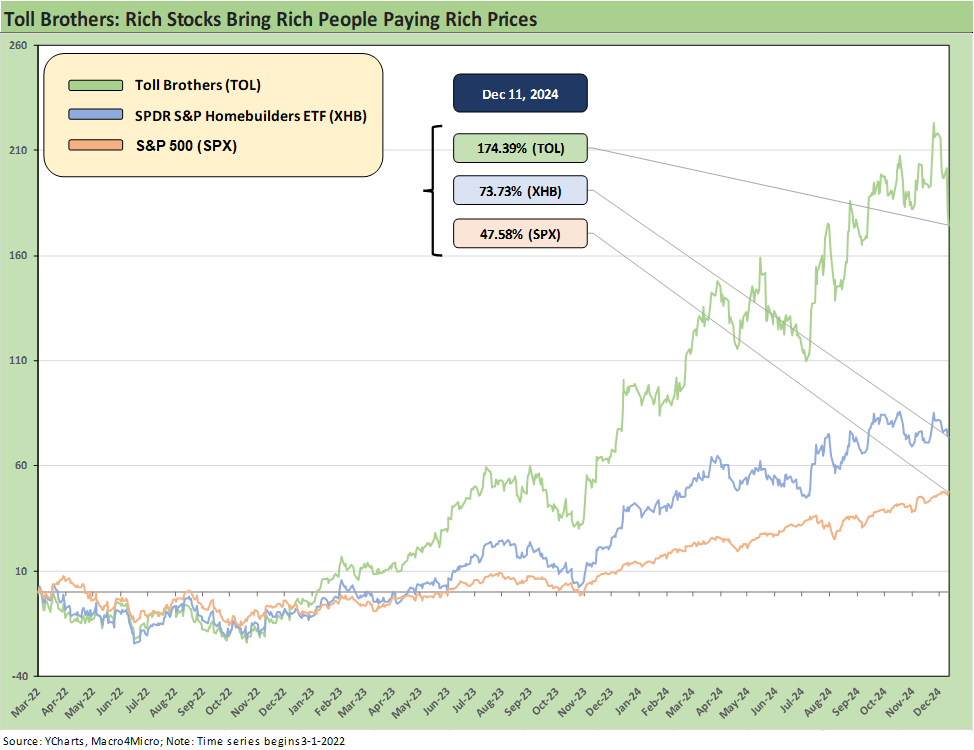
The Homebuilders were delivering a stellar performance in equities to end 2023 and across 2024 before a late year fade. We have been detailing return trends in our weekly Footnotes publication on asset returns (see Footnotes & Flashbacks: Asset Returns 12-8-24). The above chart shows the running total returns since March 1, 2022 (just before the end of ZIRP) for TOL. We frame TOL vs. the Homebuilder ETF (XHB) and the S&P 500, and the material outperformance by TOL is clear enough. That post-March 2022 period cuts across the worst tightening cycle since Volcker and a bout of high 7% and 8% area mortgage peaks.
Toll traded lower this week after the 4Q24 earnings release (presumably on softer margin guidance vs. expectations). Gross margin fixation is an old school homebuilder equity instinct, but guidance of over 27% for FY 2025 gross margins is impressive enough given all the crosscurrents that need to be factored in on tariffs and labor.
Toll pointed out the adjusted gross margin performance of 27.9% for 4Q24 beat guidance as did the SG&A ratio of 8.3% of home sales (note: Adjusted gross margins exclude interest and inventory write-downs). The number of contracts (orders) was up by +30% in 4Q24 YoY while contract value was +32%. The 27.9% adjusted gross margins is below the adjusted metric of 29.1% in 4Q23, but that is vs. a very high comp in industry context (Pulte is on the high end of the margin tiers, see PulteGroup 3Q24: Pushing through Rate Challenges 10-23-24).
Toll could use words such as “record” revenues and “record” earnings, so the results were quite strong. The stock price action is more about debating 2025 vs. valuations where they exist today in the top tier of the builders. From the standpoint of trailing run rates and credit quality, the 4Q24 numbers were quite strong. The results evidence impressive financial health better than the current credit ratings, and the rest is about debating what lies ahead for mortgages, household finances, and the economic cycle.
Some important industry thoughts from Toll…
Toll spent some time talking about the broader industry and made some interesting points on the homebuilding sector. They are worth a quick highlight:
Demographics: The sheer force of demographic demand is still the ultimate tailwind, and it is about matching the product with the region, the price, and cost of delivering that home. Many first-time buyers can buy million-dollar homes as they move along their way in a US economy that has generated a lot of wealth. Toll’s product niche is in luxury, so the broader wealth creation matches up well with Toll’s core competency. During 4Q24, Toll saw 28% of their buyers pay “all cash.”
First-time buyers % total buyers: The first-time buyer is down to 24% of the market over the past year and stands at a 40-year low. Toll’s context for that stat is that the vast majority of buyers in the market are “move up” or “move down” buyers. In other words, the activity is dominated by those cashing out home equity to “buy more house” (our words) or those moving into the empty nester trade or trading down (e.g., in retirement) to unlock liquidity.
Median age of first-time buyers: The median age of first-time buyers is at an all-time high of 38 years old.
Median age of all buyers: 56 years old. We would be curious to see the median age of sellers and the mix of sellers “unlocking value” for retirement. Presumably the “retirement trade” will free up more existing home inventory when (if) mortgage rates are friendlier.
Median age of existing homes: The median age of the existing housing stock is over 40 years, so new homes are compelling and especially when existing homes for sale are light.
Home equity: Toll quoted Federal Reserve statistics on home equity, indicating that 73% of home value is in equity. These types of stats show up each quarter in the Fed Z.1 report among other sources.
Where these stats flow into Toll Brothers is that 28% of their business is selling to well-heeled first-time buyers while also selling to buyers taking profits on their existing home equity base. With high down payment requirements on very expensive homes, Toll also boasts industry-low cancellation rates of 2.5% in 4Q24. The mix of top-down trends around the new home market is consistent and compelling when it comes to a luxury brand like Toll. It is part of a distinctive aspect of the Toll business risk story – as in their business risks are lower in aggregate.
Builder equity performance is still a big story for 2024 and since the Oct 2023 10Y UST peak…

The above table details the major homebuilder peer group equity returns across multiple time horizons. We see the ugly 1-month period. A review of the chart still tells a good story for Toll and major builders when you hold that performance up to the traditional view that rising interest rates is a reason to run away from the homebuilding segment. The Homebuilder peer group has been crushing the market and had been running at #1 YTD and LTM for a good part of 2024.
The recent fade since the Sept lows in the 10Y UST around 3.6% and 30Y mortgages near 6.0% has seen the Homebuilder ETF (XHB) drop into the 3rd quartile for 1-month and 3-month time horizons in our running asset return rankings each week. XHB is hanging in the 2nd quartile YTD and in the top quartile at #5 for the LTM period. As recently as the third week of Oct, XHB was #1 in LTM returns (+73%) in our peer group of 32 benchmarks and ETFs. For YTD returns, XHB was #1 at +30% at the end of Sept as XHB sparred with Utilities (XLU) for the top spot in Oct.
A combination of rising mortgage rates and valuation concerns into 2025 had sent the builder equities into a backpedal even if confidence in financial risk and credit quality remains high. We see the major builders in the BBB and BB tier as underrated on the credit side given their demonstrated ability to navigate a high mortgage rate market while reducing debt, buying back stock, and in some cases distributing cash via dividends.

Toll equity sold off supposedly on weaker gross margin expectations than the market consensus. Average selling prices are down modestly in the guidance to a $955K midrange. That falls below the $1.08 million number in the current backlog. The price guidance gets swept up in the geographic mix assumptions with the Pacific always in a different tier of pricey. The South has been rising faster as we show in the next chart.
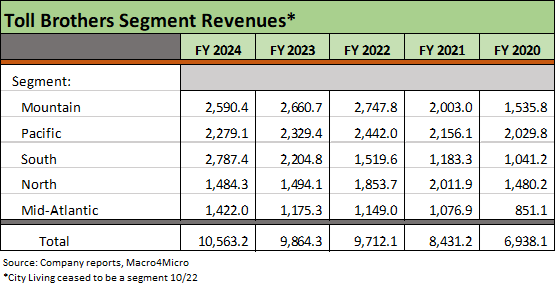
Segment revenue is detailed above, and the trends to watch include the question of regional mix. The eye-popping price tags on West Coast real estate for a luxury builder can move the average price around when there are regional shifts. In the above revenue mix, we see strong growth in the South and a modestly higher growth rate in the Mid-Atlantic. The most notable mix shift in recent years is the growth in the South region by over 2.5-fold since 2020 vs. overall home sales revenue growth of 55%.

The above chart frames the average price per unit for each Toll geographic segment. The numbers offer a reminder that there is nothing quite like Toll in the major homebuilder space. There is also nothing quite like Toll’s Pacific segment price levels at $1.5 million (see Homebuilders: Updating Equity Performance and Size Rankings 7-11-24).

The above chart details the decline in gross debt, the lower book value leverage, and the rise in asset protection metrics with “cash + inventory” coverage of total debt at just under 4x vs. closer to 2x in 2019. Total debt has declined by over $1 bn since 2019 and 2020 and is down almost $500 mn since 2022. We see net debt to capitalization at 15.2% vs. over 33% at the end of 2020 and just under 33% at the end of 2019.
If we look at net debt/cap using the market adjusted value of equity, we see that debt % cap ratio decline to 8.7% (using 12-11-24 TOL prices). Toll has a strong balance sheet by any measure and could easily justify higher credit ratings given how the builder model has been “proven” across COVID, supplier chain shocks, and the worst inflation and tightening cycle since the Volcker years.
See also:
Footnotes & Flashbacks: Credit Markets 12-9-24
Footnotes & Flashbacks: State of Yields 12-8-24
Footnotes & Flashbacks: Asset Returns 12-8-24
Mini Market Lookback: Decoupling at Bat, Entropy on Deck? 12-7-24
Housing:
New Home Sales Oct 2024: Weather Fates, Whither Rates 11-26-24
Existing Home Sales Oct 2024: Limited Broker Relief 11-21-24
Housing Starts Oct 2024: Economics Rule 11-19-24
Harris Housing Plan: The South’s Gonna Do It Again!? 8-28-24
Homebuilders:
PulteGroup 3Q24: Pushing through Rate Challenges 10-23-24
KB Home: Steady Growth, Slower Motion 9-26-24
Lennar: Bulletproof Credit Despite Margin Squeeze 9-23-24
Credit Crib Note: PulteGroup (PHM) 8-11-24
Credit Crib Note: D.R. Horton (DHI) 8-8-24
Homebuilders: Updating Equity Performance and Size Rankings 7-11-24
Credit Crib Note: KB Home 7-9-24
Lennar: Key Metrics Still Tell a Positive Macro Story 6-20-24
Credit Crib Note: NVR, Inc. 5-28-24