
Mini Market Lookback: Decoupling at Bat, Entropy on Deck?
The week was mixed at best for industry level risk with tech strong while UST rallied despite the rebound in payroll.


Not to worry…we’ll get some through…more where they came from.
With a countdown to painfully high tariffs and mass deportation, a war at the crossroads in Europe, a cloud over NATO, serious tension with China, an incompetent martial law moment in South Korea, the Middle East always a wildcard, and a cabinet lineup that looks like a Dick Tracy character list, the disorder has not held back rolling returns even if this week was on the weaker side for industry performance.
New highs for the S&P 500 and NASDAQ during the week masks the lack of breadth with 8 of 11 S&P 500 sectors in the red despite a constructive payroll release and strong JOLTS numbers as evident in job openings (see Payroll Nov 2024: So Much for the Depression 12-6-24, JOLTS Oct 2024: Strong Starting Point for New Team in Job Openings 12-3-24).
The bond ETFs went 7 for 7 in positive range in the 32 benchmarks and ETFs we watch, but the positive vs. negative score was only 15-17 this week with tech shining and bonds in the positive column. The prior week was 29-3.
The odds of a -25 bps cut soared after the payroll numbers on the goldilocks consensus, and the UST slope debate can start anew around what the mix of inflation and economic variables will mean after inauguration day tariffs and deportations amp up.

With asset returns a near tossup this week at 15 positive and 17 negative, the large cap benchmarks hit highs. Tech-centric line items carried by Mag 7 heavy ETFs took 3 of the top 4 spots accompanied by NASDAQ and the S&P 500, which were carried to new highs by the Mag 7 rally we detail in the next chart. The Equal Weight NASDAQ 100 ETF also made a rare appearance in the top quartile. The EM Equities ETF (VWO) and long duration UST 20+Y ETF (TLT) also made the top quartile with the other 6 of the 7 bond ETFs we track in the second quartile.
Energy was sitting on the bottom with E&P (XOP) in last place and the broad Energy ETF (XLE) just above it. We see the bottom quartile featuring a few ETFs that are sensitive to the direction of long rates (XHB, XLU, XLB) even with the rally in UST. This might raise some questions around equity market conviction on inflation risk and steepening risk out the curve.
Taking some chips off the table might be a plan for those who actually know that the buyer pays the tariffs (not the selling country) and the supply-demand balance for labor can flow into price levels and wage expectations whether you call it inflation or just “higher prices” and more reductions in purchasing power.

The above chart updates the tech bellwethers in descending order of total returns on the week. Tech crushed the market this week. The debate on tech valuations will rage on, but the commitment of the Trump 2.0 team to sectors such as AI and Bitcoin and lower corporate taxes and regulations keep the investor base pumped as they all play “fun with forecasts” and “pick a multiple.”
Solid payrolls and lower UST rates on the week help the mindset of many even if non-tech holders might have more questions around what tariffs and mass deportation mean for long rates, inflation, and unit cost risks. This week’s CPI numbers should loom large in shaping sentiment.
Tesla continues to surge for rational reasons and some that are more dark and sinister. The reality is Musk owns the EV sector and Trump hates government supported EVs, but this allows Musk to take his time owning it and slowly building out his future ambitions to dominate the lower price tiers as well over time. The EV struggles of the legacy mass production OEMs are not going to get easier, but those are topics for another day. TSLA has also eclipsed the defense sector in headlines around space, rockets, and satellite bragging rights, so (love him or hate him) the guy rules the roost.
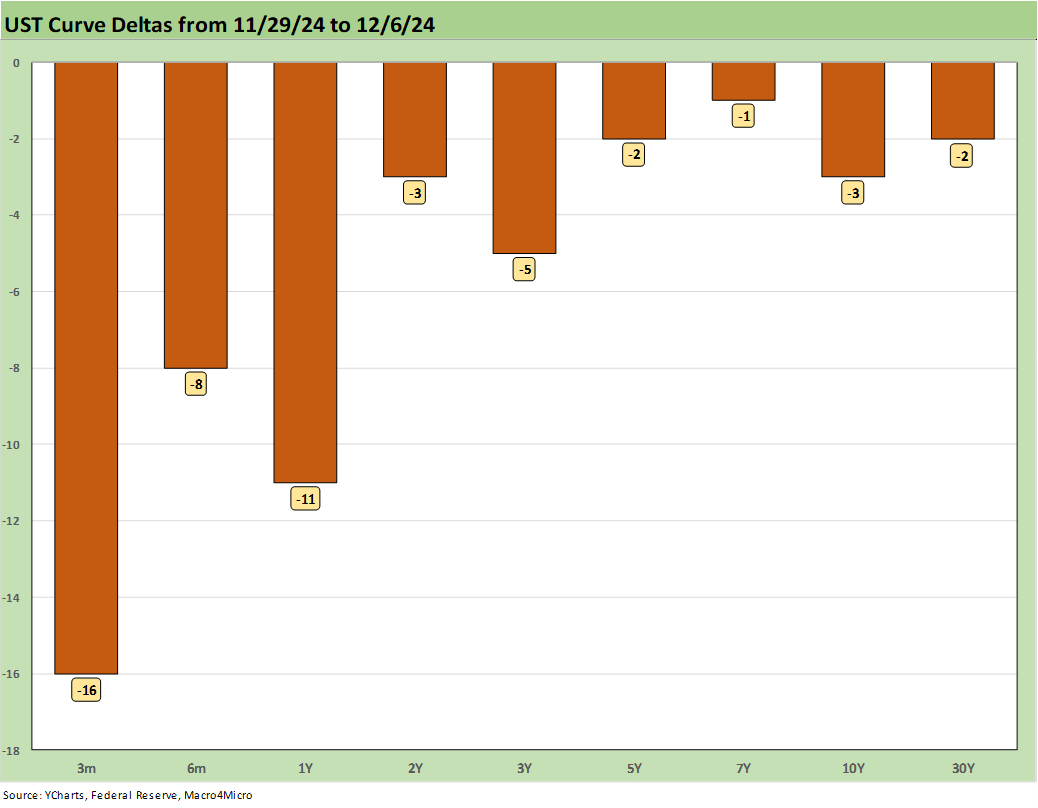
The above chart updates the UST deltas on the week and the odds of -25 bps cleared Friday as a near certainty. The long end of the curve is a much more complicated set of moving parts as we cover separately in our weekly Footnotes publications on yields. The deficit and UST supply and promise of trade stress with major holders of UST is not a great starting point for the long end chasing the fed funds lower.

The above chart updates the running 10Y UST and Freddie Mac 30Y mortgage this week with both seeing some relief with the 10Y UST barely lower vs. last week. The mortgage benchmark ticked down to 6.69%. That is a move in the right direction but still well above the late Sept levels that were closer to +6.0%.
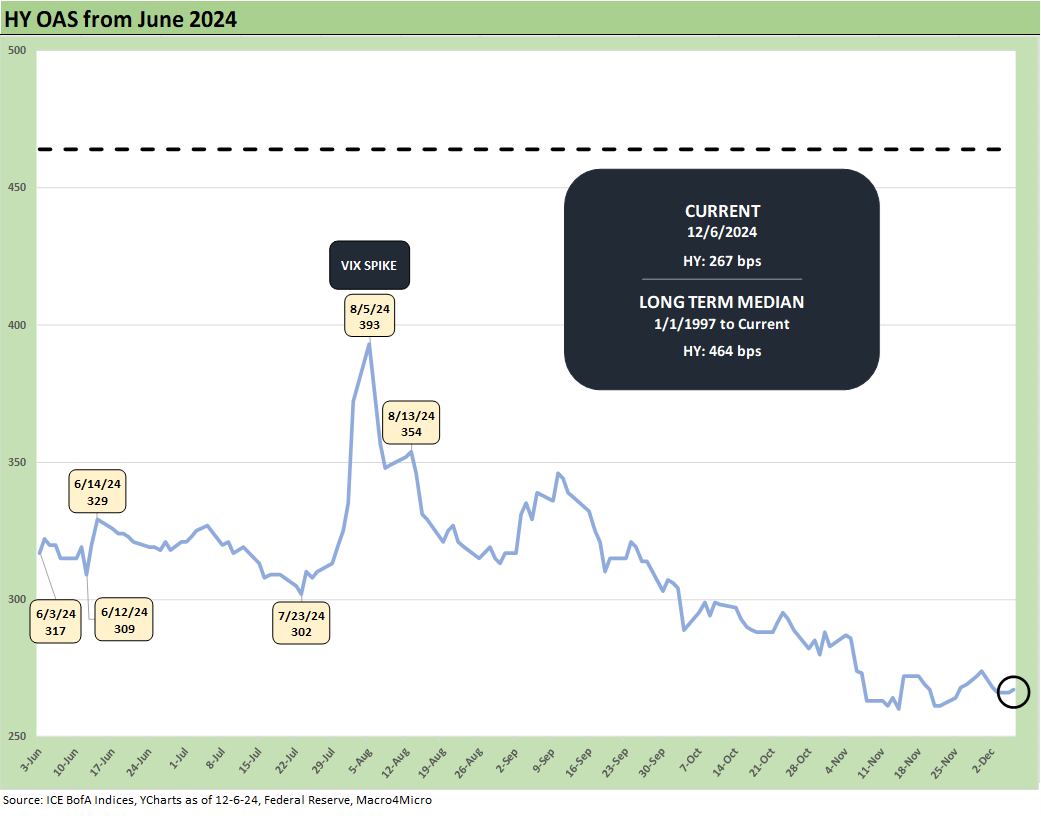
The above chart updates the HY OAS trend line as HY OAS moved -5 bps tighter to +267 bps or very much in the June 2007 and late 1997 range (see HY OAS Lows Memory Lane: 2024, 2007, and 1997 10-8-24, HY Spreads: Celebrating Tumultuous Times at a Credit Peak 6-13-24).
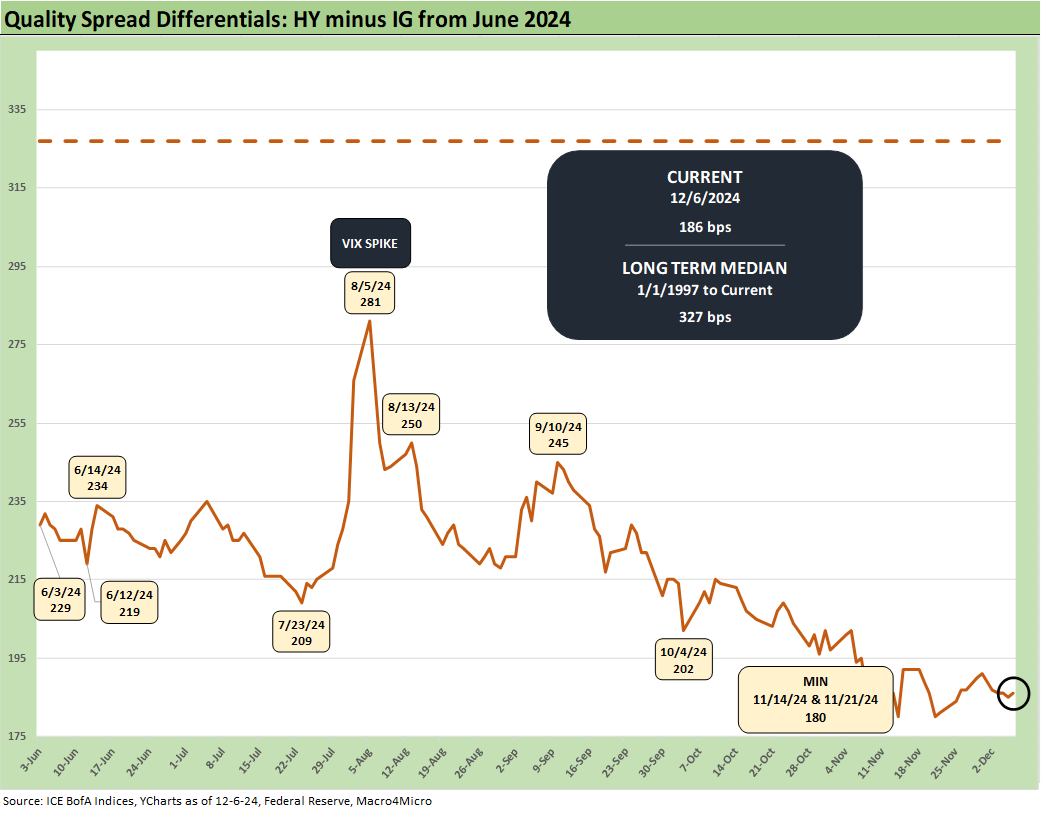
The above chart updates the “HY OAS minus IG OAS” quality spread differential that narrowed by -4 bps on the week to +186 bps as the compensation for HY risk started tight and stayed tight. The long-term median of +327 bps is in a different zip code.
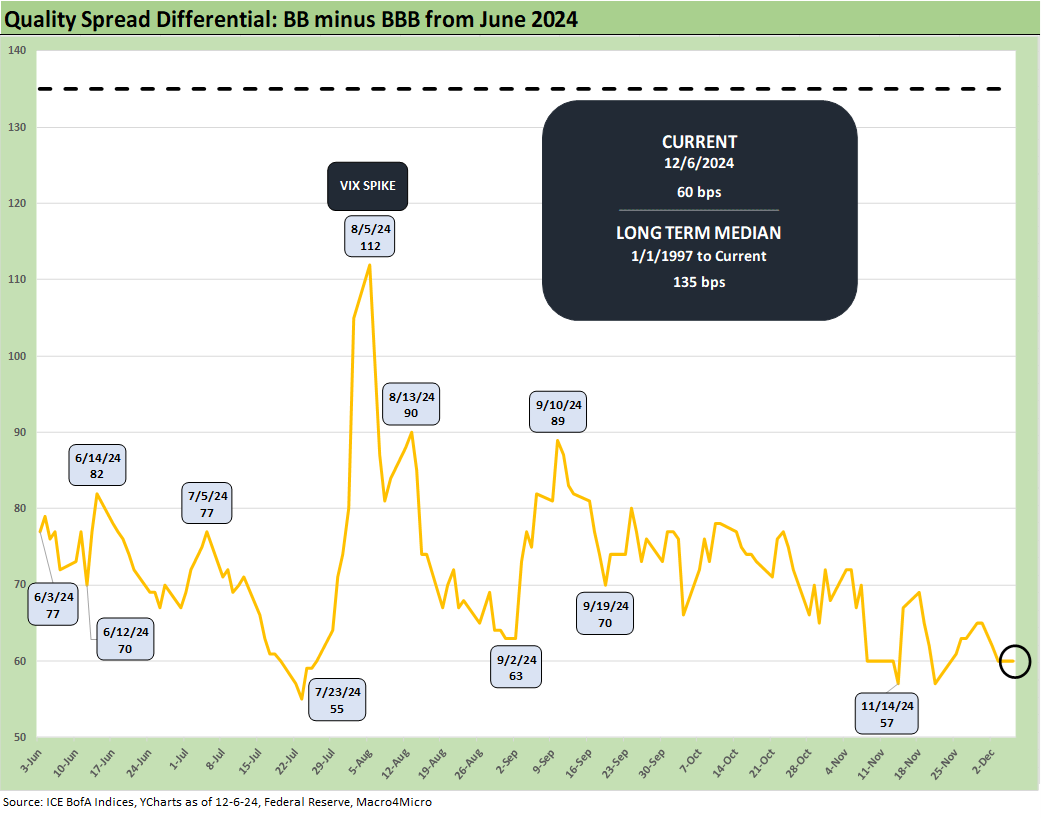
The above chart updates the “BB OAS minus BBB OAS” quality spread differential. The metric tightened by -5 bps on the week back to +60 bps or +5 bps wide to the late July tights of +55 bps.
See also:
Credit Crib Note: Herc Rentals (HRI) 12-6-24
Payroll Nov 2024: So Much for the Depression 12-6-24
Trade: Oct 2024 Flows, Tariff Countdown 12-5-24
JOLTS Oct 2024: Strong Starting Point for New Team in Job Openings 12-3-24
Footnotes & Flashbacks: Credit Markets 12-2-24
Footnotes & Flashbacks: State of Yields 12-1-24
Footnotes & Flashbacks: Asset Returns 12-1-24
Mini Market Lookback: Tariff Wishbones, Policy Turduckens 11-30-24
PCE Inflation Oct 2024: Personal Income & Outlays 11-27-24
3Q24 GDP Second Estimate: PCE Trim, GPDI Bump 11-27-24
New Home Sales Oct 2024: Weather Fates, Whither Rates 11-26-24
Mexico: Tariffs as the Economic Alamo 11-26-24
Tariff: Target Updates – Canada 11-26-24
Mini Market Lookback: Market Delinks from Appointment Chaos… For Now 11-23-24
Credit Crib Note: Ashtead Group 11-21-24
Existing Home Sales Oct 2024: Limited Broker Relief 11-21-24
Housing Starts Oct 2024: Economics Rule 11-19-24
Mini Market Lookback: Reality Checks 11-16-24
Industrial Production: Capacity Utilization Circling Lower 11-15-24
Retail Sales Oct 2024: Durable Consumers 11-15-24
Credit Crib Note: United Rentals (URI) 11-14-24
CPI Oct 2024: Calm Before the Confusion 11-13-24
Mini Market Lookback: Extrapolation Time? 11-9-24
The Inflation Explanation: The Easiest Answer 11-8-24
Fixed Investment in 3Q24: Into the Weeds 11-7-24
Morning After Lightning Round 11-6-24