
HY Pain: A 2018 Lookback to Ponder
With HY spreads battered last week, we look back at 2018 for a historical comp in an economic expansion coming off cyclical OAS tights.


There’s no denying that 2018 was an unpleasant visit.
At the end of this past week, we saw some reference to 2018 as food for thought in this current spread wave in the midst of a debate on a cyclical turn, so we revisit what was a very bad year for assets in a late cyclical period of 2018.
The year 2018 saw some 1000-point declines in the S&P 500 early in the year (Feb 2018) that later rallied sharply to all-time highs in equity benchmarks; experienced some VIX closes in the upper 30 range with the S&P 500 posting two declines over 1,000 points in the same week; saw oil eventually rise to post-Nov 2014 highs before tanking at year end; and trade stress was a threat (the renegotiation of NAFTA). Basically, 2018 was a very strange year.
While there are plenty of differences in the monetary backdrop between 2018 (a tightening cycle or “normalization” year) and 2024 (a likely easing cycle starting very soon) and in terms of industry concentration (the energy default wave was ongoing in 2018), there was also the achievement of HY OAS lows in 2018 (10-3-18) ahead of a very dramatic 4Q18 sell-off.
We look at the wild swings of this past week as HY OAS gapped wider by +37 bps on “payroll day” and +62 bps for the trailing week even as the UST brought some winnings for the suffering YTD duration trade.
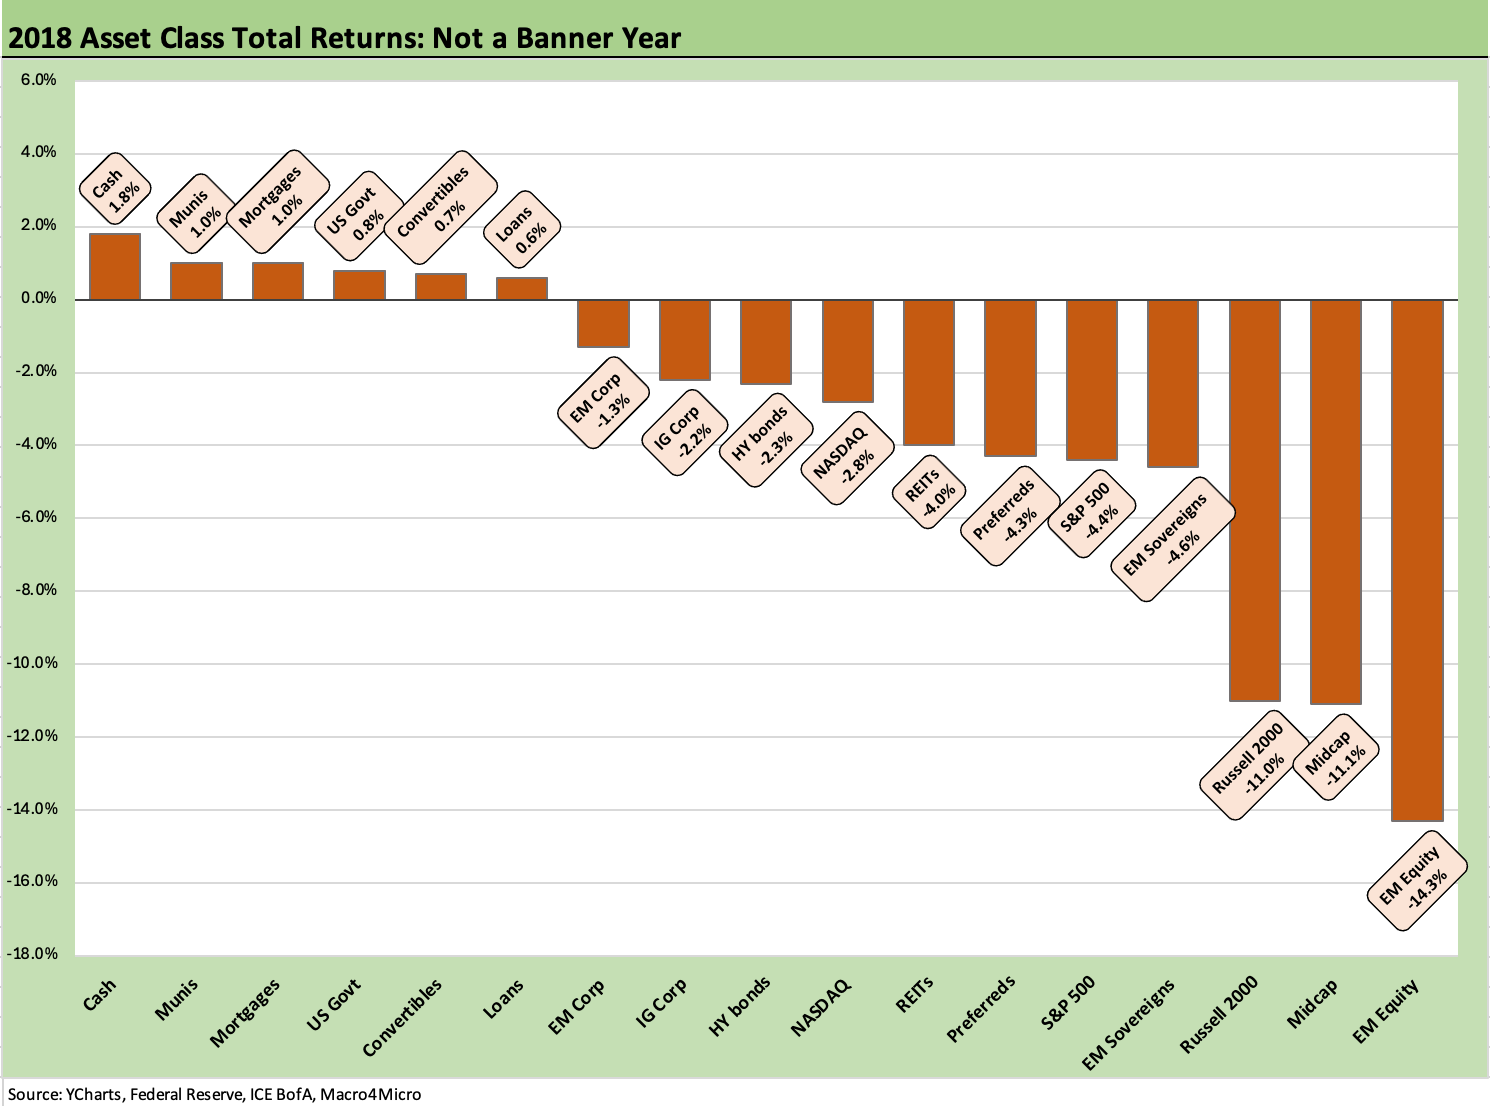
The above chart looks back at 2018 asset returns as part of a lookback exercise.
Despite all the spin around what marvelously good times the world, the economy and the market had during the Trump term and his “greatest economy in the history of the world” (see Presidential GDP Dance Off: Clinton vs. Trump 7-27-24, ), the year 2018 was an especially grim year for asset returns as detailed in the above asset return chart.
The numbers tell the story. The chart lines up a range of debt and equity benchmarks from left to right (best to worst) starting with cash as the # 1 performing asset class in the mix on across to the #17 ranked asset class in EM Equity.
While there have been plenty of years with worse debt and equity returns, this was a year with the worst top ranked returns in the history of debt and fixed income benchmarks. After all, cash always had a higher return before the ZIRP years. The year 2018 was a Fed “normalization” year. “Normalization” meant getting FOMC flexibility back and had started at the end of 2015 with 2018 seeing its last hike to a 2.25% to 2.5% fed funds band by Dec 2018. There had been 9 hikes since Dec 2015 and 4 hikes in 2018.
With the economy in some disarray in 2018 and into 2019, the asset returns are telling a story. So was the fact that Dec 2018 was the last Fed hike. By early 2019, the market was seeing an inversion on the front end as trade clashes, weaker capex, and struggling exports eventually sent the FOMC into easing mode in 2H19 with three 25 bps cuts.
The economy was well into an expansion that started after the June 2009 recession trough, and the Fed had to reverse its normalization plan to support the Trump economy. That part of the story has similarities to the current backdrop except now there is a steep inversion and not such low absolute rates as seen in 2018. The FOMC may need to offer some relief ASAP today if they can get past the inflation anxiety. The year 2018 was not an inflation worry year but one where the Fed needed to get its toolbox reassembled in case it needed to ease in an emergency (as it soon needed to in COVID).
2018 vs. 2024: Spread Pain Parallels?
In the next few charts, we look at the ugly turn in assets and risk pricing in 2018. The brutal spread whipsaw back is why the 2018 parallel is coming up in discussions around the equity and HY market in 2024. Last week definitely got tongues wagging after such a period of strong equity returns and favorable returns on credit risk as the UST curve now rallies with the 10Y UST under 4% (3.8% as of Friday close).
While the current tech valuation excess in the AI craze may have more 1999 flavor ahead of that “crash and burn” of the TMT cycle from 2000 to 2002, the current AI boom is not driven by debt. That takes us back to the 2018 comparison. The extraordinary HY spread gap of 4Q18 is likely to be on the minds of HY investors considering how to frame the very ugly HY OAS widening of the past week. Back in 1999, the default cycle was already underway.
We are not close to a default cycle in HY bonds now. The potential for repricing in private credit is not a HY bond default cycle. It would be a repricing of risk if this current spread wave continues. The current economy is still in expansion mode with higher average credit quality, good earnings, with tight spreads in historical context (so far), more attractive coupons for investors on refinancing, and low default rates (admittedly a lagging indicator).
We will dig into the credit markets of the past week in our separate credit markets Footnotes publication, but the spike to +372 bps from recent flirtations with the +300 bps line are reminiscent of 2018. Back in that 4Q18 period, the Dec 2018 month by itself widened by +104 bps after touching down at +316 bps on 10-3-18. Across Oct, Nov, and Dec of 2018, the running HY OAS widening totaled +205 bps for the 4Q18 period.
For 2018, the UST curves started rewarding duration after a rough period that came with a sharp upward shift in the UST curve through 3Q18. That was before the UST curve smelled trouble and started to shift down again across 4Q18 even as the Fed eventually went into ease mode later in 2019.
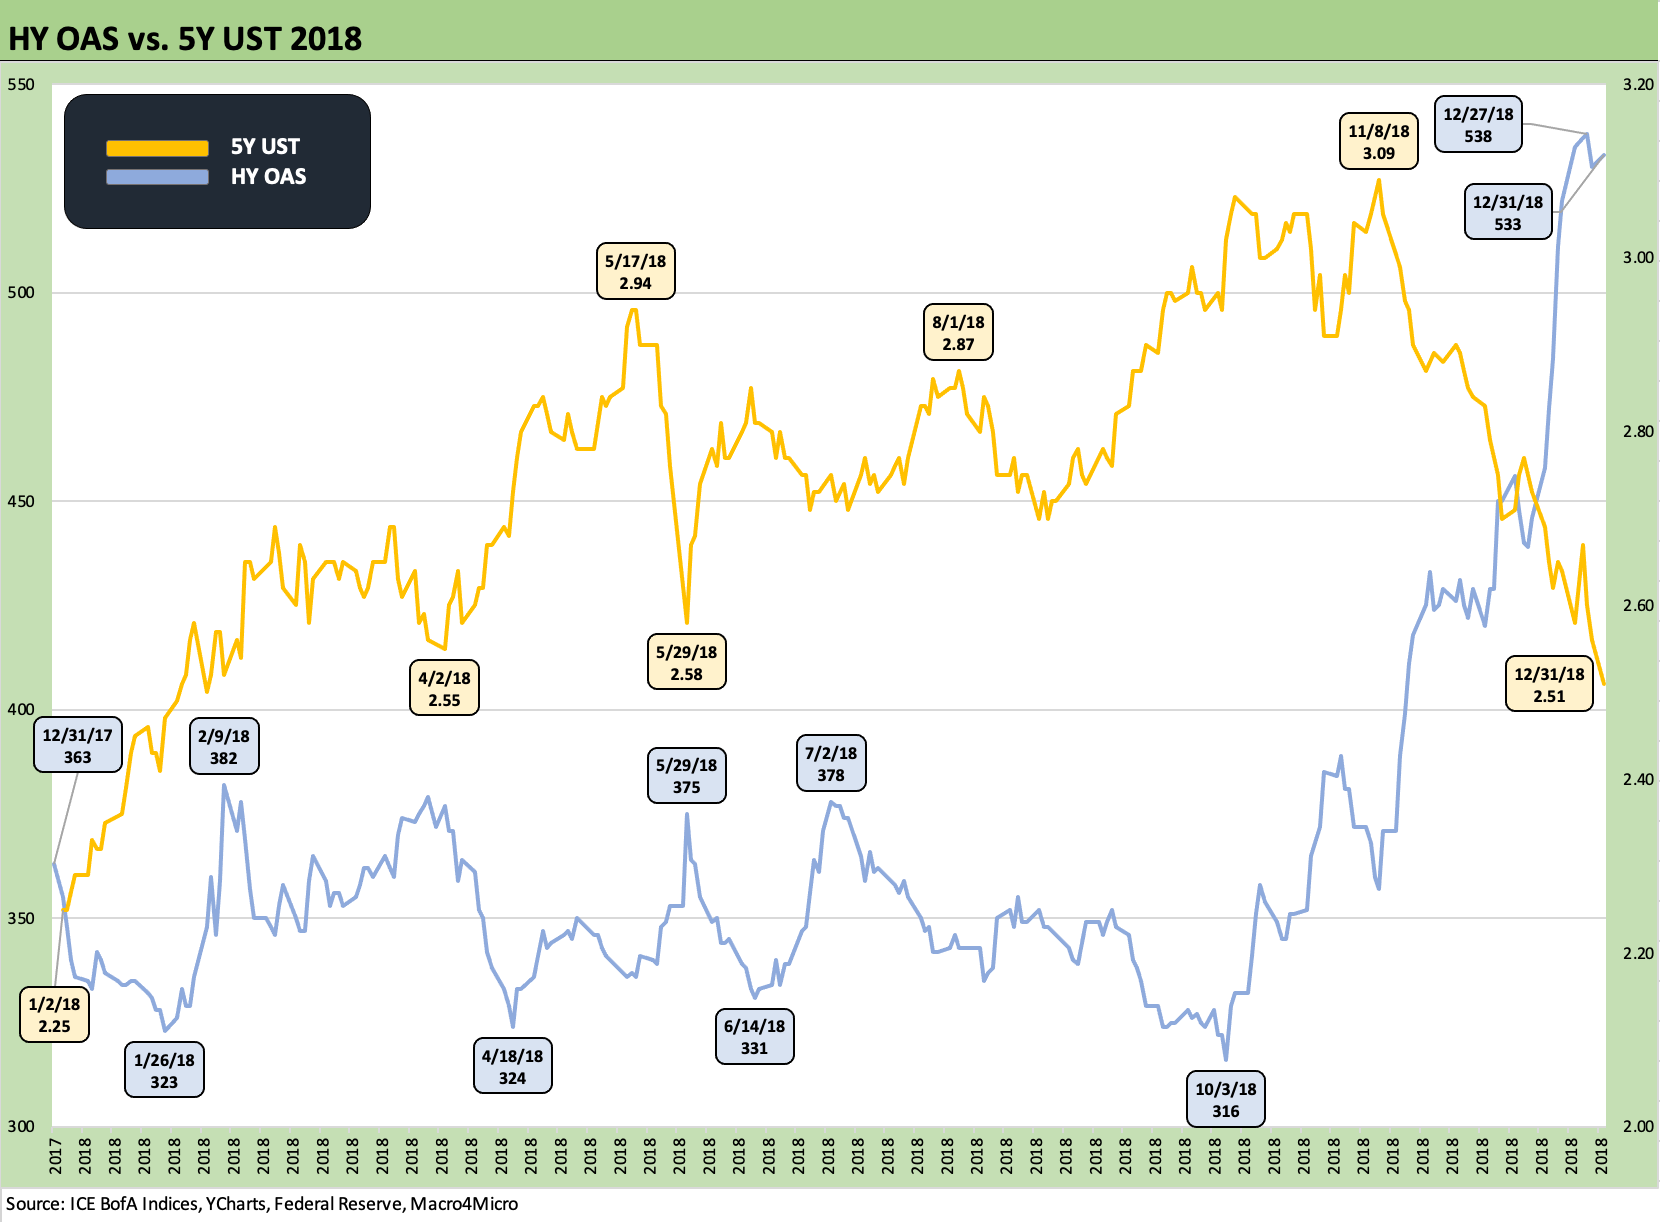
The above chart revisits the nasty finish to 2018 in HY OAS. We plot HY spreads against the 5Y UST to highlight that spreads were going one way by the end of the year (much higher) and a UST curve that was supposed to be normalizing slowly instead went in the opposite direction. The FOMC support picked up later in 2019.
Those UST curve migration patterns across 2018 and into 2019 gave risk assets and the economy the support it needed until it all blew up with COVID in later 1Q20. It is clear in late 2018 and into 2019 the economy was struggling regardless of what the revisionists and story tellers say in the current election year. That is why the Fed acted in 2019.
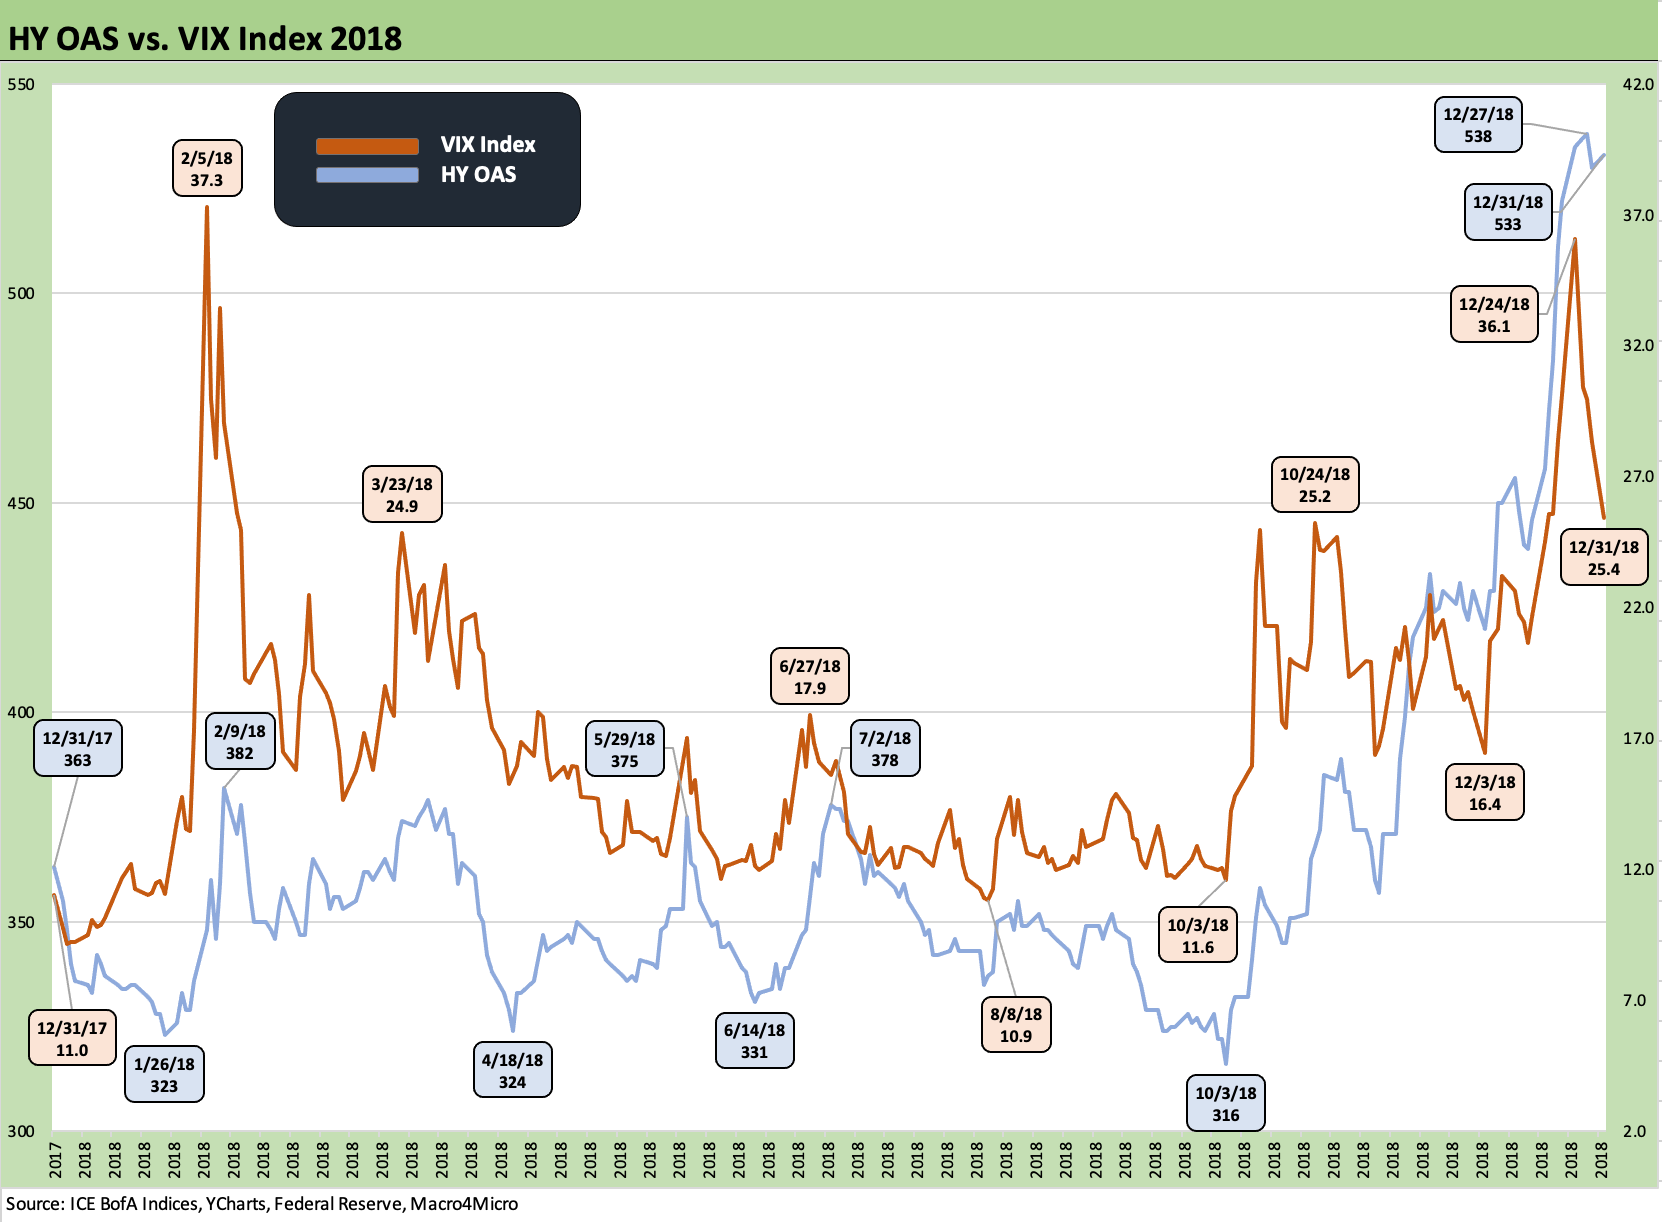
The interplay of equity market volatility with HY is always an important X-factor, but 2018 had its most volatile market moments early in the year with two 1000+ point drops in the same week in early February. Those dives generated some headlines that faded as the equity markets moved on to the late summer and early fall all-time highs.
We look at some of the VIX levels in the chart above as well since Friday saw the VIX close just below 24. It takes a lot to get the VIX above 30 (VIX just missed 30 intraday Friday) while 40 handles are associated with some very troubling systemic backdrops. Back in 2018, we saw two high 30-handle VIX spikes to the 36 and 37 areas in Feb around the 1000-point drops. We saw it again in Dec 2018 as the market melted down.
As a frame of reference in other parts of the cycle, the systemic fears around the Eurozone sent the VIX to almost 46 back in May 2010 with the initial wave of Greece headlines that in turn beat up HY OAS for some weeks. The market revisited the 40 handle level in the summer of 2011 with a fresh peak in Aug 2011 at 48 on the VIX when Europe was still a mess. The US sovereign rating was downgraded as defaults were threatened by the GOP House leaders looking to derail Obama ahead of an election year in 2012. Another big VIX spike in that cyclical timeline came in at just under 41 on the VIX with the China jitters of Aug 2015.
As the year 2018 went on, we interestingly saw all-time highs on the major large cap equity benchmarks and the small caps into late August and Sept 2018. HY spreads reached a low for the cycle at +316 bps in early Oct 2018 (10-3-18), and then the pain set in with a 2018 close of HY OAS at +533 bps. Back in 2018, the month of Dec ranked among the worst 20 excess return months during the years since 1996 (note: excess return tracking missed the 1980s and the credit market downturn of 1989-1990).
As a frame of reference, the recent tightening cycle of 2022 saw HY OAS fall just short of +600 bps in July and spent some time above +500 bps in the summer and fall (see HY Spreads: Celebrating Tumultuous Times at a Credit Peak 6-13-24). We update recent spread trends in more detail separately. The balancing act of spread widening and UST support to bonds will get very interesting from here into the home stretch of the year and the FOMC decisions ahead.
If anything, the year 2018 reminds us that a lot can happen in a hurry even without an overwhelming amount of fundamental pressures across industries. In 2018, energy was still a problem in credit markets given the size of the HY upstream issuer base. The swing from mid-$70 WTI in the fall of 2018 to low $40 handle in Dec 2018 was one fundamental rationalization for some of the extreme CCC tier pain, but the explanation of that 4Q18 swoon was hard to detail back then and remains a challenge in retrospect.
We will see where the HY market goes from here, but credit fundamentals and earnings trends are not a major problem despite the usual dogs. FactSet has been updating the quarterly earnings scoresheet and the numbers overall are pretty solid (approximately 75% of S&P 500 reported) and the expectation is 2Q24 earnings growth rates around the 10% area when the smoke clears. Of course, HY has a much longer tail beyond large caps and cuts across mid and small caps and private companies.
The low end of the HY market has its issues, but a case can be made that it lacks the vulnerability of the 2018 exposure to Energy and problem balance sheets seen in earlier credit cycles. We covered that in a recent commentary (see The B vs. CCC Battle: Tough Neighborhood, Rough Players 7-7-24)
See also:
Payroll July 2024: Ready, Set, Don’t Panic 8-2-24
Employment Cost Index: June 2024 8-1-24
JOLTS June 2024: Countdown to FOMC, Ticking Clock to Mass Deportation 7-30-24
Footnotes & Flashbacks: Credit Markets 7-29-24
Footnotes & Flashbacks: State of Yields 7-28-24
Footnotes & Flashbacks: Asset Returns 7-28-22
Presidential GDP Dance Off: Clinton vs. Trump 7-27-24
Presidential GDP Dance Off: Reagan vs. Trump 7-27-24
PCE June 2024: Inflation, Income, and Outlays 7-26-24
2Q24 GDP: Into the Investment Weeds 7-25-24
GDP 2Q24: Banking a Strong Quarter for Election Season 7-25-24
Footnotes & Flashbacks: Credit Markets 7-22-24
Footnotes & Flashbacks: Credit Markets 7-15-24
Footnotes & Flashbacks: Credit Markets 7-8-24
The B vs. CCC Battle: Tough Neighborhood, Rough Players 7-7-24