
Existing Home Sales Nov 2024: Mortgage Vice Tightens Again
Nov Existing Home Sales got more sellers and buyers off the sidelines ahead of an uncertain 2025.


High price sellers looking for some stooges.
Existing home sales posted higher volumes for Nov 2024 with an increase of +6.1% YoY and +4.8% sequentially while single family home sales volumes rose +7.4% YoY and +5.0% sequentially.
We continue to see higher % volume deltas in the higher price tiers as the lower price buyers keep getting squeezed by higher mortgage prices with that vice only getting tighter now with the recent UST curve and mortgage rate action.
Prices keep rising with the 17th consecutive month of YoY price increases in existing homes sales to $406.1K for existing homes and $410.9K for single family.
Higher prices and higher mortgage rates are not a great formula to break the logjam of supply with homebuilders and new homes holding the competitive edge but existing homes share always the dominant variable in easing the total inventory supply crunch

The above chart is a variation of the price tier volume mix that we address in the final chart. The above chart details the recent history of volume trends by price tier. The chart shows that 4 of the 6 tiers posting positive YoY % changes were in the higher price brackets. The % volume changes then move lower in descending order of price tier for the 4 in positive range and 2 in negative territory as seen on the right side of the chart.
The affordability pressures just got a little worse again in Nov and into Dec with the latest move higher in the 10Y UST and 30Y mortgages riding higher along with it (see Fed Day: Now That’s a Knife 12-18-24). On the one hand, the rise in the 10Y UST by over +90 bps since the Sept lows appears to be heading towards +100 bps higher. That 10Y UST move has driven the 30Y mortgage for many banks now north of 7%.
The Thursday noon release for the weekly Freddie Mac 30Y mortgage benchmark rose by +12 bps this week to 6.72% vs. around 6.60% last week and 6.67% a year ago. Given the events of yesterday and today, this level should be viewed as lagging in repricing with Mortgage News Daily citing a 7.13% average at last night’s close. Mortgage quotes can vary on a range of factors (customer quality, LTV, fees, etc.).

The above chart shows the geographic mix of volumes and details on price mix by region. The South is the main event in single family volumes whether new or used at almost 44% of volumes for existing.
For the bar chart, we break out the mix for each region by price tier. For example, the South shows 52% of its existing home sales volume in the $250k to $500K and 15.9% of its sales in the $500K to $750K bucket. The bars for each region add up to 100% (occasionally a rounding miss!). The high cost of homes in the West (notably California) is clear enough in the West price mix just by glancing at the bar cart % details for prices over $1 million.
We see a big concentration in the $250K to $500K bracket for all regions at 44% of the total and a heavy weighting in the $100K to $250K bracket for the Midwest at 33.7%. The map explains what states are in each Census region, and there is a wide range of home price profiles in the West and Midwest.

The existing home inventory trend is bouncing off the lows and kept on rising to 1.37 million in Oct before dipping to 1.33 million in Nov. We see the lows at 850K just before the tightening cycle kicked into gear in March 2022. Single family home inventory is up by +16.0% YoY but down by -2.5% sequentially.

The above two-sided chart updates the trend line in total existing home sales vs. new single family homes. We look at this trend each month in the New Home Sales release when the two are on the same month (the above chart is Oct for new and Nov for existing). New home sales for Nov will be released on Dec 24.
The main point is that builders have an advantage in being able to use their mortgage finance operations as incentives (mortgage buydowns and fee relief, etc.) to close more sales. The builders have thus picked up market share of total home sales in the tightening cycle. Existing home sales volumes always dominate the total, but builders have been able to prosper regardless despite the recent stock selloffs.
At the margin, builders have been winning since they can design, price, and deliver the homes at a healthy profit margin and on terms the buyer can handle. Even the builders are running into bigger challenges again given the return to 7% area mortgages. Many buyers would rather wait for lower rates and lower prices, but there are plenty of signs that sellers and buyers are giving up and transacting in existing home sales.
The existing home seller does not have the luxury of such builder incentives, and now the potential seller and buyer face the question of “To capitulate or not to capitulate?” For the sellers, the capitulation could lower selling prices and the seller giving up on the hope of lower mortgage rates for a planned move up trade. For the buyer, the reality is that mortgage rates could very well be “higher for longer” and make the decision to “bite the bullet” necessary. The recent rate moves make it easier to rationalize. The buyer can hope for refi opportunities later.
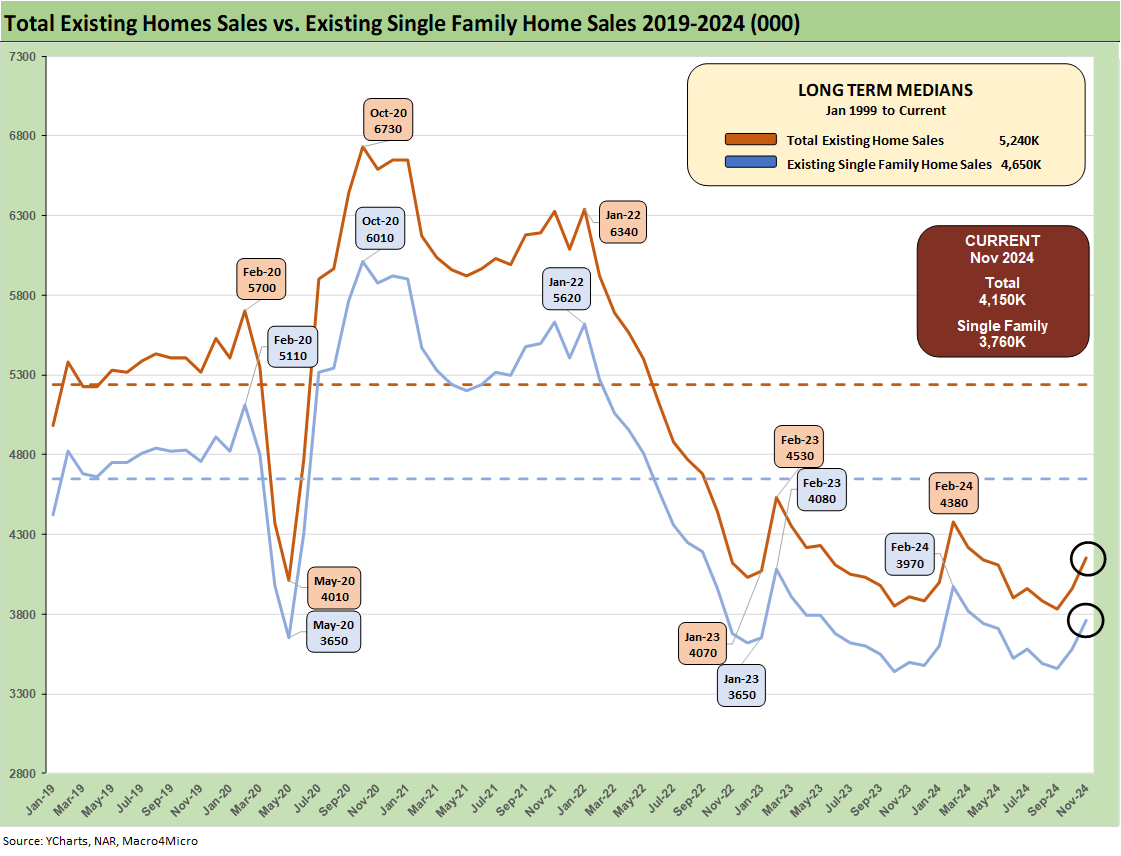
The above chart breaks out the timeline for single family alone of 3.76 million vs. total existing home sales of 4.15 million, which is well below the long-term median (from Jan 1999) of 5.24 million for total existing homes. The lower line is ex-condo/ex-co-ops. We saw 390K in condos and co-ops in Nov 2024, up from 380K in Oct.

The above chart updates the median price for existing single family homes at $410.9K. Though down from the June 2024 high of $432.9K, the median price remains well above the $308K back in Jan 2021 when mortgage rates were near record lows.
Higher mortgage rates and near record prices were the double whammy, but mortgage rates heavily drive the monthly payment burden. Potential sellers and buyers had some recent mortgage relief in the low 6% range in late Sept and early Oct but now those rates are approaching 7% in many areas. We saw 6.72% posted by Freddie Mac’s benchmark on Thursday.

The above chart updates the monthly existing home sales across the timeline from Jan 2021 through Nov 2024. The market is a long way from the mid-6 and high 5 million handles of 2021 and then into early 2022 when many homeowners refinanced, and new buyers locked in low mortgages. ZIRP ended in March 2022 and then the UST migration began. The Nov 2024 total of 4.15 million is back above the May 2020 COVID trough of 4.07. We had a few more sub-4 million handles along the way as noted in the chart, so this has been a brutal period for brokers.

The above chart revisits the topical area addressed earlier on the existing home sales deltas by price tier. The largest tier is the $250K to $500K at just over 44% of sales volumes, and that was up by +8.6%. The challenge for the lower tier buyer is evident in the decline of -3.2% in the $100K to $250K tier that comprises almost 19% of volume while the $500K to $750K tier is 18.2% of the market and rose by +15.6%.
Housing:
Housing Starts Nov 2024: YoY Fade in Single Family, Solid Sequentially 12-18-24
New Home Sales Oct 2024: Weather Fates, Whither Rates 11-26-24
Existing Home Sales Oct 2024: Limited Broker Relief 11-21-24
Housing Starts Oct 2024: Economics Rule 11-19-24
Harris Housing Plan: The South’s Gonna Do It Again!? 8-28-24
Homebuilders:
Toll Brothers: Rich Get Richer 12-12-24
PulteGroup 3Q24: Pushing through Rate Challenges 10-23-24
KB Home: Steady Growth, Slower Motion 9-26-24
Lennar: Bulletproof Credit Despite Margin Squeeze 9-23-24
Credit Crib Note: PulteGroup (PHM) 8-11-24
Credit Crib Note: D.R. Horton (DHI) 8-8-24
Homebuilders: Updating Equity Performance and Size Rankings 7-11-24
Credit Crib Note: KB Home 7-9-24
Lennar: Key Metrics Still Tell a Positive Macro Story 6-20-24
Credit Crib Note: NVR, Inc. 5-28-24