Fed Day: Now That’s a Knife
Any time you hear a phrase in the equity markets that says “since 1974” it is worth paying attention.
It’s not the cut. It’s the knife…
The market was not surprised by the cut but the lower guidance on median fed funds for 2025 of +3.9%, up from +3.4% in the Sept forecast, frayed some nerves even though there were plenty with expectations for guarded easing commentary ahead of the call.
Beyond the forecast for less accommodation from the Fed, the forecasted decline in the 2025 GDP to 2.1% vs. an estimated 2.5% in 2024 raised some eyebrows. For those keeping score at home, Trump 1.0 posted +2.5% annual GDP in 2017 and 2019 with 3.0% in 2018 and -2.2% in 2020, so the 2% handle GDP range is familiar territory (not the “3% economy” often marketed by his advisors who tend to “misremember”).
While the Fed is not renowned for their forecasting ability, they do have their own views on what they can control (fed funds). The projections included a median forecast for 2025 +2.5% PCE inflation which is up from the Sept forecast of +2.1%. The forecast for Core PCE is also +2.5%, up from +2.2% in the September forecast. We get fresh PCE data on Friday.
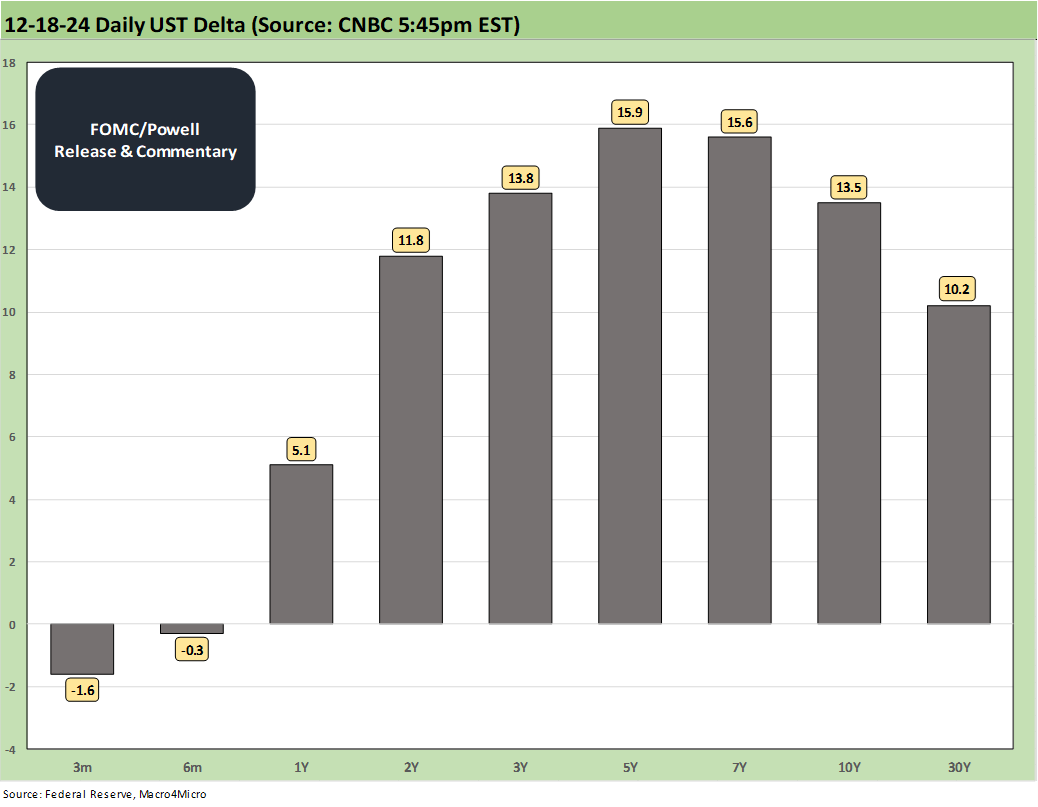
The above chart updates daily UST deltas (in bps) after a tumultuous day. They were still bouncing around after the markets closed, and we grabbed the UST deltas off the CNBC screen around 5:45pm. With the 10Y UST having edged above 4.5% as we go to print, the bond ETFs are heading for a rough week. That is a long way from the +3.6% 10Y UST lows in Sept.
The stock price action was hot and heavy after the close with more selloffs in the interest rate sensitive names and sectors. With headlines talking about 30Y mortgages being back above 7%, numerous housing-related equities were getting pummeled. Lennar also reported earnings after the close and is taking a fresh beating. We will cover the Lennar numbers separately.
On Thursday at noon, we get the Freddie Mac 30Y benchmark, and that one tends to be lower than some of the daily benchmarks we see in various trade publications such as Mortgage News Daily, which cited a +20 bps move from the morning and a mortgage rate index level of +7.13% shortly after 4 pm.
The above chart locks in on the benchmark daily return action with the 4 major headline benchmarks (S&P 500, NASDAQ, Dow, Russell 2000) down as noted in the chart with the Small Caps feeling the nerves the most. We also include the Tech bellwethers above with the Mag 7 plus Broadcom and Taiwan Semi along with the Equal Weight NASDAQ 100 ETF (QQEW) and Equal Weight S&P 500 ETF (RSP). We highlight the benchmark indexes in blue.
The headline du jour was the 10-day losing streak on the Dow for the first time since 1974. The year 1974 was a stagflation recession year that started with the Arab Oil Embargo underway (suspended by most in 1H74) and with a lot of political turmoil (Nixon/Watergate), so the history books are likely to get cracked on the compare-and-contrast (see Inflation: Events ‘R’ Us Timeline 10-6-22, Misery Index: The Tracks of My Fears 10-6-22).
We see wide price delta differentials from top to bottom in the mix with NVDA getting off easy on the day and Broadcom and Tesla getting smacked. These are the same collection of bellwethers we look at in our weekly asset return Footnotes publication across more time horizons (see Footnotes & Flashbacks: Asset Returns 12-15-24). The Tech bellwethers have been doing very well of late in a market where a serious lack of breadth has been catching some headlines in recent days. The Mag 7 et al. had plenty of room to give some price back from recent days. The final 3Q24 GDP numbers are tomorrow and PCE on Friday so the inputs will keep on coming this week.
See also:
Footnotes & Flashbacks: Credit Markets 12-16-24
Footnotes & Flashbacks: State of Yields 12-15-24
Footnotes & Flashbacks: Asset Returns 12-15-24
Mini Market Lookback: Macro Grab Bag 12-14-24


