
Credit Crib Note: Iron Mountain (IRM)
We review the credit quality, operating fundamentals, and financial profile of Iron Mountain, which is a Top 20 HY issuer and Top 10 BB tier name.


CREDIT TREND: Positive
We had previously ranked Iron Mountain credit quality as “stable” based on the direction of credit metrics, but that tag of “stable” had always come with the asterisk that the credit ratings were too low for the risks that IRM presents. The company has been mired in low/mid BB tier composite credit ratings for years despite the clear improvement in overall business risk, impressively high and stable profit margins, and predictable cash flows.
The steady cash flows had value for dividend-focused income stock investors during the ZIRP years, but the trends in the Data Center business and other growth platforms are now adding a feature to the business profile that is leading to multiple expansion in equity valuation as higher revenue and EBITDA growth give IRM stock a lift relative to the earlier days of high margins with low volume growth.
The stability factor was especially notable when IRM remained resilient despite COVID, an inflation spike, and a tightening cycle. The equity market buzz is now broadening the investor base and showing up in Enterprise Value multiples materially above leverage with Debt/EBITDA at the lowest level since the REIT conversion.
Investors now discuss IRM in the context of hyperscaler needs rather than just boxes of documents for law firms and health care providers. We never saw the legacy business as anything but good for credit risk since 70% handle gross margins deliver a lot of free cash flow that can be deployed to drive more top line and EBITDA growth. The growth story also reduces “dividend dependence” to make shareholders happy with the growth multiple kicker. As we show in the stock performance charts herein, shareholders are in fact very happy.

The above chart updates some running stock performance of IRM vs. some bellwether services names in HY (e.g. URI, ADT, ARMK), industry ETFs and market benchmarks, well-known Data Center REITs (DLR, EQIX), major storage REITs (PSA, EXR), and a large cap logistics REIT (PLD). Given the relative performance across time horizons, it is safe to say, “something good is going on at IRM.”
With IRM now in a Fed easing cycle and seeing some secular tailwinds in the Data Center operations, the consistent 40% handle segment margins and 5.0x leverage tells a very favorable story for a company with a 20x area EV multiple. That is a lot of asset value protection.
At some point, the credit rating agencies are supposed to take a step back and say, “The leverage has a lot in common with many IG REITs, and the IRM asset profile and revenue and EBITDA growth will now be more sustainable at these high levels than the old days.” They could also say, “IRM is riding a secular wave into some attractive business lines where it has been successfully executing.” They should say that and upgrade the company. At this point, they just don’t.
Our past view on IRM was that the company presented lower overall business risk and would remain in a tight quality range. That has changed for the better. At this point, the declines in leverage, rising market valuation of the business lines, and discretionary cash flow dynamics will allow IRM to continue to grow both sides of its balance sheet on the asset side and debt side and expand into higher margin growth opportunities in data centers, leverage digital solutions for more high margin customer cross-sell opportunities, and keep building out its Asset Lifecycle Management (ALM) business.
No credit analyst wants to set their sundial by what the equity market says (think 1997 to 1999), but the stunningly strong performance of IRM stock does reflect a high level of optimism in the sustained revenue and cash flow growth of IRM as it expands in key growth subsectors we detail below.
At the very least, it is worth asking what is so different at the company now. We would argue the reason is that the redeployment from the cash cow business into new growth business lines is working. High capex will require more borrowing, but that will drive higher revenues, EBITDA and asset value. That is what IRM should be doing. They got here by that path, and leverage declined and business risk diversity improved.
Margins, cash flow, asset protection, and growth prospects all tell a good story in both credit quality and in the equity markets where IRM has crushed a range of benchmarks and useful comps such as the S&P 500, the NASDAQ, Digital Realty (DLR), and the Tech ETF (XLK) over 1Y, 3Y, and 5Y time horizons.
We would argue that the quality of the asset base and the reliably high margins in the cash cow storage business lines combined with the valuation of IRM (EV multiples) make the leverage targets quite appropriate for IG ratings in the context of the REIT sector. Otherwise, they can afford higher leverage and aggressive growth at the current credit ratings. The company can easily operate as a BB tier credit and sustain its multicycle growth trajectory through organic capex expansion as well as targeted acquisition activity we have seen across time.
Iron Mountain has always been a major issuer in the debt markets and a key name in the equity markets near the middle rankings of the S&P 500 based on market cap ($32.7 bn at 12-17-24). The IRM stock return of 354% for 5 years (437% over 10 years) underscores the success that followed its multiyear process of engaging in a REIT conversion and aggressively seeking out growth opportunities in data centers among other initiatives.

We add another stock chart for IRM looking back 5 years vs. Digital Realty and the Real Estate ETF (XLRE). The rule of thumb is that income stocks are hurt in a rising interest rate environment unless they have a growth metric to add some tailwinds. IRM’s performance vs. real estate and many REITs is telling a good story on the growth side as that has flowed in dramatic fashion into the multiple since the pre-COVID period. All that free cash flow from the legacy business is something you seldom see, but the growth platforms have been the catalysts.
OPERATING PROFILE
The slow and steady transition has seen IRM morph from being a “record and information storage business” into a “storage, digital solutions, tech services, and data center hybrid.” IRM’s role as a “peer group of one” had historically left IRM as somewhat of an orphan in data center equity coverage by the street, but the company has grabbed a lot of attention in recent years with its stellar stock performance. That is also true of its ability to tap unsecured bond markets in size at will. Along the way, IRM has been able to lock in low coupons in its acquisitions.
The growth strategy and cash flow deployment game plan for IRM is something we had looked at in prior commentaries (see Iron Mountain: Top 10 BB Tier Bond Issuer, Underrated, Equity Flying High 2-27-24, Iron Mountain: Good Climb, Summit Unknown 11-20-23, Iron Mountain: Credit Profile 4-15-23). The growth plan was in time supposed to shift the view of IRM shareholder value to include more of a growth multiple instead of IRM being primarily a dividend stock that was very popular in the ZIRP years. That has happened.
In the interest of disclosure, I routinely owned IRM stock in the post-COVID period, and it performed quite well (I am not currently a holder). In more recent periods, IRM has ridden the data center buzz and gained more sponsorship in the equity markets for those that give it a closer look.
The dividend income component is still strong in the IRM attraction, but as more data center revenues roll in, the EBITDA margins have stayed high in the mid-30% range but with a more favorably diversified mix of revenues and growth plan that gets around the “death of paper” counterpoint that used to get thrown at IRM.
The AI buzz turbocharged the IRM story line for anyone with the right real estate and reasonable power grid planning that could serve the boom. As far as “paper” goes, IRM has always made it clear paper is not dead and evolution away from documents storage is a very slow process. (Anyone who has ever tried to incorporate and/or liquidate an operation in India can vouch for that).
Many still rely on paper and IRM is still generating massive gross margins in its legacy business lines whether documents and records are paper, in digital form, and/or on tapes, etc. Many still rely on IRM for data security but they store all types of documents and data with IRM in all forms. On paper, we remember the stories of the “paperless law firms” that are light paper in their offices but still require massive document storage whether paper or in digital form – or both- or being transferred to digital format.
FINANCIAL TRENDS
IRM has always presented a challenging balance sheet to work through given how its tentacles are global in scale with their big international expansion that accelerated with the Recall acquisition announced back in mid-2015 (closed 2016). They have been busy growing both the asset base and capital structure, but the main event is unsecured bonds including the recent $1.2 bn 6.25% due 2033 (upsized from $750 million on strong demand). That is the sixth bond deal on IRM books over $1 bn with IRM’s range of bond maturities busy from 2027 to 2033.
For purposes of the credit agreement, leverage is set on a “net lease adjusted debt” basis vs. EBITDAR at 5.0x given the real estate intensity of the business and the fact that IRM took on lease obligations in the process of its acquisition activity. REITs seek to own and not lease real estate, but the acquisition activity that brought the lease obligations was part of the expansion program. Leverage ended 3Q24 at 5.0x or the lowest level since before the REIT conversion was effective in FY 2014.
The process of executing on all the requirements to achieve REIT status in 2014 generated some distortion in the equity base and book value leverage metrics (including the “E&P purge” that contributed to the current negative book equity base). We look at some of those metric distortion issues in the financial trends section addressing the balance sheet health of IRM.
The balance sheet is quite strong relative to its very conservative credit ratings from the rating agencies. The credit metrics are more in line with what you see in numerous BBB tier REITs. The credit ratings are decoupled from the financial realities in IRM’s case. The credit ratings are too low relative to the risks. Simply put, the agencies have struggled to apply REIT criteria on a level field with IRM.

IRM results are running strong in 2024 with “record results across all financial metrics of revenue, adjusted EBITDA, and AFFO.” We see double-digit revenue growth of +12.2% for 3Q24 and 12.5% YTD. EBITDA posted 13.6% YoY growth for 3Q24 and also for YTD 3Q24. Toss in 36% EBITDA margins and then you start to get into the weeds of a growth plan that has been impressive in its execution and equity market response.
The Storage Rental revenue line above flows into gross margins with 70% handles (71.0% 3Q24). That in turn combines with the lower gross margins around 34% in Services. Those gross margins then flow into the very healthy 36.5% EBITDA margin generated by the combined Storage and Rental revenues of $1.56 bn for 3Q24.
Just by looking back across the timeline in the above chart at the EBITDA margin line, the word “stable” cannot get much of an argument with EBITDA margins in a tight band from 33.7% in FY 2019 to the 3Q24 level of 36.5%.
The more important feature of the very stable high margins is that they now are accompanied by rising revenue as the Data Center and Asset Lifecycle Management (ALM) businesses continue to grow along with the Digital Solutions platform.
A higher rate of revenue growth was a missing piece in the legacy business mix. The margins were healthy, but the long-term growth story was lacking. That growth feature has now changed, but the legacy business is still a major positive element of the IRM story as the cash cow feeding into the growth capex line (detailed further below).
The REIT analytical framework requires a slightly different thought process where you consider the dividend demands and then “solve for X” on how much borrowing the company will need as it grows its asset base and EBITDA line. The fact that leverage is lower after all the capex and dividend demands should be a clue that something is working right.

The segment breakdown is clear enough above for the “Records and Information” (RIM) business and Data Center. Unlike what you see with many major companies in segment disclosure, the segment dubbed “Corporate and Other” includes the important growth platform of Asset Life Cycle Management (ALM). They break out the revenue lines each quarter for the segment.
The ALM business as of 3Q24 was running at over a $400 million annual run rate. This operation includes target-rich cross-selling opportunities with the ALM operations already showing sharply higher YoY organic growth in 3Q24 vs. 3Q23.
The segment table above underscores how the bulk of revenues and EBITDA is generated in the legacy RIM business with its mid-to-high single-digit growth range, but the higher growth rate from the digital solutions subset of the RIM segment, Data Centers, and ALM are the key drivers of the revenue and earnings metrics accolades.
RIM’s mature business lines have the core strength of solid revenue management (ability to raise prices), so that offers some positive organic growth in business lines that lack the volume upside evident in the growth platforms.
Digital solutions (within RIM), Data Centers, and ALM comprise around 25% of revenues as growth platforms, so the IRM revenue and EBITDA story is moving in the right direction for both stockholders and credit quality. The theme of revenues becoming “recurring” is a common topic and backed up by margin stability.
Digital solutions have been growing at a CAGR of around 25% for years and offer a reminder that there are growth stories within RIM and not just in the Data Center segment and ALM operations.
Digital Solutions is running around $500 mn annual rate and expected to be a $1 billion revenue business. IRM cites examples on its earnings calls and in its roadshow presentations. Examples of client verticals evolving their digital record data capabilities include subsectors such as health care and financial services among the more obvious candidates.
Data Center revenues are running at an annualized clip over $600 million or almost +20% in revenue growth for 3Q24 at 43% handle segment EBITDA margins. YTD 3Q24 Data Center revenue growth was +26% and also at +43% adjusted EBITDA margins.
ALM runs across a wide range of services such as secured destruction of data and “e-waste” and IT assets. The language of what rolls up under “decommissioning” makes intuitive sense as IRM runs through their examples.
For ALM revenue, the revenue that comes from destruction and disposal of digital and physical assets offers growth upside. The service opportunities are almost self-evident as companies mature, adapt to new technologies, change strategies, replace equipment, merge, discontinue operations, go bankrupt, liquidate, etc. The cross-sell opportunities across a massive customer base offer material growth upside and sustainability.

When looking at the balance sheet and leverage at 5.0x, it is worth keeping in mind that the EV/LTM Adjusted EBITDA multiple was over 22x at the end of 3Q24, which is in line with data centers and some REIT storage leaders.
EV multiples for IRM are now very high for a reason, and it is one more data point to not treat IRM like a generic “business services” HY company. IRM is definitely not a “generic business services” operation. Even if a stock watcher is of the view that the stock is rich and has come “too far, too fast,” the credit comfort is in the revenue and EBITDA growth and the discretionary nature of the major growth capex programs.
As noted in the chart, Total Assets have grown by almost $4.7 billion since 2019 and PP&E by $2.6 bn. On the liability side, total debt is up by $4.7 billion also.
The credit agreement uses an EBITDAR-based test using net lease adjusted debt/adjusted EBITDAR ratio as detailed in the chart. IRM is comfortably in compliance with any covenants and leverage at post-REIT status lows.
The negative book equity base is a function of the E&P purge in the REIT conversion process, the high cash dividend payouts that are a function of earnings power. The ($102 million) book equity contrasts with the record EBITDA and over $32 billion in market value of equity.
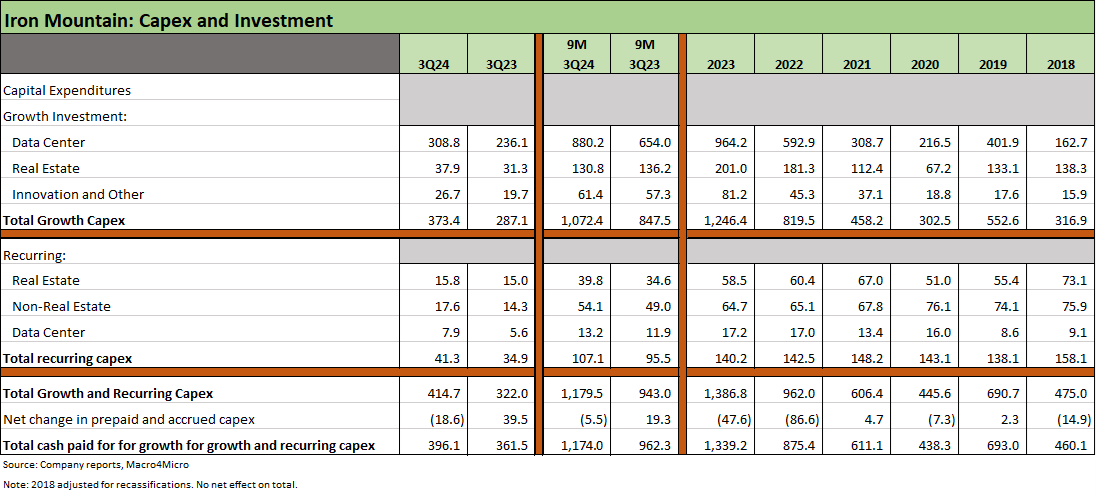
High capex is a cornerstone of IRM’s strategy to shift its mix for long-term revenue and earnings growth that will also support the higher multiples that IRM is now winning in the equity markets.
Growth capex as framed above climbed by just under 4-fold from 2019 to 2023 and YTD is up by another 27% YoY. The Data Center segment was 77% of the growth capex line in 2023 and 82% of the 3Q24 YTD growth capex total, so there is not a lot of mystery in the capital allocation priorities. An important factor mitigating capex risk is that all data center construction plans are pre-leased.
We see “recurring capex” as only 10% of the total capex line while Real Estate is around 16% of the growth capex.
IRM cites the expanding nature of hyperscale customer relationships as they grow and take actions to renew equipment. The head start that IRM had in land and power has brought rewards for IRM given the rapid growth of the cloud businesses and AI needs. These are long lead-time projects and IRM is well positioned to capture more revenues in the increased activity in the space and cross-selling opportunities.
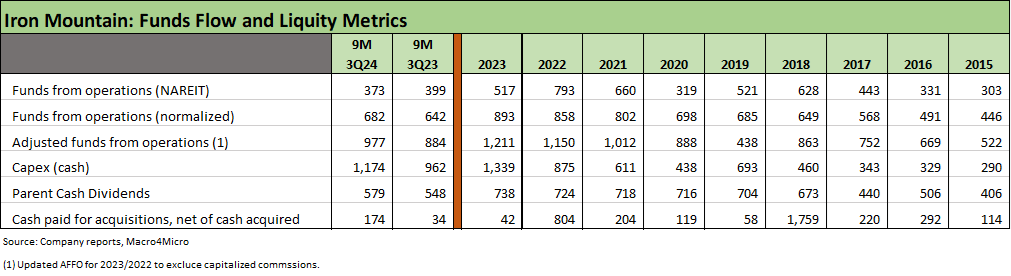
The above table offers a different angle using some of the NAREIT funds flow metrics and the lines for capex from the cash flow statement and parent cash dividends. Like most REITs, IRM offers many pages of rigorous, high-value data each quarter and notably around cash flow deployment and the capex mix.
The credit and equity story at IRM gets swept up in deployment of free cash flow from the legacy business lines into the dividend demands with the shortfall of the total discretionary cash flow in turn relating to more debt running alongside higher revenue and EBITDA. The EBITDA growth has helped keep leverage metrics in check and even seen it move to multiyear lows.
As a REIT, dividends play a very big role, and the conversion has served shareholders well while also associating IRM with some high EV multiple sectors in storage and data centers.
HISTORY AND HIGHLIGHTS
IRM is a global leader in Record and Information Management (“RIM”) with services including paper and digital document storage and major growth initiatives underway in Data Centers, Asset Lifecycle Management (“ALM”), and digital solutions for data and documents. IRM has a smaller operation in art and fine arts storage and handling.
The Data Center segment comprises a smaller share of total revenue at 10% of 3Q24 revenues, but the data segment dominates the majority of growth capex (82% of growth capex YTD 3Q24) as IRM has grown into a Top 10 global data center operation based on incremental new sales.
IRM has a good marketing “commercial” that they use to describe their customer breadth, durability and diversification with 248K client relationships, 95% of the Fortune 1000, long-tenured clients, and no single client over 1% of revenues. The diversification arguably extends to departments and regions within major companies with the potential for multiple contracts with different business lines and profit and cost centers. IRM cites total addressable markets (TAM) of $150 billion.
Cross-selling opportunities get better each year with more service offerings and more points of contact as IT budgets expand and data needs grow in an expanding US and global economy. The increased use of tech and data as a substitute for labor gets less marketing time given the dark thematic elements (lower labor use), but IRM also has a role to play with companies on that front.
IRM started the multiyear process of converting to a REIT in 2012 and started operating as a REIT effective Jan 1, 2014. The tax efficient flow-through of higher dividends was applauded by shareholders and reflected in the stock performance at the time.
The process of IRS approvals was protracted and required some material financial actions such as an “earnings and profits purge” required under REIT conversion rules. That in turn led to major distortions in the book stockholder equity base with distributions to shareholders in cash and stock dividends (heavily in 2013).
While capex (detailed earlier) is the main driver of growth and business line expansion, IRM made a few transformational acquisitions including the $2.2 bn Recall acquisition ($1.8 bn equity financed) in 2016 that expanded its global footprint. IRM executed on a smaller but important data center deal with the IODC acquisition in Dec 2017 for $1.35 bn (closed Jan 2018).
IRM also entered the Asset Lifecycle Management space with the $718 million deal (net of cash) for 80% of ITRenew in Jan 2022. IRM also acquired Regency Technologies in Jan 2024 for an initial purchase price of $200 million before final working capital adjustments and contingent consideration tied to performance goals. Regency brings IT asset disposition services capabilities. IRM highlighted the high addressable market in ALM north of $20 billion and IRM’s role as an early leader in a space that is still in its growth stages and brings natural cross-selling opportunities.
The multicurrency borrowings in the debt footnotes are a function of the asset-liability and revenue-expense matching given how far and wide the asset-intensive operations are for such a business. IRM has operations in 60 countries, but the primary non-US exposures are the UK, Canada and Australia.
IRM breaks out its real estate locations in its 10K, and there is no shortage of addresses around the world. The percentage mix of revenue is still heavily US-centric at 64% of 2023 revenues with the UK next at just over 7%. Canada is at over 5%, and Australia at just under 3%. In other words, Emerging Market exposure by nation is minor.
Among the major transformational programs initiated in recent years, Project Matterhorn was announced in Sept 2022 and started a multiyear restructuring and integration plan to accelerate global growth, rationalize costs, and cross-sell more products and services into a massive client base. Capex and acquisition activity is directed toward opportunities in growth sectors such as data centers and ALM’s value proposition of managing the data and storage needs over a life cycle.