
Footnotes & Flashbacks: Asset Returns 12-22-24
We update running asset returns across time horizons after a very rough week for equities and debt.


Is the near-term mix of risks more about skill, finesse or just luck?
A volatile week posts a rare 0-32 shutout with all negative asset returns in the 32 benchmarks and ETFs we track as the market shows trigger-happy anxiety around high equity valuations following some less supportive color on FOMC 2025 fed funds guidance and fears of an even bigger supply of UST than expected.
The bear steepener beyond 2Y UST again hit bond ETFs and slammed interest rate sensitive equities with homebuilders on the bottom and slipping down the YTD rankings with Regional Banks also taking a beating after a very strong 3-month run in the top quartile.
For the 1-month time horizon, the bottom of the top quartile was negative with the HY bond ETF (HYG) edging into the top tier while the bottom of the rankings was in negative double digits with E&P (XOP) and Energy (XLE) and Homebuilders (XHB) just ahead of those two.
Tech is back in the lead for 1-month with the Top 3 rankings and most of the top quartile under the influence of Mag 7 and tech.

The above table updates the main high-level equity and debt benchmarks we watch each week. We line them up in descending order of total returns for the YTD period. We see the debt benchmarks for the 1-month period with all 4 negative and for 3 months we see 3 of 4 negative (one barely positive in HY) as the bond math and duration pain is unforgiving.
In equities, the small cap rotation game plan got derailed (for now) as breadth left the market and tech took over again. The S&P 500 large cap broad market benchmark barely held positive while the more tech-centric NASDAQ held up with a respectable 1-month run over 3%.

The 1500 and 3000 series suffered for the 1-month time horizon with only Growth posting a +3.5% return and the rest of the benchmarks in the negative zone.
Energy has been pummeled and is in the red for 1-month, 3-months, and 6-months and below cash returns YTD. Real estate is back in the negative range for the 1-month and 3-month horizon but still posted a solid running 6 months and anemic YTD.
For the YTD period, Growth and Financials have been especially impressive. Industrials have been solid performers with Value at least ahead of the long-term return on equities with a respectable 14% handle.
The rolling return visual
In the next section, we get into the details of the 32 ETFs and benchmarks for a mix of the trailing periods. Below we offer a condensed 4-chart view for an easy visual on how the mix of positive vs. negative returns shape up. This is a useful exercise we do each week looking for signals across industry groups and asset classes. We also have a YTD version that we include in the broader commentary on the time horizons further below.

The shift in the mix of positive vs. negative lacks much mystery this week at 0-32 and the 1-month timeline showing a scorecard of 7-25 with a slight negative return for HY ETF (HYG) still making the bottom of the top quartile for the month. The only bond ETF in positive range for 1-month was the short duration UST 1Y-3Y ETF (SHY) at +0.35%. When the smoke clears on 2024, the year will be a very good one LTM but with duration-driven bonds and energy among the weakest.
The Magnificent 7 heavy ETFs…
Some of the benchmarks and industry ETFs we include have issuer concentration elements that leave them wagged by a few names. When looking across some of the bellwether industry and subsector ETFs in the rankings, it is good to keep in mind which narrow ETFs (vs. broad market benchmarks) get wagged more by the “Magnificent 7” including Consumer Discretionary (XLY) with Amazon and Tesla, Tech (XLK) with Microsoft, Apple, and NVIDIA, and Communications Services (XLC) with Alphabet and Meta.

We already addressed the tech outcome in our earlier Mini Lookback as the Mag 7 has turned in a mixed rebound toward year end for some names (not all). That has come after seeing a relative fade during stretches in the fall as investors debated rotation strategies and the shift into value, cyclicals, and small caps among others.
You can scroll across the Mag 7 lines above for the YTD time horizon and see MSFT as the main Mag 7 laggard at “only” +17% with Apple next to last with 32.8%. NVDA is obviously in a class by itself at +172%. Below the go-go names, we see the Equal Weight NASDAQ 100 struggling vs. the Equal Weight NASDAQ 100 ETF (QQEW) in YTD returns, so blind buying of tech has not been the ticket either.
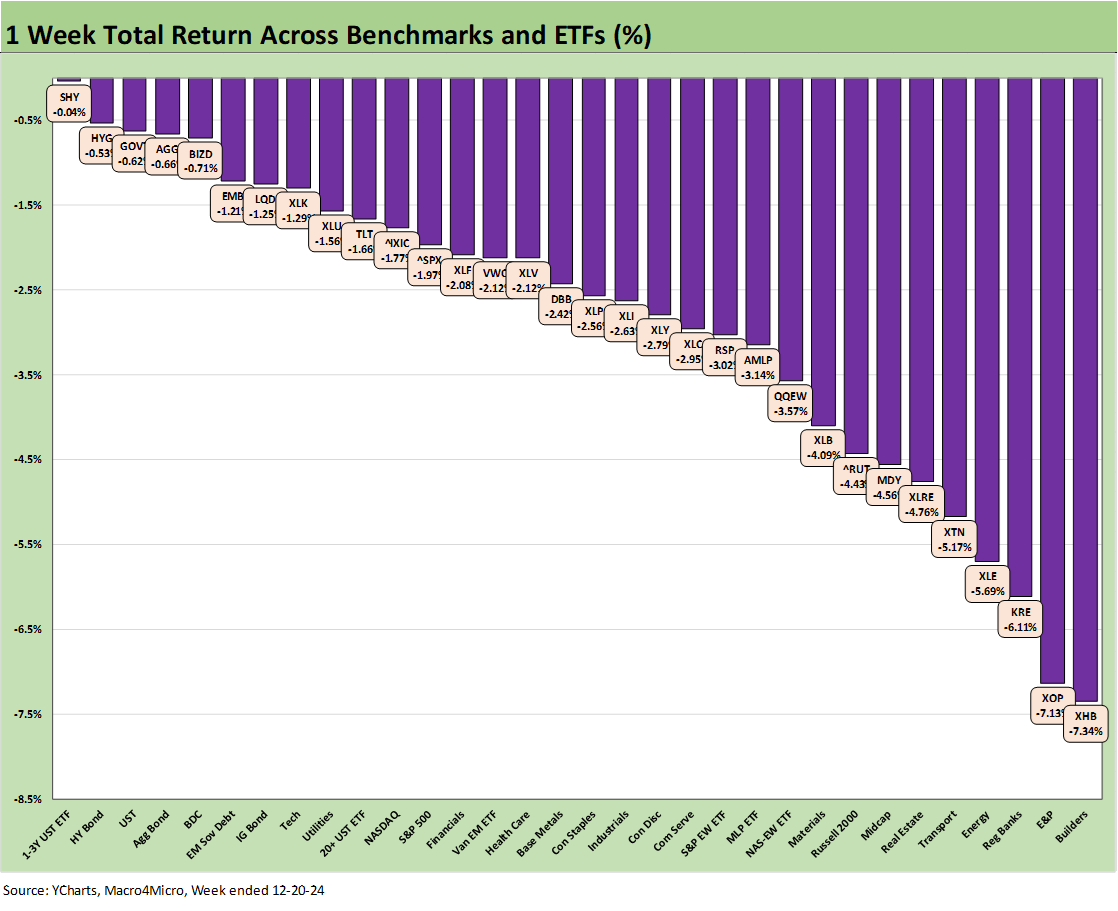
We had already checked on the 1-week numbers in our earlier Mini Lookback, and the week was indeed a bleak one with everything in the red. The 0-32 score makes a statement as does 6 of 8 top ETFs in the top quartile being bond ETFs with negative returns. The 7th bond ETF in the group, the UST 20+Y ETF (TLT) at -1.66%, was just under the top quartile.
The Homebuilder ETF (XHB) ranked on the bottom for the week. XHB already had started to get seriously second-guessed after the Homebuilder ETF (XHB) hit an LTM in the early fall of +73%. With mortgage rates bouncing off the lows in late Sept and early Oct, the trouble got worse for valuations. This week’s -7.34% return came as 30Y mortgages made another move higher. We also saw industry giant Lennar report weak numbers and poor guidance.
The major builders have very low credit risk profiles and prudently manage their working capital for maximum financial flexibility and a healthy balance of sales vs. starts. In the case of Lennar, they have cash in excess of debt, so this is a very different homebuilder sector than the bubble years.
We also see Regional Bank ETF (KRE) taking some pain this week at -6.1% after a very bullish run. The recent KRE run of strength was especially impressive when one considers the March 2023 regional panic and how the market was handicapping the potential for commercial real estate pain in the regionals in 2024. The fed funds guidance (fewer cuts) from the Fed this past week rattled the markets and fell harder on KRE than on the broader Financials ETF (XLF). In contrast to KRE, XLF hung around the middle of the second quartile.
Small Caps and Midcaps faded into the bottom quartile this week while Real Estate felt the pressure of higher long-term rates and how that tends to punish income stocks and real estate broadly as an asset class. Upstream E&P (XOP) and the broader Energy ETF (XLE) stayed mired in the mix of underperformers.

As discussed earlier, the 1-month performance was heavily negative with a score of 7-25 with the weight of higher interest rates and stagnant energy equities very much in evidence in the bottom quartile mix.
The Mag 7 rally shows up in the top quartile in the two benchmarks (NASDAQ #2, S&P 500 #6) but also in the Consumer Discretionary ETF (XLY) at #1, the Tech ETF (XLK) at #3, and Communications Services (XLC) at #5. We see high income and very high yields matter in the case of the BDC ETF (#4). We see the “Odd Couple” of the short duration UST 1Y-3Y (SHY) and HY ETF (HYG) in the bottom two slots of the top quartile with HY in negative range.
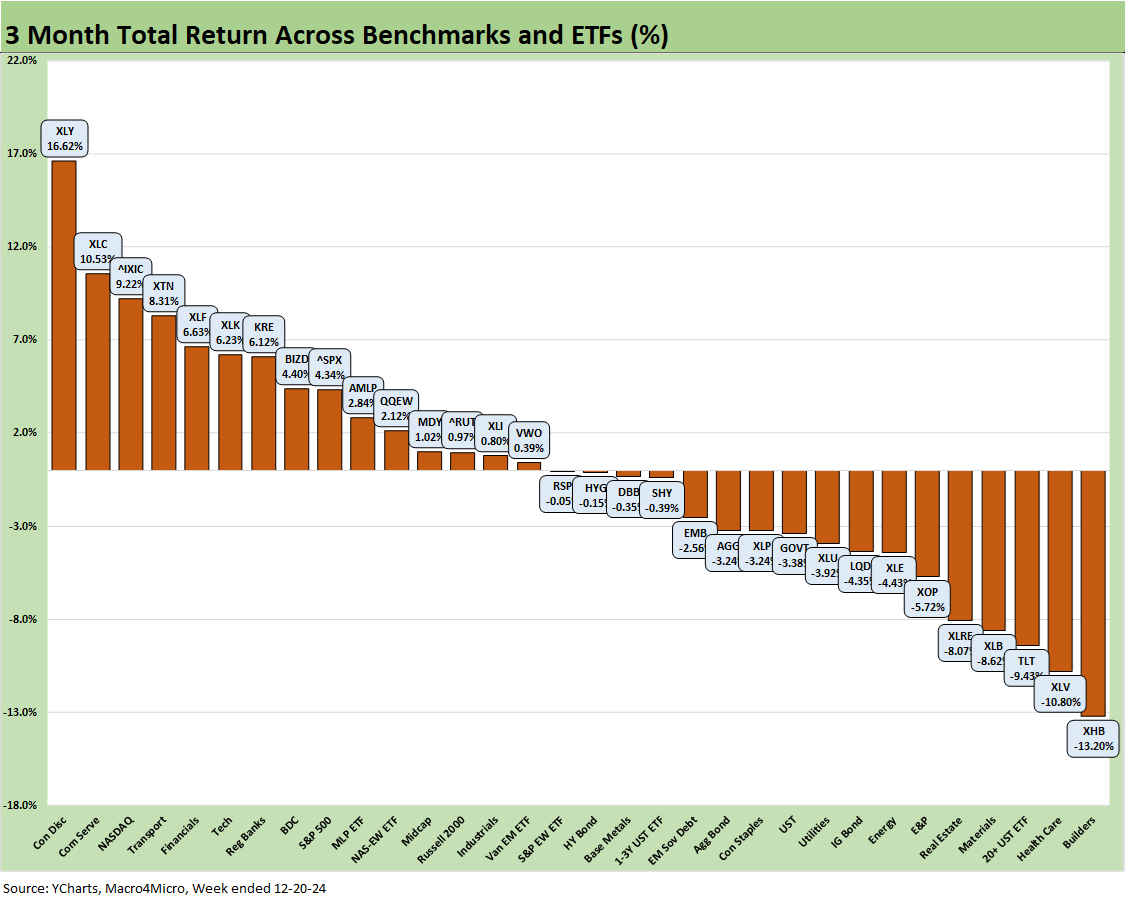
The 3-month time horizon weighs in at 15-17 with a slight negative bias in the mix. We see all 7 bond ETFs in the red after Sept marked the low point for the 10Y UST at 3.6% vs. the current 4.5%. The long duration UST 20+Y ETF (TLT) is third off the bottom.
The Homebuilder ETF (XHB) is sitting in dead last for the 3-month period after starting its descent with mortgage rates rising since late Sept. At the end of Sept (week ended 9-27-24) ahead of the recent mortgage rate climb, XHB ranked #1 YTD at +30.4% in total return just ahead of the Utility ETF (XLU). As we cover in the next chart, XHB fell into the third quartile with a YTD return of +11.2%. To the extent the builders start liquidating inventory and generating free cash flow, they will be buying back stock.
We also see the Pharma-heavy Health Care ETF (XLV) in second to last just ahead of XHB as income stocks take a hit generally. In the case of XLV, we also see the “RFK Jr factor” as his views on many issues are considered quite outside the mainstream and policy proposals might be out of alignment with science and reality (aka batsh*t crazy). He is getting tagged as the “pro-polio ticket” and the anti-VAX label is hard to shake. Health care is one area where regulatory rollback is not an aphrodisiac for buying more stocks in the sector.

The YTD returns may be getting a haircut as the year winds down, but the score of 30-2 is impressive with a median return of over 11% in the list of asset categories above. That median is above the nominal long-term annual return on equities. To make the top quartile, you had to clear 21%, and that is impressive in itself.
We see the long duration UST ETF (TLT) still ranked on the bottom at -7.0% and E&P (XOP) just ahead of it at -6.2%. Half of the bottom quartile is comprised of bond ETFs (TLT, GOVT, LQD, and AGG). The third quartile has short duration UST (SHY), EM Sovereign debt (EMB) and HY (HYG).

With the last stub of Dec 2023 almost wrung out of the LTM period, we see little difference between the YTD and LTM numbers. The Nov-Dec 2023 period was a dazzling rally for duration, credit and equities, however, so we kept the LTM for this edition. The #1 LTM return seen in the Communications Services ETF (XLC) is +37.4%, which is above the YTD at +35.9%.
The median return in the chart above for LTM is around 14% vs. closer to 11% for the YTD period, so there is still some room for a wild finish in the middle ranks. In the top quartile LTM, we see 7 of 8 above 25.0% while YTD we only see 5 of 8. The top quartile for LTM and YTD includes the same members and ordering at this point. For now, it is more a race to the tape.
See also:
Mini Market Lookback: Wild Finish to the Trading Year 12-21-24
Trump Tariffs 2025: Hey EU, Guess What? 12-20-24
PCE, Income & Outlays Nov 2024: No Surprise, Little Relief 12-20-24
Existing Home Sales Nov 2024: Mortgage Vice Tightens Again 12-19-24
GDP 3Q24: Final Number at +3.1% 12-19-24
Fed Day: Now That’s a Knife 12-18-24
Housing Starts Nov 2024: YoY Fade in Single Family, Solid Sequentially 12-18-24
Industrial Production: Nov 2024 Capacity Utilization 12-17-24
Retail Sales Nov24: Gift of No Surprises 12-17-24
Inflation: The Grocery Price Thing vs. Energy 12-16-24
Footnotes & Flashbacks: Credit Markets 12-16-24
Footnotes & Flashbacks: State of Yields 12-15-24
Footnotes & Flashbacks: Asset Returns 12-15-24
Mini Market Lookback: Macro Grab Bag 12-14-24
Toll Brothers: Rich Get Richer 12-12-24
CPI Nov 2024: Steady, Not Helpful 12-11-24
Mini Market Lookback: Decoupling at Bat, Entropy on Deck? 12-7-24
Credit Crib Note: Herc Rentals (HRI) 12-6-24
Payroll Nov 2024: So Much for the Depression 12-6-24
Trade: Oct 2024 Flows, Tariff Countdown 12-5-24
JOLTS Oct 2024: Strong Starting Point for New Team in Job Openings 12-3-24
Mini Market Lookback: Tariff Wishbones, Policy Turduckens 11-30-24
Tariff: Target Updates – Canada 11-26-24
Mexico: Tariffs as the Economic Alamo 11-26-24
Tariffs: The EU Meets the New World…Again…Maybe 10-29-24
Trump, Trade, and Tariffs: Northern Exposure, Canada Risk 10-25-24
Trump at Economic Club of Chicago: Thoughts on Autos 10-17-24