
Mini Market Lookback: Market Delinks from Appointment Chaos… For Now
We look back at another rally week with equities rolling, HY spreads tighter, and the UST curve still cautious.


If Caligula could nominate his horse…well…let’s be reasonable?
The equity market is still locked in on absolute interest rates being low in historical context, the economy being strong from many different angles in terms of payroll, hiring, fixed investment, and GDP growth and now the added tailwinds of less regulation and a likely pickup in M&A volume.
The pushback in 2025 and forward-looking worries are tied to the major uncertainties around tariffs and inflation, mass deportation and related economic side-effects, potential health care setbacks (ACA repeal), and high mortgage rates. For the consumer, the “repriced menu” in store aisles remains a drag for many and the same in key sectors such as automotive and the inflation of insurance premiums.
In handicapping how much of tariff and deportation rhetoric is posturing and negotiation tactics, the first wave of appointees and the process overall has not been reassuring. The profile has been one featuring unqualified, inexperienced, and extremist nominees. The criteria appear to be more about loyalty than competence with the overriding themes still about retribution playing an outsized role in Defense and at the DoJ.
The de facto command to the Senate to skip hearings (i.e., their constitutional duty) and allow for recess appointments only without FBI and traditional security clearance sends a signal that aggressive tariffs are coming and the scale of deportations will create social and economic chaos after a stated promise of “shock and awe.” There will be a price to pay in the economy and along the UST curve.
Ahead of Thanksgiving, this coming week brings a fresh look at Personal Income & Outlays (PCE Inflation), the second estimate for 3Q24 GDP, and a look at New Home Sales in a month that saw a sharp rise in mortgage rates following the lows of late Sept/early Oct.

As noted above, the 1-week returns posted a score of 31 positive and 1 negative in our group of 32 benchmarks and ETFs. The only one in the red (very slight negative) was the short duration 1Y-3Y UST. In a good equity week, we see 7 of the 8 lines in the bottom quartile comprised of bond ETFs. The S&P 500 saw 10 of 11 sectors in positive range with only Telecom slightly negative. The Russell 2000 outperformed the large caps ahead of the S&P 500, NASDAQ and Dow.
Within the broader group of benchmarks/ETFs, the E&P ETF (XOP) rallied on the noise in Russia-Ukraine and some fresh Iran tension around their nuclear program. We also saw the Midstream Energy ETF (AMLP) in the top 5. As we enter the new year, it does not take a conspiracy theory to come up with a scenario where Trump prompts “drill, drill, drill” at home and at the same time “encourages” those E&P economics with a hardened line on Iran with less fear around oil price fallout.
Basically, Trump can say “dam the torpedoes and dam the Strait of Hormuz and drill, drill, drill.” Trump is in favor of beefing up the global LNG business to assert US energy dominance and building out more US energy infrastructure. One worry on inflation is that the upstream players will be measured in the capex program to avoid revisiting oversupply downside and lower oil prices. The balance of domestic energy ambitions can factor into Mideast strategy and how to work with Israel on Iran risk. As Washington balances the risks in geopolitics, the Trump team may worry less about Iran than Biden did. After all, Iran was looking to assassinate him.
On a positive note for equity market breadth this week, we see Small Caps at #2 and Midcaps at #3. The mix in the top quartile is diverse and includes Homebuilders (XHB), the Equal Weight NASDAQ 100 ETF (QQEW), Materials (XLB), and Regional Banks (KRE).

The above chart updates the tech bellwethers, which are comprised of the Mag 7 + Broadcom + Taiwan Semi. We also include the S&P 500, Equal Weight S&P 500 (RSP), NASDAQ, and Equal Weight NASDAQ 100 (QQEW) as comps. We see 3 Mag 7 in the mix of the 4 in negative range, including NVIDIA who posted banner growth numbers this past week but presents one heck of a valuation quandary for holders.
Tesla had another banner week at +9.9% to bring its 1-month rise to just under +62%. TSLA is still negative over the trailing 3 years. For the trailing 1-year period, Tesla posted +50.5% but that only ranks #5 behind NVIDIA, Taiwan Semi, Broadcom, and Meta.
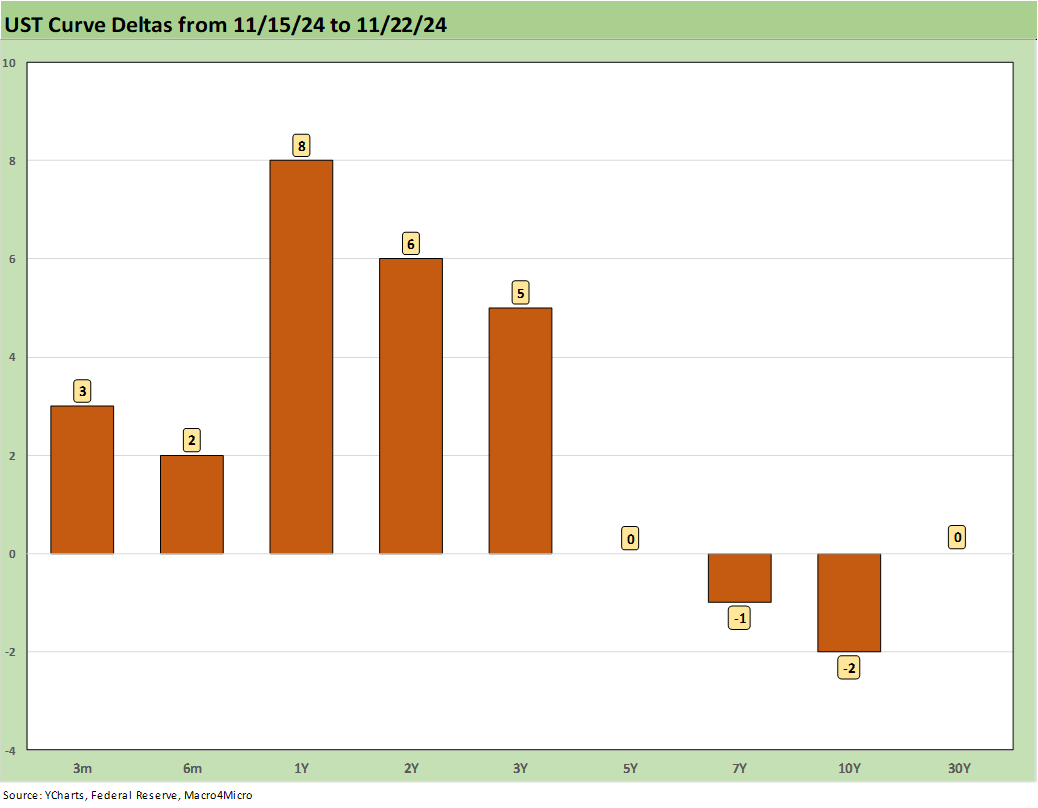
The UST deltas this past week as framed above showed an uneventful week for duration with the short end showing some modest upward movement in the 1Y to 3Y area. There is some debate cropping up in the market commentary around whether the Dec FOMC action should be a pause, but the odds still favor another cut in Dec unless the PCE price inflation this coming week brings material surprises. We will look at the full state of yields in our separate Footnotes publication to be posted later this weekend.
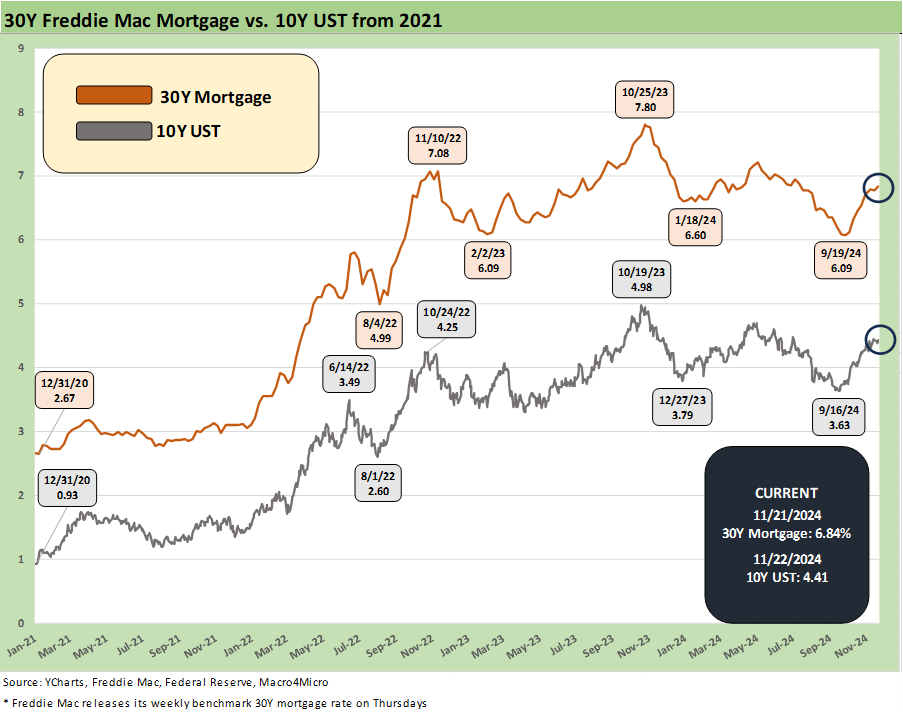
The above chart updates the time series for the 10Y UST and the Freddie Mac 30Y Mortgage benchmark that gets wagged by the 10Y UST. The mid-Sept to early Oct UST rally offered some mortgage relief that helped existing home sales to briefly get off the mat (see Existing Home Sales Oct 2024: Limited Broker Relief 11-21-24). The setback in the 10Y area flows into mortgage rates and will continue to be a material headwind that undermines housing affordability.
The good news for builders has been that the major homebuilders have demonstrated their ability to navigate such a market through mortgage buydowns and fee relief. On the other hand, the mortgage rate pressure has effectively frozen the ability of many homeowners and mortgage holders to sell their house and cash out, move up, or do the “empty nester” relocation. That same rate spike undermines the ability to refinance and take cash out for deployment elsewhere (college, weddings, credit card debt, support of relatives, etc.). The pace of the move from the world of ZIRP and 2% handle and low 3% handle mortgages was very sudden and very sharp.

The above chart shows the moves across the summer into the fall with the current +261 bps showing another tightening of -11 bps over the past week as the HY market has rolled back into the June 2007 zone (see HY OAS Lows Memory Lane: 2024, 2007, and 1997 10-8-24, HY Spreads: Celebrating Tumultuous Times at a Credit Peak 6-13-24 ). We will be out with more drilldowns into spreads in our separate weekly Footnotes publication on credit markets.

The above chart updates the “HY OAS minus IG OAS” quality spread differential, and we see a fresh round of compression by -11 bps this week as IG spread stayed flat while HY tightened by -11 bps. The +181 bps differential is a 1 bps tick above the recent lows of +180. The current quality spread of +181 bps is set against a long-term median of +327 bps.

The “BB OAS minus BBB OAS” quality spread differential along the IG vs. speculative grade divide compressed by another -9 bps to +58 bps, which is a handful of bps above the July 2024 lows of +55 bps. The quality spread differential is less than half the long-term median of+135 bps.
See also:
Credit Crib Note: Ashtead Group 11-21-24
Existing Home Sales Oct 2024: Limited Broker Relief 11-21-24
Housing Starts Oct 2024: Economics Rule 11-19-24
Footnotes & Flashbacks: Credit Markets 11-18-24
Footnotes & Flashbacks: State of Yields 11-18-24
Footnotes & Flashbacks: Asset Returns 11-17-24
Mini Market Lookback: Reality Checks 11-16-24
Industrial Production: Capacity Utilization Circling Lower 11-15-24
Retail Sales Oct 2024: Durable Consumers 11-15-24
Credit Crib Note: United Rentals (URI) 11-14-24
CPI Oct 2024: Calm Before the Confusion 11-13-24
Footnotes & Flashbacks: Credit Markets 11-12-24
Footnotes & Flashbacks: State of Yields 11-11-24
Footnotes & Flashbacks: Asset Returns 11-10-24
Mini Market Lookback: Extrapolation Time? 11-9-24
The Inflation Explanation: The Easiest Answer 11-8-24
Fixed Investment in 3Q24: Into the Weeds 11-7-24
Morning After Lightning Round 11-6-24
Payroll Oct 2024: Noise vs. Notes 11-2-24
All the Presidents’ Stocks: Beware Jedi Mind Tricks 11-1-24
PCE Inflation Sept 2024: Personal Income and Outlays 10-31-24
Employment Cost Index Sept 2024: Positive Trend 10-31-24
3Q24 GDP Update: Bell Lap Is Here 10-30-24
The Politics of Objective GDP Numbers: “Flex Facts” on Growth 10-30-24
Tariffs: The EU Meets the New World…Again…Maybe 10-29-24
JOLTS Sept 2024: Solid but Lower, Signals for Payroll Day? 10-29-24
Trump, Trade, and Tariffs: Northern Exposure, Canada Risk 10-25-24
Durable Goods Sept 2024: Taking a Breather 10-25-24
New Home Sales: All About the Rates 10-25-24
PulteGroup 3Q24: Pushing through Rate Challenges 10-23-24
State Unemployment Rates: Reality Update 10-22-24
Trump at Economic Club of Chicago: Thoughts on Autos 10-17-24