Wild Transition Year: The Chaos of 2007
We review the path from credit market peak in June 2007 to recession by Dec 2007 as the counterparty spiral unfolded.
Summary
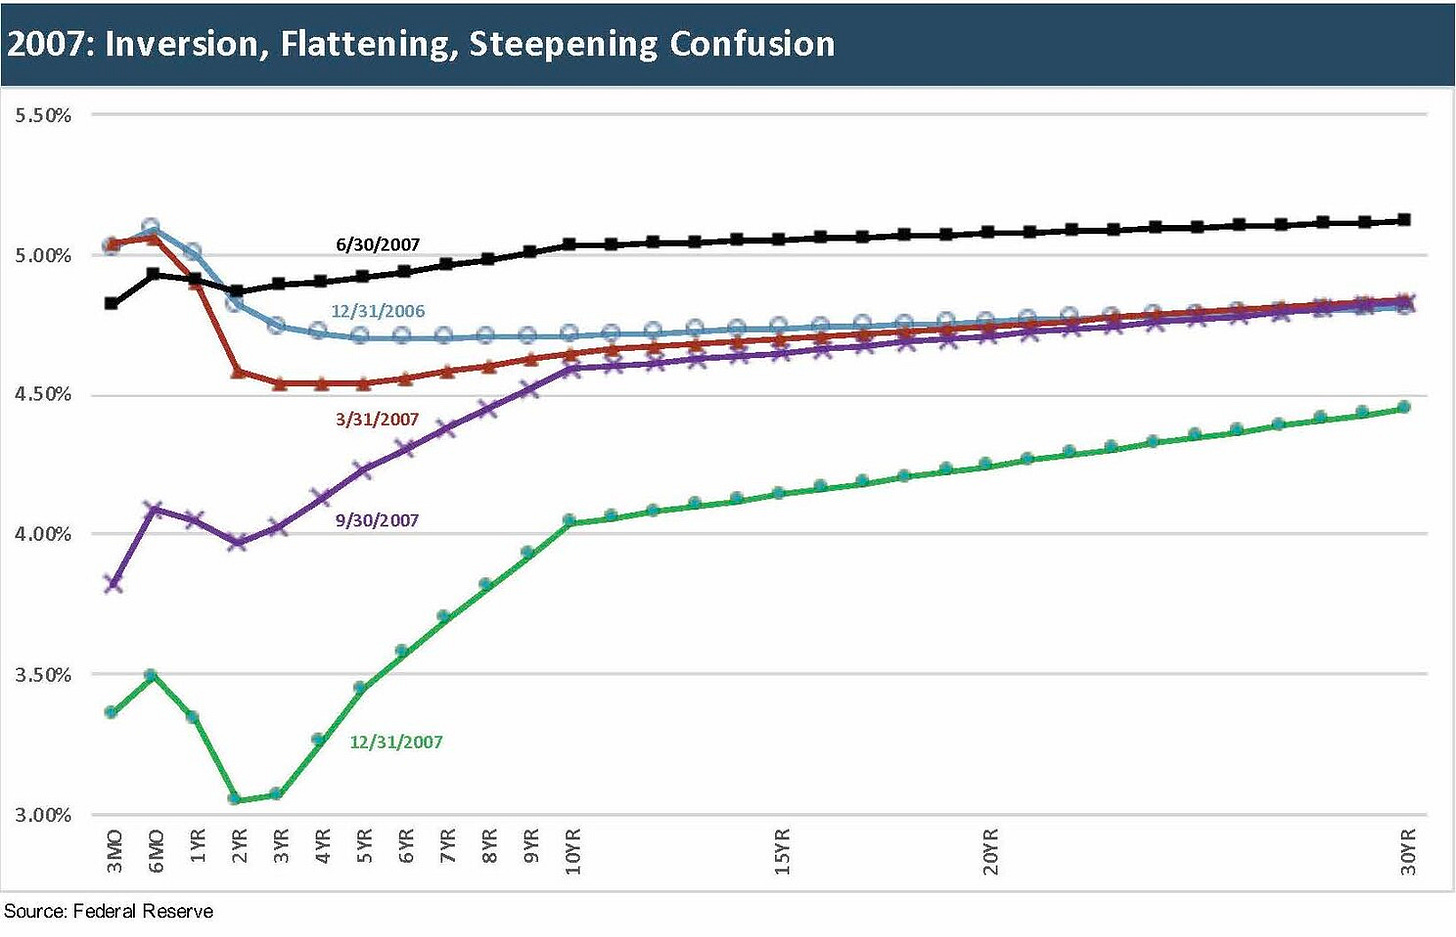
I already covered the nightmarish housing and structured credit run that lead up to 2007 at the tail end of Greenspan’s reign in Jan 2006 (see Greenspan's Last Hurrah: His Wild Finish Before the Crisis). In that commentary, I included our detailed rant on the underwriting cycle for mortgages and credit vehicles that created a level of bank/broker (and hedge fund) interconnectedness that was systemic in scale. By that point, counterparty exposure was more like a Gordian Knot of legal and quantitative input assumptions than a truly measurable risk. In this note, I focus on the credit curve migration that was unfolding across 2007 on the way to what NBER later decided was the cyclical peak in Dec 2007. The year started at a 5.25% fed funds target, but the easing action was muted considering what was unfolding and ended the year at 4.25%
The old school pattern of inversion and flattening was evident, but the Fed knew it had a problem on its hands by late summer and started cutting in the early fall even with inflation ticking higher into the 4% handles in 4Q07 from 2% early in the year. The UST curve took on a strange shape by Dec 2007 even as the credit markets had stumbled into suspended animation. Risky credit new issue supply evaporated over the summer. The 2H07 stress came after a period of intensely bullish credit markets in 1H07 and record LBOs alongside high CLO volumes.
The generic takeaway from 2007 could be “when bellwether companies panic (Countrywide for one) and tell you by way of action things are going badly, believe them.” That summer 2007 stretch was when the regulators were supposed to spring into action somewhere in the mix (Fed, OCC, FDIC) and take a hard look at counterparty risk variables and gather intel on bank interconnectedness. An absence of analysis by the banks and brokers would have been a flag. After all, that counterparty chaos had a dry run in 1998 with LTCM. Counterparty has always been an X-factor in risk, and disclosure has drifted somewhere between very poor and wicked bad.
We have been looking at UST migration patterns across the cycles in our recent commentaries while also looking back across those periods for Fed patterns and timing. I like to consider what can be learned from history, and 2007 was definitely a whiff and a big miss on risk alarms working well enough. I also typically work in some important data in the UST pieces where relevant including CPI and GDP growth. The 2007 stretch was less about its low positive GDP and low inflation earlier in the year. In the compare-and-contrast exercises, the year 2007 offers an example of a wild transition year. That can add some prisms for looking at 2022, a year that is also framing up as a wild crossover year.
The problem in the market today is that we are not quite sure what we are crossing over into with high inflation, a rapid upward move along the UST curve (see House of Pain: Markets Jump Around), and some geopolitics that are the most alarming since 1973 (Near US-Soviet clash during the Yom Kippur War) and even 1962 (Cuban Missile crisis). The 1973 period also set off the first inflation spiral (See Inflation: Events 'R' Us Timeline). The current US domestic political unraveling is getting worse, and that backdrop does not promote confidence in the predictability of policy coherence (the “cluster of circles” thing.)
In this commentary, I add another UST lookback to the collection with the closer look at the chaotic year of 2007. The volatility (and in some cases suspension of activity) in 2H07 offered the Fed a lot of ammo for revisiting where the market stood. When a company such as Countrywide needs a bailout, that should have been one of many signs for us all on the depth of the trouble. The scale of the asset quality crisis unfolding was starting to show itself although some astute bears were seeing the problems in the mortgage and derivative markets in 2006. One of the biggest problems was the lack of disclosure in the system. For example, if more regulators knew what was under the hood in AIG counterparty exposure, some louder alarms might have gone off.
The year 2007 went from a manic leveraged loan print-a-thon in 1H07 to private equity firms scrambling to cancel deals in 2H07, some hedge fund canaries going claws up, some credit structures flagging the problem of good math aptitude but bad assumptions and limited common sense (e.g., CPDOs). By August 2007, even a lot of Europeans were checking in routinely from their vacations. I was writing up a storm in Aug 2007 and got a lot of incoming. I should have known that was the ultimate bellwether indicator of trouble.
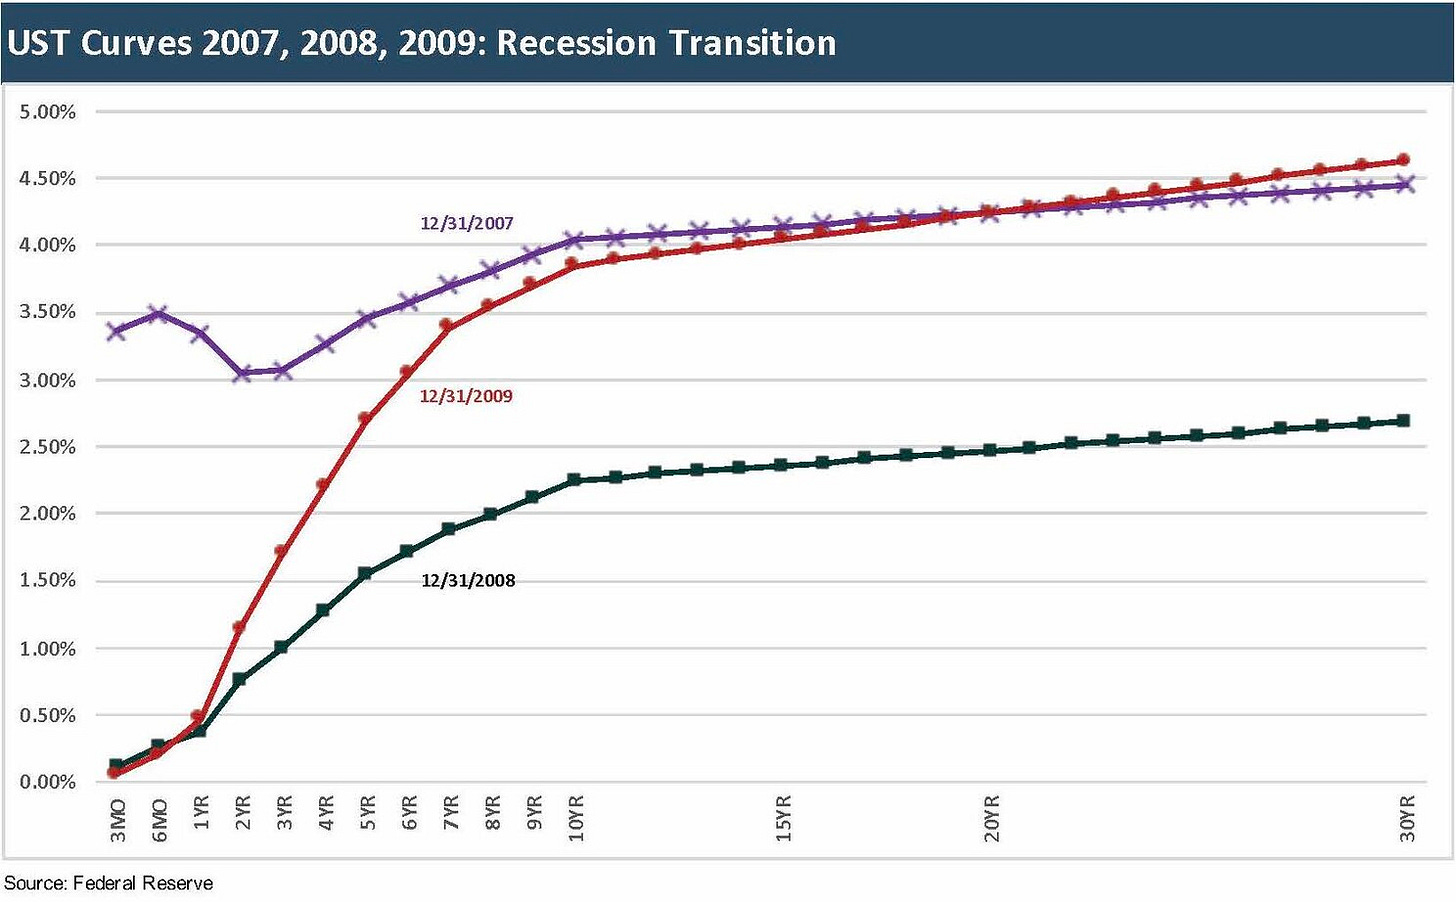
I already looked at some of the asset quality problems, counterparty risks, and collateral concentration worries in other comments, so we will not dwell on 2008 and 2009 in this note. We thought the visual above was a good one to drive home a crazy UST journey from the end of 2007 into the arrival of ZIRP in Dec 2008 and then back into the dramatic steepening by year end 2009. During 2009, the front end was still anchored in ZIRP mode (as it would remain until Dec 2015). The 2008 total returns showed equities devastated (NASDAQ -40%, S&P 500 -37%). Meanwhile, US HY posted up negative returns of -26% or around 5 times worse that its second worst year in history at -5% handle in 2000. The duration pain of 2009 during a major risk rally allowed US HY to beat the IG index return by almost 3x. Banks were in a tough state in 2009, and that did not help the fundamental story much.
The afterburn from the 2007 market mood swing (aka risk aversion) into 2008’s crisis is a well-traveled story line at this point. The leverage in the system with such overpriced and illiquid OTC credit markets spread the pain from mortgages and structured credit to the corporate sector. Corporate America from IG down across US HY was not as systemically overleveraged in aggregate as in the TMT cycle on a debt % GDP basis. The break from the trend line was dramatic in nonfinancial corporate debt % GDP in the 1990s and the 1980s. That was not the main event this time.
The lead-in to 2007 had some bad deals and excess leverage, but on an aggregate basis the trend was more manageable, and the underlying corporate quality was sound on average from a full credit spectrum perspective. That of course changed with the mortgages and structured credit problems spreading to the banks, the largest segment of the high grade corporate market. Once that happened, the worst of all outcomes followed in the form of deep credit contraction, severe risk repricing, retrenchment in market making, and a material adverse shift in refinancing risk. That is when the fuse is ignited to the lagging indicator of defaults.
When I look back at 2007, I see a reminder how volatile life can get when macro turmoil and systemic cracks dominate price action in both the UST markets and risky assets (equity, credit). In 2022, we are not in the systemic cracks period yet. This would take a lot more disarray and political division across Europe, heightened China-US tension, and the situation in Ukraine getting much worse.
Four Horsemen still in the pony stage…
Europe is worrisome given the divergence across political backdrops. We see the usual divides on sovereign credit health, but the “populists” (on a short list for overused euphemisms), and the classic democracies might not see eye-to-eye during a brutal winter. The UK of course has created its own problems that are somewhat systemic but could spill over. The dollar spike reminds us of some bad old days in EM markets, but it is still early in the game for EM turmoil such as 1998.
I have been framing the recent stretch of time as one of war (Russia-Ukraine with the US, NATO, and China in proxy roles), pestilence (COVID and all the supplier chain joy it brings), and famine (the grain setback of the last few days will not help). We just need to keep an eye out for the White Horse of systemic risk and sovereign stress. Since defaults will ride with him.
A note on our header picture…
Get Smart fans (or Mel Brooks fans) might remember KAOS as the bad guy organization. We want to emphasize that the bird is a goofy vulture and not an eagle. We have enough whack job miscreant splinter groups using the eagle symbol these days. I was first thinking of the chaos/KAOS link, and then realized the best idea is that we all need to Get Smart for what lies ahead. The Fed does not want to end up saying “missed it by that much.”
In the meantime, we await the color from the Fed tomorrow afternoon.


