
JOLTS Oct 2024: Strong Starting Point for New Team in Job Openings
JOLTS data supplies a new White House lineup with a Job Openings count above the highest level posted under Trump in Nov 2018.


JOLTS lacks visibility, Ma. Time to get on the road to look for some openings…
The economy will enter the year 2025 with a Job Openings backdrop above the peak count seen in Trump 1.0 back in Nov 2018 (7.5 million) even if the Oct 2024 openings of 7.74 million is well below the 12.2 million handle peak seen under Biden in March 2022.
Sometimes commentators forget to give context to the decline in openings since 2022, After all, many jobs were filled along the way as payrolls rose, meaning the Total Job Openings (1-month lag) come at the end of a very strong stretch of payroll additions this past few years. This latest number could be the calm before the storm with deportations ahead.
The potential for material dislocations in the Separations numbers that will come with mass deportation will make for an adventure in digging into the line items of JOLTS and nonfarm payroll into the early months of 2025. The “farm” part will need more visibility to gauge the reverse migration economic impact given the high numbers of migrant farmworkers from Mexico.
The tariff wildcard could flow into many companies along the supplier chain with multiplier effects into the direct supporting service sectors that dominate the payroll count and tertiary spillover into communities (hospitality, leisure, utilities, etc.).
That tariff fallout turns on what is real vs. what is posturing in the Truth Social tariff threats (see Mexico: Tariffs as the Economic Alamo 11-26-24, Tariff: Target Updates – Canada 11-26-24). After all, the threats imply a trade war based on moving parts outside the immediate control of trade partners and private sector employers.

The total openings for Oct 2024 climbed sequentially to 7.74 million from a revised 7.37 million in Sept. That puts the openings number at a higher level than the highest reached during Trump 1.0 (Nov 2018 at 7.5 million). That is one more reminder that the “economy problem” under Biden was about inflation and not jobs, fixed investment, or other major GDP buckets such a state and local government consumption and investment or in terms of hiring (see 3Q24 GDP Second Estimate: PCE Trim, GPDI Bump 11-27-24, Fixed Investment in 3Q24: Into the Weeds 11-7-24).
In the end, weakness in consumer/household purchasing power and inflation was the dagger for Biden (see The Inflation Explanation: The Easiest Answer 11-8-24). That fueled the 49% handle “landslide” win for Trump.
That inflation political penalty might offer a reminder to the new White House team that inflation avoidance is the #1 priority for keeping House and Senate control. Biden joins the list of inflation victims alongside Ford and Carter. The tariff and labor connection to inflation will remain a hot topic in the new year as migrant buses get filled along with relocation camps and tariff decisions need to get finalized. Supply and demand still rule the pricing of goods and workers in the world of reality (i.e., the world outside Washington).

The above chart updates Hires vs. Layoffs/Discharges. We adjust the chart to remove the COVID impacts that would severely distort the visual and obscure the data trends in more “normal” times. We address the wild swings during COVID further below in a text box.
Hires of 5.31 million in Oct ticked down slightly from September’s 5.58 million. Layoffs/Discharges of 1.63 million in Oct were down from 1.8 million in Sept. Hires were above the long-term median and Layoffs/Discharges were below the long-term median. That goes in the positive news column in context.

The above chart frames the ratio of Hires to Layoffs/Discharges across time. At 3.25x, the relationship is closer to the median of 3.0x but well down from the late 2021 peak of 5.1x as the post-COVID rebound and ZIRP was feeding demand for goods and services across the board.

The above chart updates the run rates of Hires vs. Total Separations. As already noted, Hires ticked lower. Separations ticked higher to 5.26 million in Oct vs. 5.20 million in Sept as Quits ticked higher from 3.1 million to 3.33 million on a SAAR basis.
Note: We remove the distortions from COVID as detailed in an earlier chart.
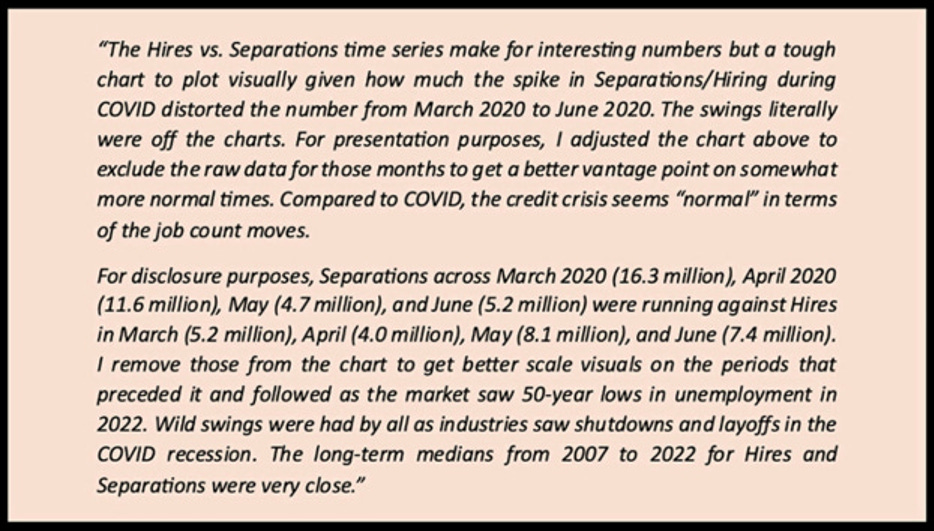
The above text box revisits the unprecedented, COVID-driven swings in Separations and subsequent Hires/Rehires as the Great Reopening got underway. Combined March and April 2020 Separations approached 28 million with over 16 million in March and almost 12 million in April. You can understand why we adjust the scale of the charts with those numbers dwarfing the visuals of even the most exaggerated move in a normal cycle.
The memories of that period tend to get distorted by the political axe grinding and partisan revisionism as the “crazies and ideologues” wail over shutdowns, vaccines, and government intervention (competent or otherwise). The grasp on the risks at the time was not a strong one (Lysol memories, etc.), but morgues were jammed, overflow bodies were being stored in freezers, people were banging pots and pans out their windows to honor fearless (or terrified but courageous) health care workers. Temp structures were going up (including in Central Park), masks faced shortages, and Purell was like water in a WWII Sahara movie.
Strange times and low confidence prevailed even if memories get a cinematic do-over for today’s political convenience. We liken it to some of the ignorance around the causes and risks of the financial crisis in late 2008, but that is another story. The trick for the opportunists has been to trust people to be forgetful, stupid, or committed to whatever story lines get pitched by “leaders” for their own purposes.
Those numbers in the box above tell a story of panic and the effects of lockdowns. With medical geniuses such as RFK Jr. taking the helm, the beauty of the internet is just to go back and look at real time coverage and do not rely on the revisionist story line of today’s partisans. Then ponder “How would these new leaders treat vaccine development and delivery back in those days. No vaccines? Herd immunity? What would be the over/under on the body count if this crew was running national health care in March 2020?”

The above chart updates the Hires minus Separations differentials across the cycles. The Oct 2024 differential of 52K is now below the median of 197K on the rise in Quits levels flowing into Separations while Hires declined. That is an interesting development in Quits since that is supposed to be an indicator of relative confidence levels.

The above chart frames the level of Quits as a % Separations, which include quits, layoffs, discharges and “other separations.” Quits has risen to over 63% of Separations vs. the long-term median of 57.7%
The numbers tied to actual separations or based on the threat of deportation could mix up the categories a bit in coming months. The nature of “involuntary” is in the eye of the beholder on deportation or quits as a form of flight from authorities and migrant crackdowns. Life will get very ugly very quickly in some areas.
The classic “Quits rate” is Quits as a % of total employment. That number ticked higher sequentially from 1.9% in Sept 2024 to 2.1% in Oct 2024 on a SAAR basis. That is down from 2.3% in Oct 2023.
See also:
Footnotes & Flashbacks: Credit Markets 12-2-24
Footnotes & Flashbacks: State of Yields 12-1-24
Footnotes & Flashbacks: Asset Returns 12-1-24
Mini Market Lookback: Tariff Wishbones, Policy Turduckens 11-30-24
PCE Inflation Oct 2024: Personal Income & Outlays 11-27-24
3Q24 GDP Second Estimate: PCE Trim, GPDI Bump 11-27-24
New Home Sales Oct 2024: Weather Fates, Whither Rates 11-26-24
Mexico: Tariffs as the Economic Alamo 11-26-24
Tariff: Target Updates – Canada 11-26-24
Mini Market Lookback: Market Delinks from Appointment Chaos… For Now 11-23-24
Credit Crib Note: Ashtead Group 11-21-24
Existing Home Sales Oct 2024: Limited Broker Relief 11-21-24
Housing Starts Oct 2024: Economics Rule 11-19-24
Mini Market Lookback: Reality Checks 11-16-24
Industrial Production: Capacity Utilization Circling Lower 11-15-24
Retail Sales Oct 2024: Durable Consumers 11-15-24
Credit Crib Note: United Rentals (URI) 11-14-24
CPI Oct 2024: Calm Before the Confusion 11-13-24
Mini Market Lookback: Extrapolation Time? 11-9-24
The Inflation Explanation: The Easiest Answer 11-8-24
Fixed Investment in 3Q24: Into the Weeds 11-7-24
Morning After Lightning Round 11-6-24