
Fixed Investment in 3Q24: Into the Weeds
We revisit the impressive growth in equipment, structures, and intellectual property investment from pre-COVID 4Q19 through 3Q24.


The election is over. The are a wide range of potential scenarios from here…
With the election over, Trump is inheriting an economy where investment has been impressive. That is evident in the objective numbers with a starting point that did not get enough credit in all the political noise (see Morning After Lightning Round 11-6-24 ). With that now over, the reality is that Trump has a very good starting point for his policy plan. He can’t claim he was handed a mess in terms of investment.
The trend line in fixed investment had been very strong relative to the 4Q19 pre-COVID level, but that is now leveling off in aggregate as of 3Q24 GDP numbers. The most recent short term growth trends show Equipment as the standout, investment in Intellectual Property products (“IP”) modest, Residential investment weak, and Structures seeing growth contract after a very heady run (see 3Q24 GDP Update: Bell Lap Is Here 10-30-24).
The strong growth under Biden relative to the 4Q19 period under Trump just before COVID has been impressive and reflects well on recent economic trends that drove the post-COVID recovery. The crossroads are here again with new leadership in Washington as Trump now takes the baton in what will likely be a full sweep once the House is sorted out (too early to call on House).
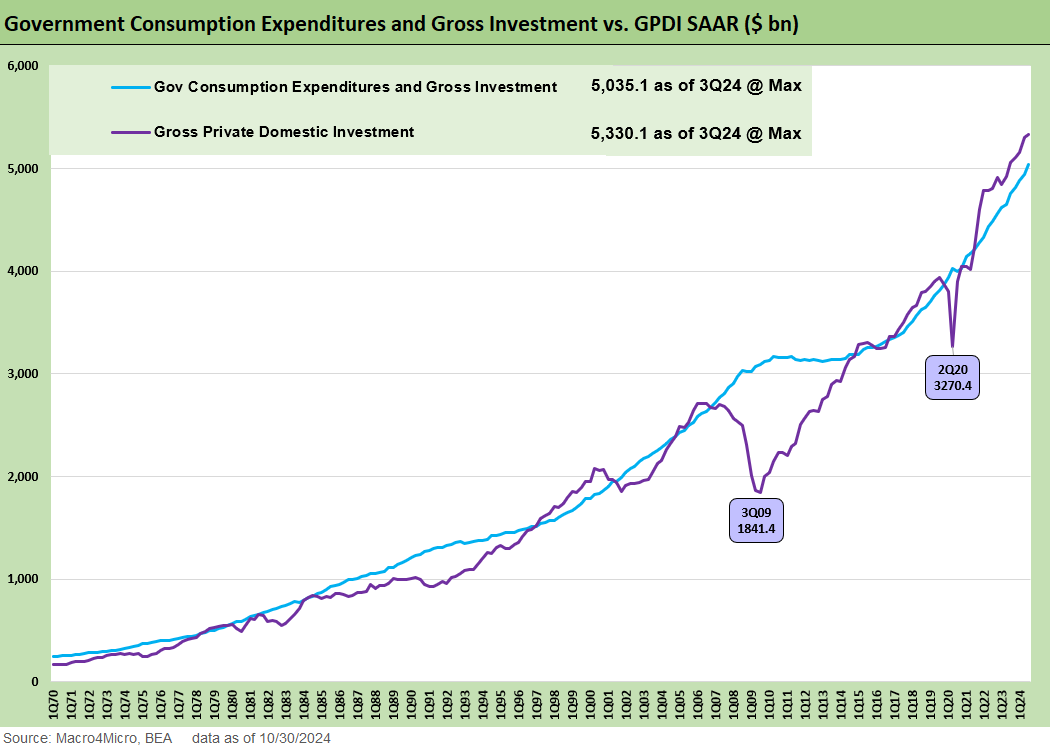
The Gross Private Domestic Investment (GPDI) line that rolls up the various components was just above flat in 3Q24 on a net basis (+0.3% in GDP stats) while accounting for just over 18% of 3Q24 GDP. Compared to the 4Q19 pre-COVID numbers under Trump, however, the Equipment, Structures, and IP lines were up dramatically as we detail below.
The Government consumption expenditures and gross investment line accounted for just over 17% of GDP with the highest growth rates seen in National Defense at +14.9% growth. Defense comprised 56% of Federal spending but only 22% of total Government spending.
In this commentary, we look at the investment line items of the recent 3Q24 GDP release (advance estimate) with the second estimate due later this month (see 3Q24 GDP Update: Bell Lap Is Here 10-30-24). The post-election period makes it easier to address with “relative peace” in political rhetoric (game over, Trump and GOP won) and less need for mis/disinformation flow. That said, we’ll likely see non-stop misinformation. We remind the reader that Project 2025 seeks to roll up all of the economic data (e.g. BLS, BEA) under one umbrella closely managed by the White House. We’ve covered that in earlier commentaries. That is an easy way to avoid performance scrutiny.
The charts offer a way for us to start a new game clock on how the old regime did and hold it up to what the new team plans to do with an investment focus wrapped around tariffs driving reshoring and the plans for sustained “capex expensing” via tax incentives as seen in the Dec 2017 tax bill. There are many long-tailed projects underway that could get second guessed and undermined in budget battles and legislative changes that will need to be monitored. There will be much to track in 2025 given the memory of the capex fade seen with tariffs that led the FOMC to ease back in 2019.
Gross Private Domestic Investment, Fixed Investment Nonresidential, Residential
There is a lot of data behind the GPDI buckets, and we typically dig into the Nonresidential layers of GPDI each quarter. Below we look at the gross investment numbers broken out in the GDP release in our quarterly drilldown into the underlying line items. We started doing this a while back to demystify the mix and show some history (see 2Q24 GDP: Into the Investment Weeds 7-25-24). Objective data takes the BS out of all the political spin (aka “lying”).
Facts are not the “go to” game plan too often in media and politics these days, but these numbers reflect very well on the Biden term economic performance. That did not help Harris in the end with inflation the overriding variable, but the “consumer consuming” plus corporate sector investing is the vast majority of GDP and where Trump’s policies will win or lose.
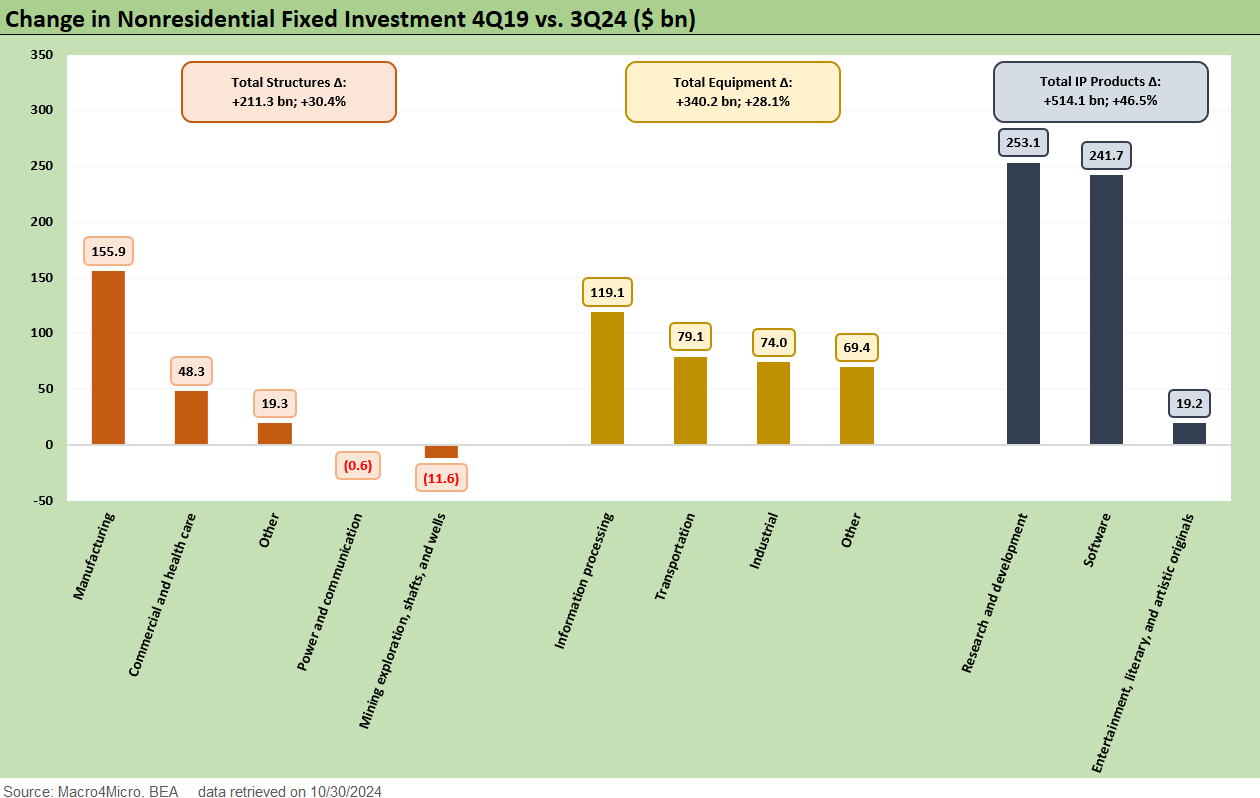
We include a range of charts, tables, and line items herein. The theme is “much higher fixed investment in 3Q24 than 4Q19” which offered a strong complement to the healthy consumer sector. The above chart compares the investment numbers for the major nonresidential categories of 3Q24. We frame those against the last pre-COVID quarter under Trump in 4Q19. That strikes us as fair rather than looking at 2020 and COVID numbers.
The impressive growth is a matter of fact in all 3 major nonresidential investment lines with IP up by over +46%, Structures up by +30%, and Equipment by +28%. Obviously, there is a lot going on in tech and IP in the age of AI and tech transitions, and we saw NVIDIA just bumped Intel from the Dow for a reason and data center investment soaring.
Between the PCE lines of the consumers and the payroll adds well above what COVID lost, there is a reason why Trump seldom used numbers in qualitative rants about the Biden/Harris economy. That is old news already, and the starting point is helpful since the policy actions ahead will set the next round of increases (or declines). As noted, tariffs were not kind to investment back in 2018-2019.
Much of the attention is justifiably on the consumer and PCE lines at 68% of GDP (see PCE Inflation Sept 2024: Personal Income and Outlays 10-31-24, 3Q24 GDP Update: Bell Lap Is Here 10-30-24). Next in line is the Gross Private Domestic Investment (GPDI) line which is dominated by Nonresidential Investment at around 3.5x Residential in GDP. We look at the Residential trends separately in our housing sector research. The spike in mortgage rates took another leap higher after the election and the builder equities were selling off hard after a very strong run YTD and LTM.
Overall, GPDI is over 18% of GDP and the Nonresidential slice is almost 14%. GPDI is higher than the total of all Government spending (Federal + State +Local) and Nonresidential is higher than all Federal government spending. It is also higher than all State and Local government spending. This is where categories such as manufacturing outlays, construction, real estate, machinery and equipment, and software/tech investments live.
The consumer sector is always the main event in the quarterly GDP release, and the Personal Consumption Expenditures (PCE) line was 68% of GDP. The past few years have seen very favorable trends in overall GPDI with the rate of growth peaking in 3Q23 on the ramp-up of a range of private, public, and legislatively stimulated private sector programs addressed in earlier commentaries (see links at bottom).
As the 2022 inflation spike and tightening cycle took effect, life got better quickly and the potential for lower rates was a hope that has had mixed results so far. That said, the absolute level of rates are extremely low in long term multicycle context (see Footnotes & Flashbacks: State of Yields 11-3-24).
The pattern of the two lines above in the chart underscore the impressive growth in GPDI. We also see that government spending is a material and regular driver of growth as well as budget deficits. The GPDI shows the effect of a few brutal “time outs” in the cycles including the recession that bottomed out in the summer 2009 and with the COVID meltdown in 2Q20.

The Equipment investment time series and Structures lines are broken out above across the cycles. We had posted our first cut on recent trends in a recent 3Q24 GDP note (see 3Q24 GDP Update: Bell Lap Is Here 10-30-24), and the Equipment line was the standout performer at +11.1%, up from +9.8% posted in 2Q24. The Equipment line is around 70% larger than Structures, and Equipment has been growing impressively despite some setbacks during Trump’s tariff battles and then COVID.
The theory around whether the Dec 2017 tax program to promote sustained equipment investment would prove to be a sugar high, a pull-forward, or a lasting tailwind was never quite tested. The overlap with tariff setbacks clouded the assessment, and the weaker capex that ensued undermined the growth story in what ended up as a 2% GDP overall growth market in the period before COVID under Trump (see The Politics of Objective GDP Numbers: “Flex Facts” on Growth 10-30-24). The weaker exports that came with the trade battles did not help (the rationale for FOMC easing in 2H19). Then came COVID and some major distortions.
There is no question that the main event for Structures has been the legislative initiatives (IRA, CHIPS, Infrastructure bill) as covered in some of our construction commentaries (see Construction Spending: Stalling Sequentially at High Run Rates 6-4-24 and related links). However one feels about the target markets such as EVs or battery plants, that is a lot of economic activity that fueled multiplier effects for jobs and notably in the construction markets (see Payroll Oct 2024: Noise vs. Notes 11-2-24).
The question of how many of the incentives and fiscal support actions from Biden will get dialed back under Trump will be an important variable for many major capex programs underway or in planning. Trump has been a vocal critic of many programs and initiatives including EVs. Trump has a buddy in the EV field named Musk, and he might have a few ideas for how that sector should (and who should) be supported by policy. Musk may also have some ideas on how much competition is needed in the satellite and space launch system field, but that’s a separate topic for another day.
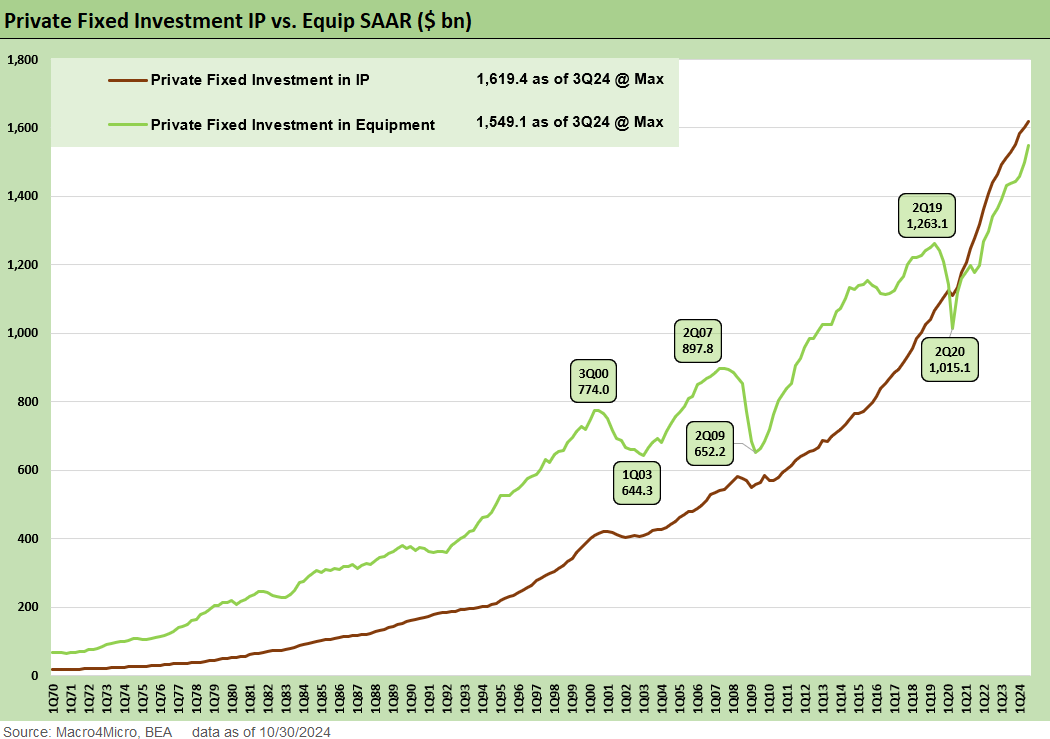
The above chart replays the Equipment line but frames it against the time series for Fixed Investment in Intellectual Property Products (“IP”). The steady growth of IP has been a secular trend not a cyclical pattern. IP investment has been solid under everyone. There is clearly room for a lot more ahead that will also drive a heavy base of power investment and data center construction. The IP investment is more about the government getting out of the way, but the semiconductor challenges need fiscal support. The same could be said in the power sector to support IP and tech investment.
Raw numbers take the BS out of the economy debate…
In the last few tables, we include the raw numbers, and those cut through all the recent (and now unnecessary) political double talk about the state of the economy. Just look at the tables and categories and ask simple questions:
Are the investment lines higher now than 4 years ago? 6 years ago? Yes, materially higher with a few line item exceptions (upstream oil and gas, which will now change under Trump).
Do companies invest more when they have low confidence or are pessimistic about economic prospects? The numbers reflect optimism.
Are the investment levels stable in 2024 vs. 2023? (just scan the totals) or do they reflect the depression conditions cited by Trump this last week after the jobs report? Clearly something good is underway for many.
Which lines might be put at risk in high tariff and trade war scenarios? That is the exercise for 2025 as tariffs get stoked up.
Which Industries will be inclined to invest more in a trade war or trade clash? Or will it be a time for caution subject to uncertainty over how long those policies will last? The flip side of calling tariffs “negotiating tactics” is that implies an unknown shelf life for evaluating project economics.
Which industries will be inclined to invest in 2025-2026 for projects that might take years to come online when they are experiencing severe cost pressures from tariffs and rising supply chain costs?
Which industries might simply raise prices in a tariff-laden market to offset costs and instead buy back shares?
There are obvious questions where logic applies and others which are more speculative. We would highlight that cost pressures from tariffs and export pressures from retaliation led to economic slowing in 2019 with investment and weak exports specifically cited by the Fed in their 2019 easing actions. The FOMC cited “business fixed investment and exports have weakened”. Then came COVID.
For these charts that follow, we frame the deltas vs. 4Q14 for a long-term time horizon comp given the long lead time of many projects. We wanted to include a starting point comfortably after the credit crisis and well before COVID. We also wanted to give some lead time before Trump’s first term for a fair read. The reader can pick a year and a column at will and compare them to today. The 4Q14 start date also included the last quarter as the oil market was just starting to unravel in a brutal downturn in upstream capex. We focused on 4Q19 on the chart at the top of this piece since it was the last pre-COVID Trump quarter.

The above chart details the Structures totals since 4Q14 and includes each of the last 4 quarters. We see a +30% increase in 3Q24 ($907.4 bn) vs. 4Q19 for Structures at the total line. For Equipment, we see a +28% increase to $1548 bn at 3Q24 vs. 4Q19. The reader can follow the bouncing ball by line item and category in comparisons.
The E&P line shows the 4Q14 period high in the timeline presented since 4Q14 was when the Saudi oil price war and market share grab was in full swing. That was before the debt-financed boom in HY upstream energy was unraveling into a brutal multi-year default cycle for E&P borrowers. We can assume those outlays from 3Q24 might go much higher under Trump, but the E&P line is small in the overall context of structures outlays. The upstream sector has also learned the hard way on how too much supply could send prices tumbling.

The above chart focuses on equipment categories, and we see a material increase in total for 3Q24 vs. 4Q19. For the Equipment line sub-categories, we see 3Q24 at +28% to 4Q19 with major sub-categories in Information Processing (+30%), Industrial Equipment (+29%), and Transportation Equipment (+27%) materially higher. The “Other Equipment” bucket is +26%. Those are the numbers. How to interpret them is a separate issue, but they are most certainly higher. Private sector decision makers are the ones allocating capital, and not the political candidates as they waged war across party lines for 4 years.
Glenn Reynolds, CFA glenn@macro4micro.com
Kevin Chun, CFA kevin@macro4micro.com
See also:
Morning After Lightning Round 11-6-24
Footnotes & Flashbacks: Credit Markets 11-4-24
Footnotes & Flashbacks: State of Yields 11-3-24
Footnotes & Flashbacks: Asset Returns 11-3-24
Mini Market Lookback: Showtime 11-3-24
Payroll Oct 2024: Noise vs. Notes 11-2-24
All the Presidents’ Stocks: Beware Jedi Mind Tricks 11-1-24
PCE Inflation Sept 2024: Personal Income and Outlays 10-31-24
Employment Cost Index Sept 2024: Positive Trend 10-31-24
3Q24 GDP Update: Bell Lap Is Here 10-30-24
The Politics of Objective GDP Numbers: “Flex Facts” on Growth 10-30-24
Tariffs: The EU Meets the New World…Again…Maybe 10-29-24
JOLTS Sept 2024: Solid but Lower, Signals for Payroll Day? 10-29-24
Trump, Trade, and Tariffs: Northern Exposure, Canada Risk 10-25-24
Durable Goods Sept 2024: Taking a Breather 10-25-24
New Home Sales: All About the Rates 10-25-24
PulteGroup 3Q24: Pushing through Rate Challenges 10-23-24
Existing Home Sales Sept 2024: Weakening Volumes, Rate Trends Worse 10-23-24
State Unemployment Rates: Reality Update 10-22-24
Housing Starts Sept 2024: Long Game Meets Long Rates 10-18-24
Trump at Economic Club of Chicago: Thoughts on Autos 10-17-24
Retail Sales Sep 2024: Taking the Helm on PCE? 10-17-24
Industrial Production: Capacity Utilization Soft, Comparability Impaired 10-17-24
CPI Sept 2024: Warm Blooded, Not Hot 10-10-24
HY OAS Lows Memory Lane: 2024, 2007, and 1997 10-8-24
CarMax: Why Do We Watch KMX as a Bellwether? 10-3-24
Credit Returns: Sept YTD and Rolling Months 10-1-24
GDP and Construction:
3Q24 GDP Update: Bell Lap Is Here 10-30-24
2Q24 GDP: Final Estimate and Revision Deltas 9-26-24
GDP 2Q24: Banking a Strong Quarter for Election Season 7-25-24
2Q24 GDP: Into the Investment Weeds 7-25-24
Construction Spending: Stalling Sequentially at High Run Rates 6-4-24
Construction Spending: Timing is Everything 12-1-23
Construction: Project Economics Drive Nonresidential 10-2-23
Construction Spending: Demystifying Nonresidential Mix 5-9-23