New Home Sales: Thanksgiving Delivered, What About Christmas?
New Home Sales delivered YoY and sequential growth as the South rebounded and median prices declined.
November new home sales trends brought some favorable news late in the year as sequential trends ticked higher by +5.9% and YoY rose by +8.7% even with mortgage rates higher in the market since Sept.
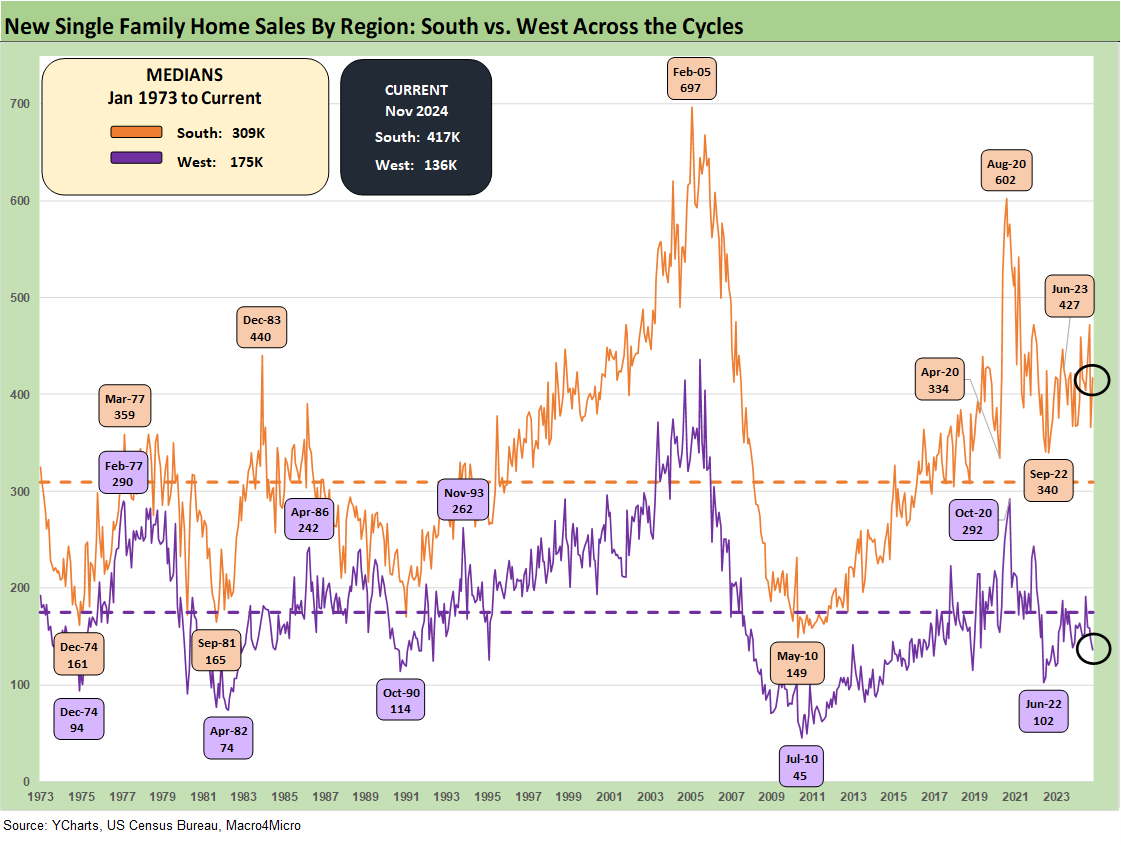
The South region was 62% of sales volume and rose by +13.9% sequentially from a weak Oct and +13.6% YoY. The #2 region, the West, was down by -7.5% sequentially and -1.4% YoY, leading to a mix shift away from the highest price region.
The regional mix shift on the month could be part of the lower median price story as prices declined to $402.6K vs. $429.6K last year at this time. The reality for homebuyers is that they get “less house for their dollar” or “pay more dollars for the same house” subject to financing and incentive packages.
The builders can always turn to their proven incentive programs (mortgage buydowns, fee relief) using their financial and mortgage operation arms to support volumes. The major builders have been down this road already to sustain volumes, but it comes at a profit margin cost.
The above chart plots the new single family home sales from the 1960s, across the baby boom buying and cyclical whipsaws of the 1970s and 1980s, then into the demographic lift of the 1990s and housing bubble cycle that peaked for the homebuilders in 2005.
The favorable demographic trends in the face of a housing supply shortage today will remain an ace in the hole for the homebuilders with their main challenges – apart from high mortgage rates and high home prices - being execution on prudent working capital management and creative use of incentives to drive volumes.
Their community planning includes priorities of delivering new homes that are properly priced in the right product tier for any given MSA. They need to deliver an inventory of homes at a cost structure that brings them a reasonable profit margin. That is of course easier said than done, but the builders have been executing quite successfully in challenging markets as evident in their profitability, gross margins, and SG&A structures. The cash flow fundamentals across this tightening cycle have allowed debt reduction, stock buybacks and in many cases dividends.
Credit quality has been favorable across the Fed tightening cycle and mortgage rate climb, and that is not an accident. The homebuilders control what they can, and there is much they cannot control. The biggest threats near term include the higher long-dated UST rates (10Y UST) that flow into mortgages, labor cost issues tied to mass deportation of their skilled and semi-skilled labor base (read “Mexico”), and supplier chain threats in the event of high tariffs that disrupt supply flow and slow down construction cycles.
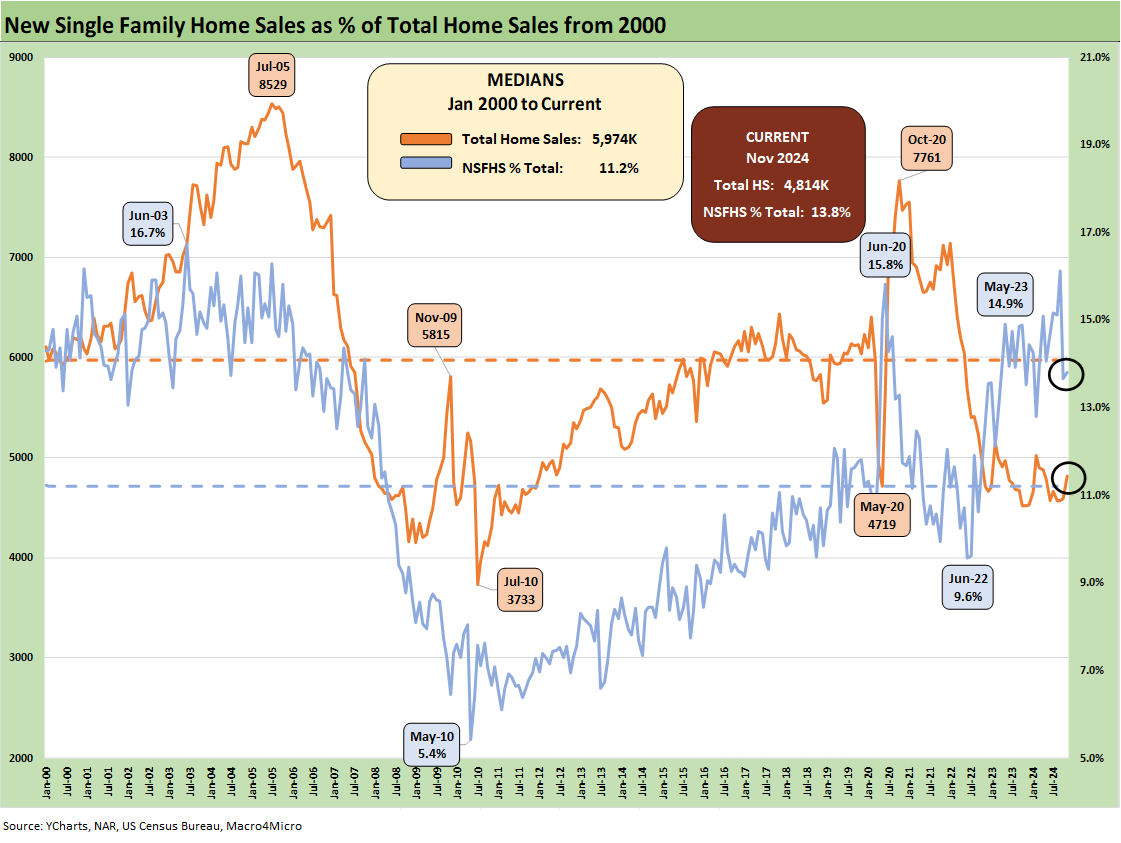
The above chart plots new single-family homes and new home sales as a % total home sales (total = existing + new). Nov 2024 posted a new home sales share of 13.8% vs. the long-term median of 11.2%. The share is down from the peak sales share as seen in 2023 and noted in the chart.
The tighter supply of existing home inventory with rates rising had been a theme for a while but has been easing up modestly as rates came down since the near 8% peak. We have looked at these inventory issues in past commentaries, and the existing home sales release show existing home inventory is well off the low tick (see Existing Home Sales Nov 2024: Mortgage Vice Tightens Again 12-19-24). The market could continue to see more potential sellers and buyers in the existing home sales market capitulate and lose hope that mortgage rates will come down meaningfully.
For the builders, they will just keep on doing what they have been doing and managing starts in the context of sales and watching trends in mortgages, labor, and supplier chains. The year 2025 will bring some of the same challenges but also some new ones with trade, tariff, and labor questions.
The above time series updates the median prices for new homes sold. Even with the recent declines from the $460K peak in fall 2022, the Nov 2024 median price is still around 30% above the COVID low price (April 2020). The Nov 2024 median price was still the lowest on the chart since mid-2021. We are seeing a shift in builder pricing strategies as well as land acquisition strategies to stay with higher variable costs and in many cases more “asset lite” strategies.
The above bar chart gives a bit more granularity on the month-to-month price action since just before the end of ZIRP and the start of the tightening cycle.
The above chart frames the trend line for the two largest regions of the South and the West. On a not seasonally adjusted (NSA) basis, new homes for sale at the end of the period were both at a high in terms of units and months supply.
Even if the major builders have been disciplined and make their case on earnings calls, there is a very long tail of private builders that may have been caught by surprise on where recent mortgage trends have headed. They would be in good company given how bullish the UST curve forecasts were at this time last year.
The above chart updates the timeline for the two smallest regions in the Midwest and Northeast. The Midwest is also near a 1-year high in inventory on an NSA basis with the Northeast below the highs.
Housing:
Footnotes & Flashbacks: State of Yields 12-22-24
Existing Home Sales Nov 2024: Mortgage Vice Tightens Again 12-19-24
Housing Starts Nov 2024: YoY Fade in Single Family, Solid Sequentially 12-18-24
New Home Sales Oct 2024: Weather Fates, Whither Rates 11-26-24
Existing Home Sales Oct 2024: Limited Broker Relief 11-21-24
Housing Starts Oct 2024: Economics Rule 11-19-24
Harris Housing Plan: The South’s Gonna Do It Again!? 8-28-24
Homebuilders:
Toll Brothers: Rich Get Richer 12-12-24
PulteGroup 3Q24: Pushing through Rate Challenges 10-23-24
KB Home: Steady Growth, Slower Motion 9-26-24
Lennar: Bulletproof Credit Despite Margin Squeeze 9-23-24
Credit Crib Note: PulteGroup (PHM) 8-11-24
Credit Crib Note: D.R. Horton (DHI) 8-8-24
Homebuilders: Updating Equity Performance and Size Rankings 7-11-24
Credit Crib Note: KB Home 7-9-24
Lennar: Key Metrics Still Tell a Positive Macro Story 6-20-24
Credit Crib Note: NVR, Inc. 5-28-24


