
Credit Crib Note: United Rentals (URI)
We update our views on the credit quality, operating profile, and financial fundamentals of United Rentals.


CREDIT QUALITY TREND: Positive
URI’s business risk, financial profile, cyclical resilience, and liquidity strengths are not adequately reflected in URI’s credit ratings. Simply put, the company should be investment grade on an unsecured basis now despite the more complex capital structure and layers. Financial metrics, business risk, and track record are all on URI’s side.
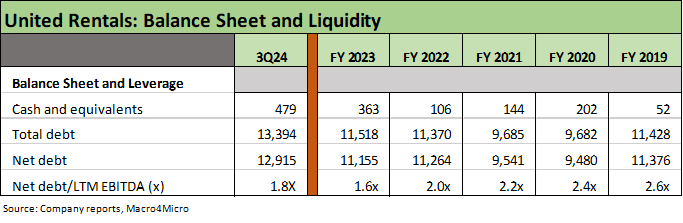
Record revenues, record EBITDA, and high EBITDA margins leave ample room for both replacement capex and growth capex while balancing shareholder rewards. The financial metrics overall tell a very healthy financial story around URI. URI’s exceptional free cash flow consistency and a proven business model have created an industry leader with under $13 bn in total debt framed against over $56 billion in market value of equity, over $7.0 bn in LTM Adj. EBITDA expected for FY 2024, and net leverage of 1.8x as of 3Q24.
The layers of the capital structure complicate the credit ratings tiering with 1L, 2L, and unsecured bonds, but the strength of cash flows and extremely strong franchise value more than offset that structural subordination risk. The layers provide more protection on the extreme downside, but a proven ability to navigate cycles has value on the way into a very mixed set of economic policy outcomes and cyclical scenarios.
Some of the capital structure tiering was a function of bringing in more IG investors to diversify funding sources and the desire to execute quickly on M&A deals during a volatile tightening cycle. ABL and term loans are part of growing the business across periods of turmoil with the flexibility for URI of picking their liability management opportunities later to refi and extend as the UST curve declines.
URI plays the long game and has deep access to any of the credit markets from A/R to ABL to term loans to bonds. The accelerated M&A has paid off across time for URI stock vs. peers in the rental or capital goods markets.
URI has been tested across some tough markets since it started ramping up in the 1990s. The #1 equipment leasing operator has grown through credit market turmoil (2001-2002), a banking systemic shock (2008-2009), a brutal pandemic (2020), various supplier chain shocks (2020-2022), and an aggressive Fed tightening cycle that had not been seen since the Volcker years. Across that series of headwinds, URI has consistently grown its revenue and cash generation and in recent years accelerated its M&A.
With the Fed now easing, URI’s sequential cost of capital will be a beneficiary. The acquisition pace and heavy capex has enhanced the diversification of its end markets and equipment portfolio at a time of very strong construction activity. The rate of growth has been slowing and notably in some local markets, but the multiyear megaprojects have been a home run.

OPERATING PROFILE
The equipment leasing sector remains fragmented even as URI and Ashtead (Sunbelt brand) have grown their North American market share to over ¼ of the market with URI at 15% and Sunbelt at 11%. Herc Rentals (HRI) is a distant #3 at a 4% share as of 2023 and posts a market cap of $6.3 billion (11-13-24). URI’s market cap is almost 9x that of HRI.
URI has established itself as the leader in an equipment rental industry that had been one of those fragmented industries getting rolled up over the past two decades for reasons that extend beyond rationalization and cost efficiencies. M&A to broaden market exposure and equipment range has been a cornerstone of its strategy, and it has worked well for both equity and credit quality. A key driver behind building out the geographic mix of service locations and broadening the equipment categories ties into the positive secular trends where leasing growth is outpacing equipment growth as more users switch to leasing.
The tailwinds tie into rising demand and higher costs of equipment ownership, the expense of maintenance and servicing, and the rising mix of specialty equipment with all the related complexity (application, connectivity, etc.). Leasing outpaces the growth in equipment sales as many active users of equipment see the lease financing alternative as superior to ownership given uneven usage of many equipment types, project timelines and needs that vary for contractors and subcontractors, and personnel demands to maintain equipment.
The more obvious increases in the cost of financing purchases with high rates and a short-end UST inversion was another factor for bottom lines and balance sheets. Tariffs could increase the cost of equipment from offshore sourcing as well as from onshore OEMs and manufacturers that face rising costs of components in their supplier chain. That would further strain equipment buyers and favor leasing.
Equipment Rental benefits from favorable secular growth trends across numerous industry verticals. The recent trends now add the benefits from waves of megaprojects awarded in recent years across manufacturing (e.g., EVs, Semis), metals/mining (materials and intermediate products), numerous major energy projects (LNG), and public sector infrastructure. URI flags the durability of key catalysts across the infrastructure bill, the IRA, the CHIPS Act, EV related construction, and LNG on the “now” list. While some projects could get scaled back after the election, others could increase and notably in energy and power.
The topic of data center construction and the related AI expansion and power needs get a lot of focus. The longer tail of reshoring construction and return of the supplier chain is part hope and part real for the industrial and manufacturing markets. We say “part real” since we have already seen (2018-2019) that high tariffs are not necessarily a direct catalyst for more capex. The growth in data centers (tied to AI or otherwise) is a hot topic as are shortages of power generation capacity generally. Those are also long-term secular themes.
The tariff issues raise questions on the price of the equipment and uncertainty around how supplier chains will evolve even more into the economics of “lease vs. buy.” In the supplier chain meltdown, just having a major equipment fleet was a decisive edge. URI was able to run up its rental revenue metrics in 2021-2022 as broken out in URIs productivity charts that it details in its quarterly slide packs.
The mix of factors overall brought revenue opportunities but also made leasing a better option. These moving parts add up to a lot of top-down demand variables at work. Tariffs could cause retrenchment and threaten recession risk, but those are debates that will play out in 2025-2026 with the election now over.
FINANCIAL TRENDS
URI has the luxury of so much free cash flow before growth capex and shareholder rewards that the company can essentially pick its leverage. That is rare. The improved financial risk profile is less about the expectation of sustained higher margins and lower leverage than the fact that URI’s cash flow dynamics and the ability to manage leverage, fleet size, and the moving parts of free cash flow (notably gross capex vs. net capex) make for an IG-quality credit risk profile. That is not mirrored in BBB tier industrials with high fixed costs or commodity exposed energy names. We could see growth slow after such heady and high EBIDTA margins feel some slight pressure, but the free cash flow and financial flexibility story remains intact.
The depth of the used equipment market is a readily available source of funds to manage fleet mix higher and lower. The ability to adjust fleet through short lead time decisions on purchase or used equipment sales underscores the intrinsic financial flexibility of URI. For 2024, URI expects $1.5 bn to be sold into a used equipment market that remains deep with many contractors choosing used over new equipment on affordability.
The mix of secured and unsecured debt across ABL, term loans, and bonds are unusual for an IG company, but URI is a rare company housed in both the IG and HY index. The ability to execute on billions in cash acquisitions while keeping Net debt/EBITDA below 2x across a tumultuous period is extraordinary while the track record of successfully integrating that pace of deal flow has reassured equity markets as well as lenders by minimizing execution risk fears in M&A.
In a recession, URI will dial back capex, buy back more shares, and potentially refi more expensive debt and look for acquisitions.
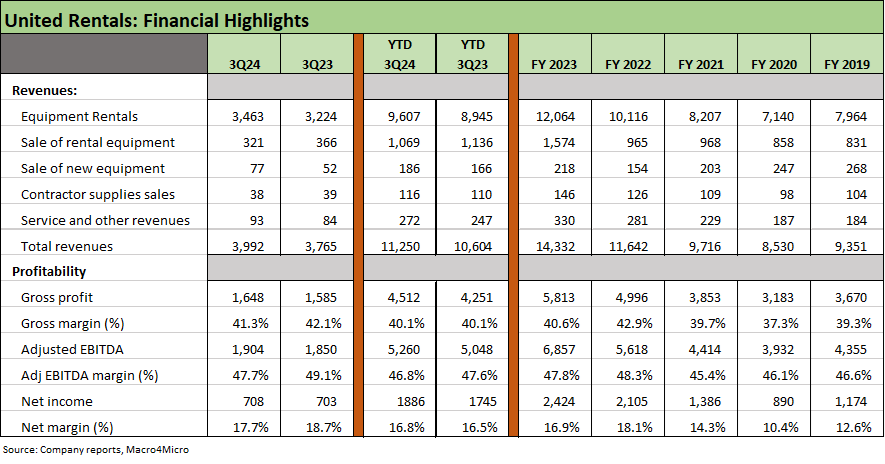
URI reported record 3Q24 numbers and reaffirmed midpoint guidance on all its metrics (revenue, EBITDA, and net rental capex) while narrowing the guidance range. The strong YTD performance follows record FY 2023 numbers. As detailed in the table, URI keeps posting higher levels of revenues and earnings on M&A and sustained organic growth with its robust capex program. The expectation of record 2024 numbers is still in the guidance.
URI saw some mild EBITDA margin compression to 47.7% during 3Q24 but generated record EBITDA for the quarter with EBITDA higher in 3Q24 and YTD 3Q24. The mild compression was attributed to investments URI was making in various innovation investments the company discussed on its earnings call such as automation and new technology features.
Equipment leasing at its core is about managing a large, diverse fleet of earning assets and servicing a highly diverse customer base through an extensive network of locations primarily across North America with a small market presence in Europe and Australia/New Zealand.
High gross margins and EBITDA margins feed the free cash flow story that is the anchor supporting URI’s favorable reception in both the equity and debt markets.
URI continues to post record revenue and earnings on a combination of organic expansion (fleet capex, “cold starts”) and a sustained, successful M&A program that has become a routine part of history at URI across the cycles. Execution risk is seen as much diminished after so many successful, accretive deals. Billion-dollar deals are routine.
The flow of deals over the past two years has been consistent with URI’s historical approach to acquisitions. The most recent billion-dollar acquisition was Yak Access for $1.2 bn in a transaction that was immediately accretive to earnings. Yak represented a new initiative in URI’s fleet mix and offered more rental opportunities to new customers on more projects.
At the end of 2022, URI acquired Ahern Rentals (a Top 5 rental operator) for $2 billion in cash in what was just the latest in a long history of easily financed deals absorbed into a company with a recent market cap of over $56 bn (11-13-24).
Recent presentations by the company point at “aspirational targets” by 2028 of $20 bn in total revenue with $7 bn in Specialty Revenues, and $10 bn in Adjusted EBITDA.

The segment breakdown of General Rentals (“GenRent”) and Specialty does not do justice to the nuances of the market range and expansive verticals and equipment types in the URI mix, but the breakdown of GenRent vs. Specialty does hammer home that pricing power and margins run the range across various equipment types.
Specialty revenues rose by 24% in 3Q24 and 15% excluding the Yak deal. The Yak deal closed on March 15, 2024. The higher margins and strong growth rates of Specialty could face more headwinds in 2025 given the challenge of sustaining such high growth rates. The pipeline of megaprojects offers solid tailwinds and promises a high rate of activity even if some markets see challenges over time. Project categories could see capital budgeting decisions revisited in some areas such as EVs while growth in energy infrastructure is more promising again with GOP policy priorities.
The equipment leasing sector benefits from the increased complexity of equipment and the more tech-centric and connected nature of the fleet since that requires expertise and servicing where customers can reduce unit costs in personnel. They also can mitigate downtime risk on equipment problems through use of leasing. Problems with the equipment can be quickly dealt with or replaced by the local URI branch.
Leasing eases the balance sheet challenges for equipment users and mitigates the risks of rising financing costs by allowing equipment users to deal with a company that benefits from equipment purchasing power and its ability to purchase fleet on a large scale with cost effective financing.
URI has reiterated that lower margin equipment categories can generate very high ROICs and underscores that fleet optimization is about a lot more than expanding the mix of the highest price and highest margin equipment categories.
The ability of URI to win business with large multiyear projects enhances the ability to include wider ranges of equipment types from high margin to low margin and generate strong utilization levels and returns.
URI details fleet productivity stats each quarter capture the combined effects of rental rates, fleet utilization, and equipment mix. The mid-single digit rise in fleet productivity is down from the double digits of 2Q21 to 2Q22 but improved from slightly negative in 2Q23 and 3Q23 with low single digits in 2024. The +3.5% handle productivity in 3Q24 ran alongside YoY rental revenue growth of +7.4% (+5.8% for owned equipment), which marks a material slowing from the double-digit YoY rental revenue growth from 2Q21 to 4Q23 as projects ramped up.
Leverage is very much contained even with all the debt-financed M&A deals as rising revenues and discretionary cash flow before capex leaves URI ample room to be opportunistic in trading off acquisitions vs. buybacks as URI grew both sides of its balance sheet.
The flexibility to optimize growth capex and stock buybacks vs. M&A gives URI management room to maneuver and now has added dividends to the mix as of 2023.
The guidance for over $2 bn in free cash flow (after capex) in FY 2024 highlights how much room URI has to trade off distributions to shareholder vs. deployment to more growth via M&A or even more capex. URI can adjust to cyclical realities.
A notable strength of URI is the ability to execute billion and multi-billion-dollar cash deals without disrupting credit quality and not disappointing shareholders or bondholders (or credit rating agencies) with poor performance after the deals. The track record in M&A has been exceptional for over two decades now, and the execution risk variable has been reduced based on that historical performance.
Across $5.3 billion in acquisitions in 2017-2018 followed by $1.4 bn in 2021, URI had locked in a healthy share of low coupon bonds that set the stage for steady growth on the other side of the integration process. That was followed by more M&A with $2.3 bn in 2022 and $1.2 bn in 2024.
After all that deal flow, URI ended 2023 at 1.6x leverage, which marked a 5-year fiscal year end low before the 3Q24 uptick to 1.8x. Net debt/EBITDA under 2x even after the Yak and Ahern deals leaves ample room for sustained low leverage in historical context. URI still had ample latitude to execute annual buybacks in the $1bn to $2 bn area without impairing credit quality (almost $2 bn expected to be returned to shareholders in buybacks and dividends during 2024).
For context on the 1.8x leverage, the EV multiple valuation parameters for URI’s mix and scale profile seem to run the range with some decidedly conservative in the 5x area to some in high single digits at 7x to 8x EBITDA for those more positive on the sector’s growth themes. That leverage vs. EV multiple relationship still leaves a lot of franchise value and asset protection to go with the high free cash flow and intrinsic financial flexibility. We would vote with the higher end of the EV multiple range given the history of URI in a small peer group. Herc Rentals would be lower but has been mounting a chase to the leaders as highlighted in the stock chart at the beginning of this commentary.
The use of a $1.5 bn 1L secured bond deal (6% of 2029) to fund the Ahern deal broadened the reach across the bond investor base with an investment grade rating on the 1L bond deal. The 1L bond deal marks another layer in the capital structure to go with its ABL line, 2L bonds (3.875% of 2027), and unsecured bonds.
The capital structure layers tend to force the rating agencies into more differentiated ratings, but the free cash flow fundamentals, franchise value, asset protection, and highly successful history of expansion encourages crossover investors to move down the capital structure to unsecured for the best value in the name.
URI has substantial maturities in bonds every year from 2027 to 2032 (plus $1.1 bn in 2034) along with the Term Loan B 2031. The $4.25 bn ABL matures in 2027, and the $1.5 bn A/R facility in June 2025. The ABL and A/R extensions are routine.

The free cash flow generation lines as detailed across the operating cash flow, capex, and equipment sales offer useful disclosure to understand the dynamics of the active management of the URI fleet across the cycles.
Guidance for net capex in the midrange for 2024 was reaffirmed with around $3.65 bn for gross capex and net capex at the midpoint around $2.15 bn.
The ability of URI to quickly adjust its capex program in the event of macro shocks has been demonstrated over time given the nature of the lead time and how that differs from more capital-intensive capex exposure in cyclical manufacturing. URI can easily adjust.
When looking at the very high EBITDA margins, it is important to keep in mind that maintenance capex is required to sustain the high base of revenues with growth capex on top of that to grow revenues and earnings above that level supported by acquisition activity.
Notable examples of the capex flexibility included the decline in net rental capex from $1.3 bn in 2019 to $103 mn in 2020 during COVID. We also saw the post-crisis net rental capex plunge to $31 mn in 2009 from $360 mn in 2008 and $551 mn in 2007.
The depth of the used equipment markets offers a readily available mechanism to manage down “net capex” with major market shocks in earlier times even allowing for “negative net capex” (i.e., fleet liquidation), which is extremely rare in the history of the industry.
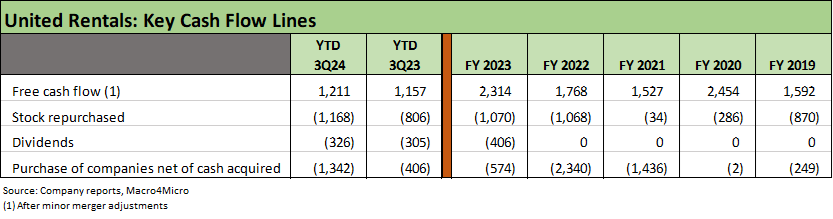
The above chart offers another angle on the cash flow fundamentals of URI by highlighting the stock buybacks and M&A history as cash flow accretive deals are easily financed and usually followed by a brief pause in buyback activity.
URI has posted record cash distributions to shareholders YTD when combining dividends and buybacks (note: the buybacks above include tax withholding for share-based comp). URI initiated its first dividend in 2023 which also served to broaden the shareholder base.
On a YTD basis, URI has distributed almost $1.5 bn to shareholders via buybacks and dividends. The final tally for 2024 is expected to be a record $1.9 bn.
The recent acquisition tempo has picked up pace again in 2021-2024 with $5.7 bn in deals from 2021 to 3Q24 after activity had slowed down in 2019-2020. URI printed acquisitions of $2.97 bn in 2018 and $2.38 bn in 2017. Despite the pace of M&A, URI has 1.8x leverage now with record revenues and record EBITDA.
The main event at URI is expanding the base of earning assets (equipment) and then targeting the proper balance between credit quality and shareholder rewards. This history is a good one in terms of balancing equity performance with stable to improving credit quality across the ebb and flow on M&A and buybacks.
URI should get more credit in its credit ratings for its demonstrated ability to generate such solid and steady growth and free cash flow across the volatility of the cycles since 2007 despite the billions in M&A, a protracted recession after the crisis (longest since the Great Depression), and slow recovery after June 2009 trough, an oil patch crisis, a brutal pandemic, bouts of disruptive supplier chain stress, and the worst monetary tightening cycle since Volcker (that 1980-1982 stagflation double-dip recession and monetary inflation war was much worse).
Highlights and History
United Rentals has been one of the most successful “rollup” stories of the past few decades since its late 1997 IPO and has now grown into the leading equipment rental operator and consolidator. URI is an S&P 500 constituent that is modestly inside the top #200 line in the S&P 500 market cap rankings (Nov 2024).
A cornerstone of the expansion and integration strategies is growth in specialty equipment and cross-selling products and services through its extensive branch network. The ground level contacts with so many customers and equipment types is what makes URI such a great bellwether for nonresidential construction and industrial activity across so many verticals.
As an industry, equipment rental has experienced ongoing consolidation and secular expansion that has allowed rental revenue growth to outpace equipment demand in the shift to leasing in the “lease vs. buy” decision. The top 10 equipment rental operators are up to almost half of industry revenue and half the Top 10 are comprised of United Rentals and Ashtead. The Top 10 share has more than doubled since 2010.
The two largest operators, United Rentals (15% market share in North America in 2023) and Ashtead (Sunbelt brand, 11% share), have been pulling away from the pack as URI rolled up and consolidated multiple competitors. Herc Rentals (HRI) 4% share, Home Depot (2% share) and H&E Equipment Services (ticker HEES) at 2% share round out the Top 5.
As of late 2024, URI had 1666 branch locations with 1571 in North America, 56 in Australia/New Zealand, and 39 in Europe with 673 high margin Specialty Branch locations. The Specialty business has generated over 24% CAGR Revenue growth from 2013 to 2023. Specialty revenue for 3Q24 amounted to just under 1/3 of total segment revenues.
For URI, the mix of end markets across the various broad categories include Nonresidential Construction (Public and Private) at 46% of 2023 revenues, Industrial & Other at 49%, and Residential at 5%. These markets offer room for substantial growth while the industry groups are far-ranging across Power/Utilities, Manufacturing, Oil & Gas, Metals/Mining, Chemicals and others.
The major project waves in construction tell a big part of the growth story (see Construction Spending: A Brief Pause? 9-3-24, Construction Spending: Demystifying Nonresidential Mix 5-9-23) as an expanding economy and favorable demographics drive sustained growth in fixed investment and a high rate continued economic activity (see Fixed Investment in 3Q24: Into the Weeds 11-7-24).
URI had announced an LBO in July 2007, but Cerberus pulled the plug on the deal in light of the unfolding credit crisis with URI losing its case in court to enforce the deal. That was a very fortunate miss on the LBO given how well URI performed in the post-crisis ZIRP environment as it continued to aggressively expand through M&A and organic growth.