
Footnotes & Flashbacks: Asset Returns 4-21-24
Asset risks saw the Middle East avoid a spiral (for now), Tech/Mag 7 was smacked, UST moved against duration, and oil declined.


RasPUTIN is unhappy with his minions on Ukraine.
The week ended with all 6 bond ETFs in negative range while the NASDAQ was beaten down to the 2nd to last spot in the return rankings of the 31 benchmarks/ETFs we watch.
The UST making another adverse shift for the week with credit spreads slightly wider and in double digits for HY.
The S&P 500, the Equal Weighted S&P 500 ETF (RSP), Midcaps, and Small Caps were all in the red on the week with winners including Base Metals (DBB) on top and financials and defensive sectors in the top quartile as some earnings reports reassured after a rough prior week.
Oil ended the week at an $83 handle for WTI after closing last week over $85 as the Strait of Hormuz remains open for (risky) business after a very measured response from Israel to the Iranian rocket and drone attack.

The above chart updates the top-down debt and equity benchmarks we follow each week. Last week we saw the running 1-month return all negative for a shutout, and we see another shutout for the running 1-month this week. NASDAQ has now fallen into the negative zone for the running 3 months, joining the duration sensitive IG Corporate index and UST index. The NASDAQ “worst weekly performance since 2022” led the headline closeouts on the week. The UST curve still drove IG bond and UST across the line into the negative zone for 3 months with a very slight negative on NASDAQ for 3 months.
The market commentary Friday made the case on the bad tech news with $950 billion shaved off the Magnificent 7, the NASDAQ off by -5.5 % on the week, and NVIDIA slammed on Friday (-10%). As we cover below in the ETF section, we saw the Tech ETF (XLK) dead last at -6.3% on the week and the NASDAQ 2nd to last.
On a positive note for the civilized world, weekend legislation approved aid to Ukraine on Saturday along with support for Israel, Taiwan, and some humanitarian aid packages for war zone victims. Ukraine munitions support, which was opposed by some of the more extreme Trump brownnoser (and Brownshirt) elements of the GOP hardliners, passed by a wide margin.
The fact that the House actually brought the bill to the floor for a vote was a good piece of democratic (small D) functionality as House Leader Mike Johnson threw job safety caution to the wind. Just having a vote was a positive action in what is becoming a Washington operating like an “asterisk democracy.”
The losing voters on Ukraine can take solace in the fact that hundreds of Ukrainians were likely killed as a direct result of their actions and delays while territory was lost, so it was a not a total loss for the MTG-led pro-Putin brain trust. They can still pray for Putin on Sunday in whatever passes for their Christian practices (heavy on the darker side of Revelation, light on Matthew and Luke). Mass murdering dictators need a good prayer.

The above chart updates our 1500 and 3000 series with bad news still the trend line for the trailing 1-month with 5 of 6 in negative range. Energy was still positive but losing some ground as the risk symmetry on the Mideast shifted. Now that the line has been crossed on direct strikes on Israel and Iran, the world is in a different place. The same guesswork and speculation will rule the decisions on the right risk premium in oil.
The rolling return visual
In the next section we get into the details of the 31 ETF and benchmarks for trailing periods. Below we offer a condensed 4-chart view for an easy visual before we break out each time period in commentary further below.

In looking at the above chart collection, the easy conclusion for 1-week and 1-month is that asset return trends have turned negative even with some fairly constructive earnings reports continuing to stream out. The returns are not helping the FOMC story at this point any more than the direction of the macro releases as we have discussed in our inflation and economic commentaries (see links at bottom).
We see the 3-month period starting to fade but still weighted toward the positive side after moving past what was a major 2-month rally in Nov-Dec that saw winners in most all categories (see Footnotes & Flashbacks: Asset Returns 1-1-24 ). The inflation anxiety seen after strong macro indicators in August and Sept 2023 set off some turmoil that saw rates peak in the third week of October. The market will get back to wrestling with whether this is a replay or the start of bigger problems as the pace and scale of FOMC cuts get pushed out in the handicapping exercise.
That was a dazzling Nov-Dec rally in rates and risk, so there are still plenty of debates to have on what a correction might signal. The operating fundamentals in earnings season are coming up constructive enough for many cyclical industry groups, and the consumer has not slowed down that much.
We get a wave of consumer heavy releases this week in addition to the PCE release and the first 1Q24 GDP numbers. We just had another week of solid housing metrics, and auto OEM earnings (GM, Ford) this week along with a wave of auto retailers. That should add some useful color on another big-ticket consumer sector and how rates are weighting on new vs. used cars.
The Magnificent 7 heavy ETFs…
Some of the benchmarks and industry ETFs we include evidence issuer concentration elements that leave them wagged by a few names. When looking across some of the bellwether industry/subsector ETFs in the rankings, it is good to keep in mind which narrow ETFs (vs. broad market benchmarks) get wagged more by the “Magnificent 7” including Consumer Discretionary (XLY) with Amazon and Tesla, Tech (XLK) with Microsoft, Apple, and NVIDIA, and Communications Services (XLC) with Alphabet and Meta. The biggest Mag 7 problem child this year has been Tesla in the XLY ETF with TSLA at -14.9% YTD. The other Mag 7 name in the red YTD is Apple -14.3% YTD Friday.
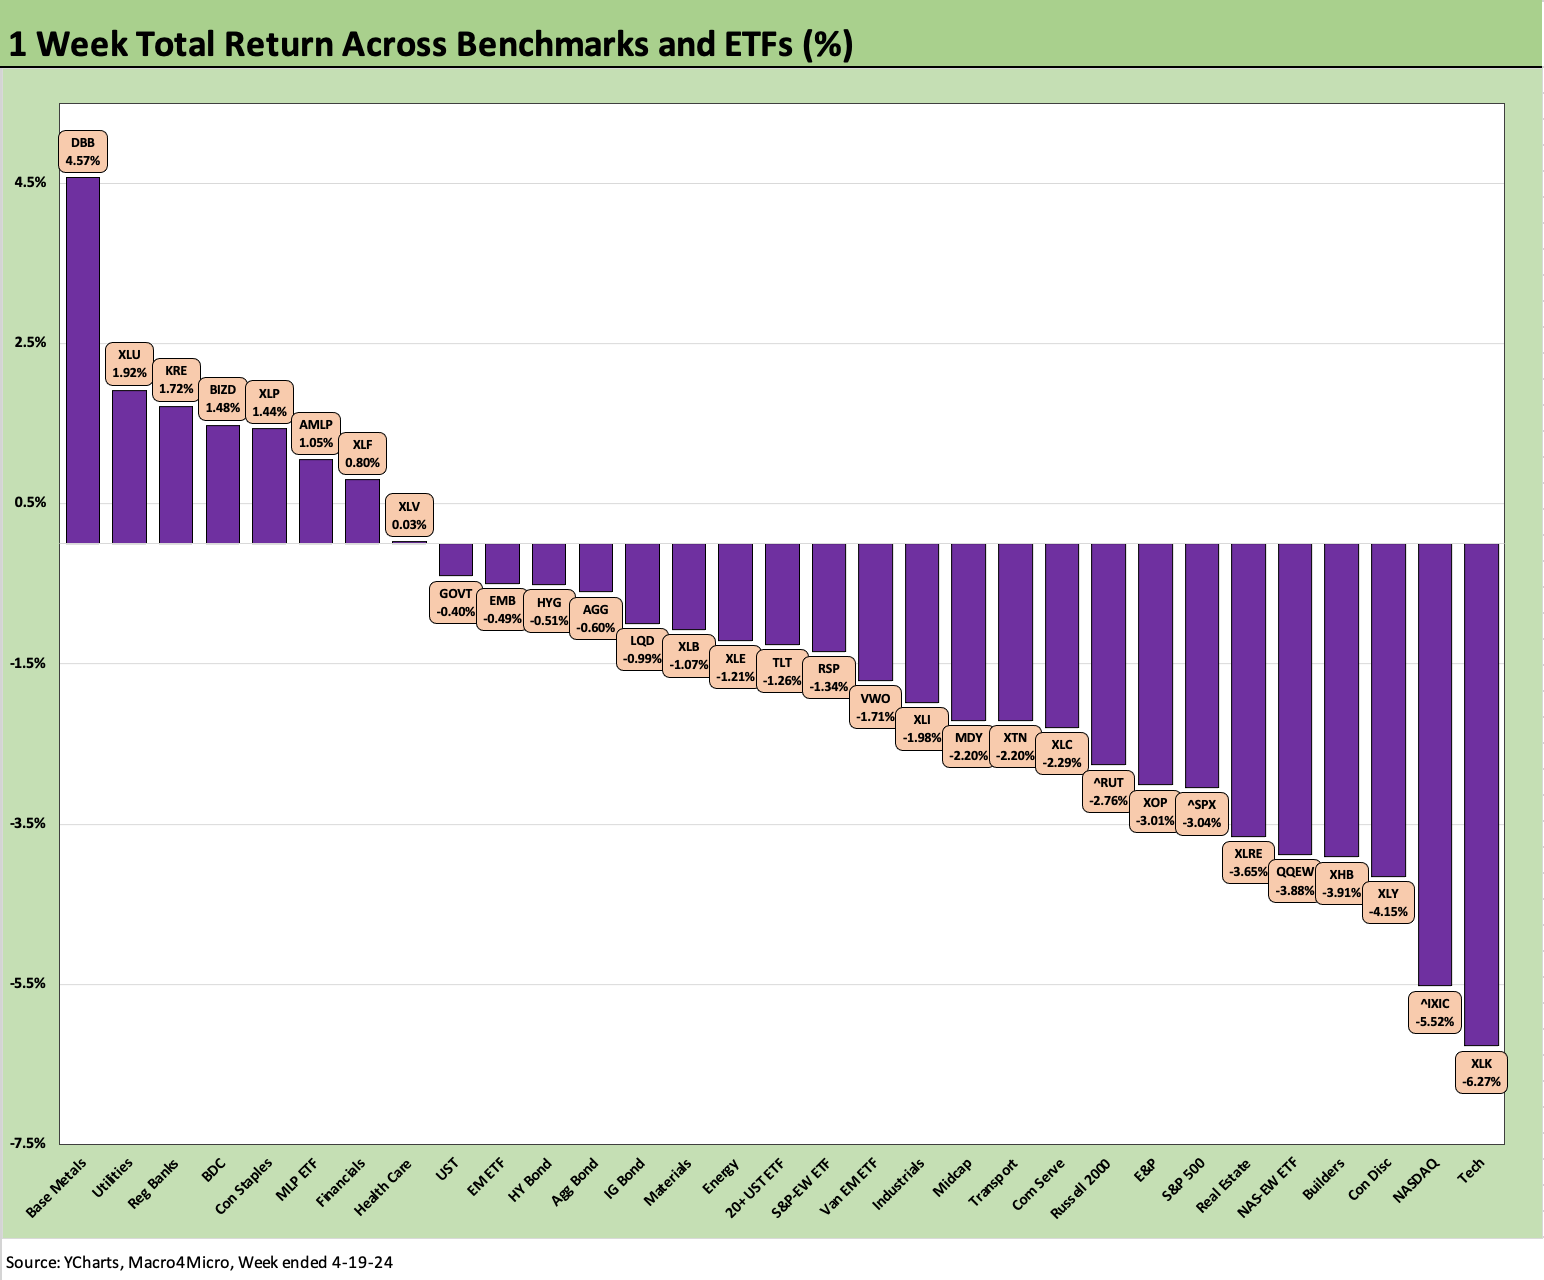
Last week the group of 31 saw a 1-30 score for the worst positive-negative score of the year. This week rings up at 8-23. We see a Hi-Lo range just under 11 points between Base Metals (DBB) and Tech (XLK) vs. last week’s 6 points. The market clearly had a few big macro events (war threats) and micro level action (earnings, inflation, and consumer metrics) to deal with.
We see all 6 bond ETFs in the red in the upper tiers of the 23 benchmarks/ETFs in the red. The mix of positive returns was diverse below the #1 Base Metals ETF (DBB) with the financial sector making a comeback in Regional Banks (KRE) and Financials (XLF) on some better earnings reports this past week.
Defensive sectors on risk such as Utilities (XLU) and Staples (XLP) held in well despite their role as interest sensitive sectors with low yields. War was more important this past week as a risk, but that settled down (for now). The resilience of BDCs continues to be in evidence with a low FOMC chance of easing supporting floating rate assets and a credit cycle that is showing legs.
The Tech ETF (XLK) came in dead last with NASDAQ 2nd to last. We see the Consumer Discretionary ETF (XLY), Homebuilding (XHB), and the NASDAQ 100 Equal Weighted ETF (QQEW) in the bottom 5. That is a new look for tech and Mag-7-heavy ETF returns after those sectors had so many strong weeks in recent months.
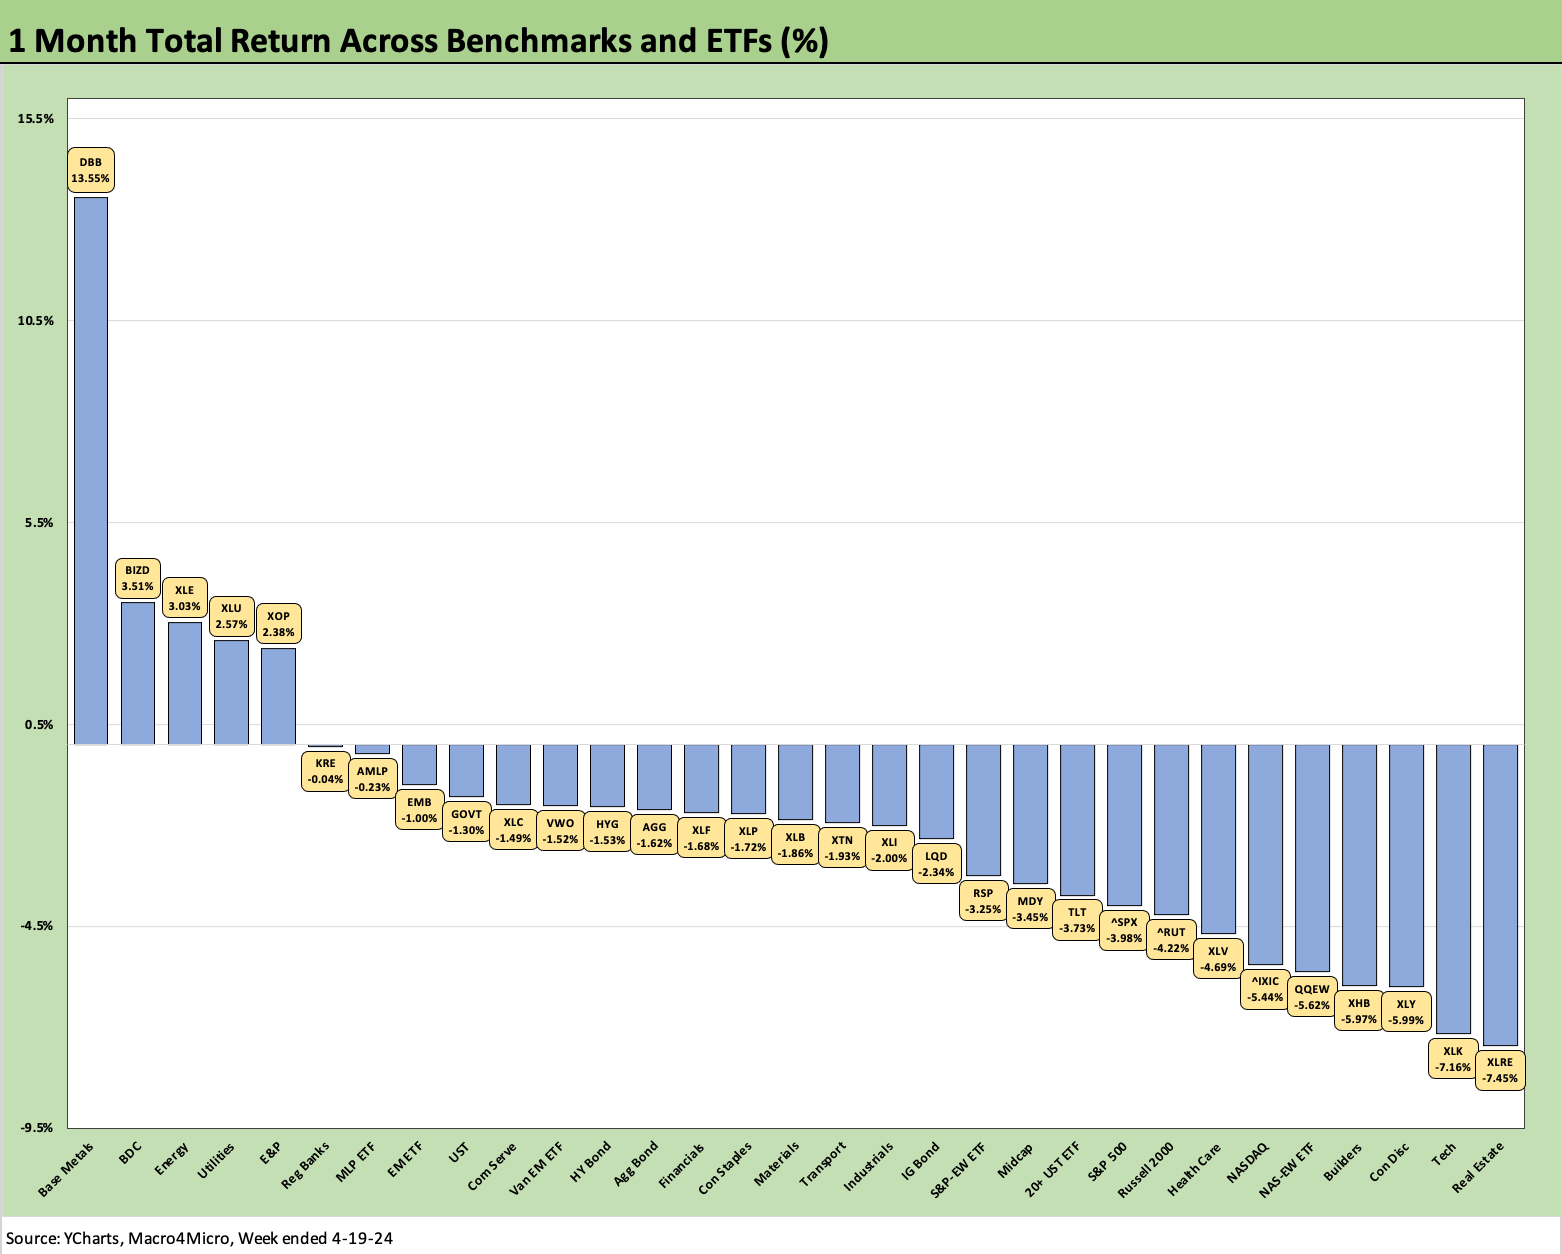
The 1-month score weakened to 5-26 this week from 7-24 last week with the Tech ETF (XLK) only slightly better than the Real Estate ETF (XLRE) at -7% handles over in the bottom of the rankings. We see a Hi-Lo range this week of 21 points for the trailing 1-month, up from just over 16 points in last week’s edition.
The strength in commodities markets lately spreads across metals to oil over the past month, and we see DBB along with the Energy ETF (XLE) and E&P (XOP) in the top 5. BIZD is hanging in well ahead of earnings reports at #2 as floating rate secured debt still promises high cash income flows during an amenable stage of the credit cycle.

The 3-month score is getting whittled down to 19-12 from 23-8 last week. We see 4 of 6 bond ETFs in the red but with the High Yield ETF (HYG) barely on the positive side of zero. The Hi-Lo range on returns from the #1 asset to the last place line item over 3 months is 26.5 points.
In the bottom of the ranks, we see Real Estate (XLRE) in last place just below Regional Banks (KRE) and the long duration 20+ Year UST ETF (TLT) third from the bottom. The Tech ETF (XLK) and NASDAQ 100 Equal Weighted Index ETF (QQEW) round out the bottom 5 with the Consumer Discretionary Index just above that as Tesla get pummeled as one of its larger constituents.
The winners over 3 months are on the commodity side of the ledger with E&P (XOP) at #1, Energy (XLE) at #2, and Base Metals (DBB) at #3, Midstream Energy (AMLP) at #4, and Materials (XLB) at #5.
The asset return mix shift over 3 months appears more about the FOMC and UST rates and tech equity valuation parameters than fears around the sustainability of the economic cycle. Industrials (XLI) are also in the top quartile along with Financials (XLF). That is not a worrisome mix around critical cyclical markets and perception of forward asset quality in banks, but the market is raising questions around tech valuations that spent a year running hot. In financials, regional banks will remain a worry on commercial real estate, but the broader financial subsector mix has been solid enough.

It takes a lot to dent those running 1 year returns with only 5 of 31 in negative range at 26-5 favoring positive. Bond ETFs comprise 3 of the 5 line items in the red with interest rate sensitive Utilities ETF (XLU) and Real Estate (XLE) rounding out the bottom 5. In the bottom quartile, TLT sits in last place with GOVT, AGG and LQD showing the UST effects on duration for the LTM period.
See also:
Housing Starts March 2024: The Slow Roll and Ratchet 4-16-24
Industrial Production: A Healthy Sideways 4-16-24
Retail Sales March 2024: Until You Drop 4-15-25
Footnotes & Flashbacks: State of Yields 4-14-24
Footnotes & Flashbacks: Asset Returns 4-14-24
Consumer Sentiment: Do You Think Scary Thoughts 4-12-24
CPI March 2024: The Steeplechase Effect 4-10-24
Credit Markets Across the Decades 4-8-24
Credit Cycles: Historical Lightning Round 4-8-24
Payroll March 2024: Payroll Spike Brings a Political Theme Shift 4-6-24
JOLTS Feb 2024: Steady and Sideways 4-2-24
PCE Prices, Personal Income & Outlays: Sideways Tone 3-29-24
4Q23: Final Cut, Moving Parts 3-28-23
Durable Goods: A Small Boost for Manufacturing Sentiment 3-26-24