
Footnotes & Flashbacks: State of Yields 12-29-24
We see another bear steepener as the 10Y UST remains stubborn.


Tariff planning committee reviews analytical methodology…
We saw another move slightly higher on the long end this past week as duration stays under pressure and bond funds keep feeling the performance headwinds.
The UST need to borrow and rising debt will hit record levels in 2025, and there is little to reassure on supply-demand balances in clearing the market at lower levels until there is some clarity on what Trump has in mind for his tariff policies and the scale of the deportations and how that flows into price and wage impacts.
The debt ceiling debate should lead to some GOP family feuds while cabinet and nominee hearings should smoke out something resembling a set of policy views.

The UST migration pattern has been fairly consistent of late as the UST curve rolls in the steeper slope patterns from a combination of a lower short end and higher long end. The loser has been duration while the stock market has been reassured on the potential for more easing even if slower than anticipated.
The above chart updates the current UST rates in the context of past cyclical transition periods starting with the Carter inversion of 1978 and then on across the 1980 Volcker period, the 1989 credit cycle peak, the 2000 move into a TMT default cycle, and then the 2006 housing bubble turn.
We consider the pre-crisis cycles before the ZIRP and QE bailout years as more representative of what even a semi-normal monetary backdrop looked like. We plot the 10-19-23 UST curve as the 10Y UST peaked, and inflation was turning before the easing started in Sept 2024 to the point where the UST curve sits now.

We update the running UST curve migration since the 10Y UST peak of 10-19-23 ahead of the monster duration rally of Nov-Dec 2023. The 2024 pattern saw a long lead time to the first FOMC easing (Sept 2024) to wrap the year with “4” fed cuts (as in 4 x 25 bps) across 3 actions.
The YTD UST action in 2024 remains quite distinct from the consensus expectations from this time last year, which called for more cuts and flatter and lower beyond 2Y UST. Beyond 2Y UST, we now instead see steeper and higher.

The above chart offers a sobering reminder of the perils of prophecy in such an unusual period of history for the UST curve and radical policy actions on the immediate horizon. The borrowing needs just to fund the interest expense bill gets a lot of attention as does the plan to cut revenue while also spending more. The potential alienation of massive international UST holders (notably China) and threats of more de-dollarization cannot simply be ignored.
The distraction of the DOGE story line as a major offset used by whiteboard story tellers is going to be a hard sell to the UST market (Federal outlays ex-defense is not a big line to begin with given deficit spending plans). Most growth estimates we see so far show a consensus of slower GDP growth in the US in 2025, and that is without even factoring in more extreme outcomes in the context of tariffs and deportation uncertainties.
It gets hard to see how record UST supply, record deficits, slower growth, lower taxes and more likely than not materially higher defense spending needs will add up to more optimism around the economy walking hand in hand with lower UST rates out the curve.
If we look back to 2018-2019 and the big trade and tariff battles (the next round will be much more aggressive), the facts of those years are very different from the faded memories (see HY Pain: A 2018 Lookback to Ponder 8-3-24, Histories: Asset Return Journey from 2016 to 2023 1-21-24). Tariffs going smoothly in support of sustained economic growth rings hollow and inconsistent with the 2% handle average of GDP in 2017-2019.

The above chart updates the 1-week UST deltas that we already looked at in the Mini Market Lookback: Last American Hero? Who wins? (12-29-24). Bondholders cannot fight bond math tied to the UST curve but also start the year with spreads at historical credit peak lows.
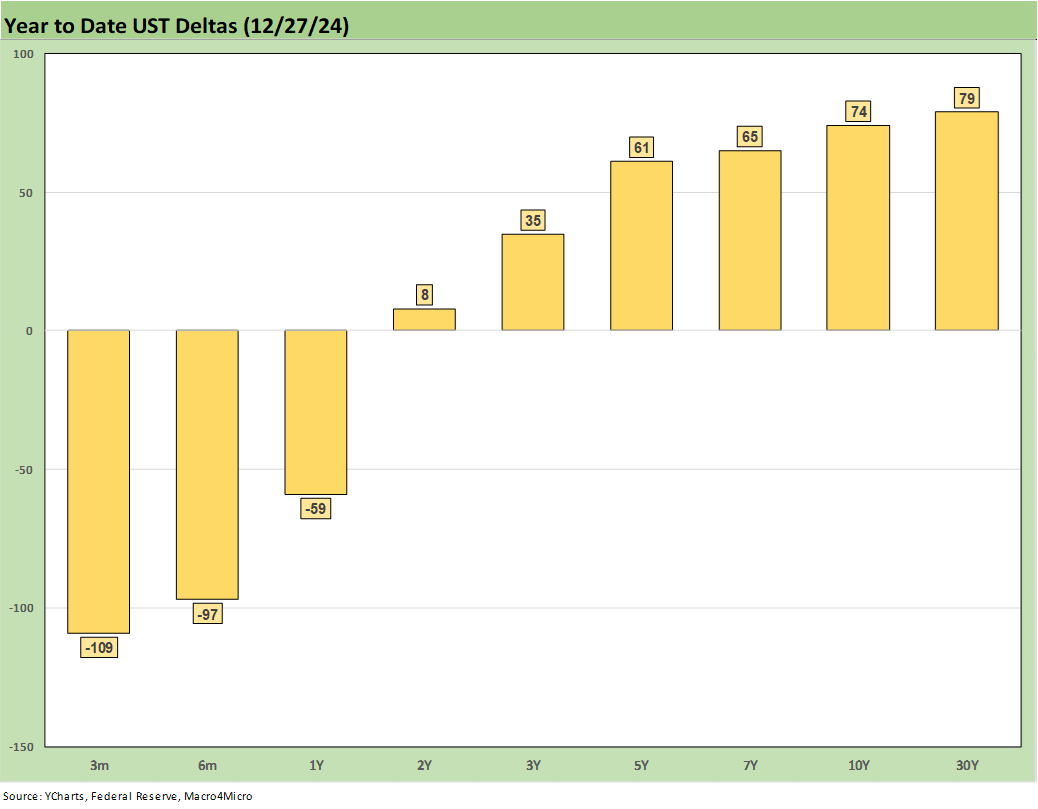
The above chart plots the YTD bear steepener beyond the 2Y UST. The bull steepener inside 2Y UST has been fed by FOMC easing and the sustained belief that there will be more of the same in 2025. Duration risk ruled in bond returns in 2024, and the UST market has been a headwind framed against the tailwind of slowly repricing coupons and tighter spreads.

The above chart updates the running rally from the peak of the UST 10Y in Oct 2023 that started the impressive rally of Nov-Dec 2023 and set the stage for so much optimism on the UST curve heading into 2024.
As the crow flies, it is a bull steepener from Oct 2023, but the long end got bearish and steeper in 2024 as the economy stayed strong and labor markets near full employment levels even with declining inflation rates.

The above chart updates the Freddie Mac 30Y benchmark (released noon Thursdays), and we also include (horizontal lines) the Freddie Mac rates for two key periods in housing market history. We include the end of 2005 as the peak year for homebuilding and a mid-2006 date to mark the period when RMBS cracks were showing up from subprime excess and a breakdown in the mortgage models used in credit ratings.
We also include UST curves from each of those dates. As of now, the recent mortgage rates are the highest of the three with the UST curve of June 2006 the highest and the 2005 10Y UST the lowest.

The above chart updates the 2Y to 30Y UST slope since 1984 with the long-term median. We also include the other UST segment slopes we like to watch. The 2Y to 30Y at +51 bps is at least back in upward sloping mode. The search for term premiums at last has positive numbers to work with now but remain very low vs. history.

The short timeline zeros in on the 2Y to 30Y slope from Jan 2021 back when ZIRP ruled the curve on the front end and the COVID vaccine was in rollout mode and driving demand – and supply-demand imbalances.
The peak steepness in 2021 reached +229 bps on the way to the peak inversion of -117 bps in March 2023 (just before the regional bank mini panic). Then it whipsawed to -2 bps in May 2023 as the UST rallied and then a fresh trip back to -107 bps in July 2023.
The challenge to get a bullish view on 10Y and 30Y UST is rooted in pre-crisis history as noted in the earlier charts across the cycles. The massive borrowing needs of the UST (supply), the relative lack of term premium, and legitimate debates on what tariffs will mean for prices all factor into a high hurdle in getting long UST rates lower.
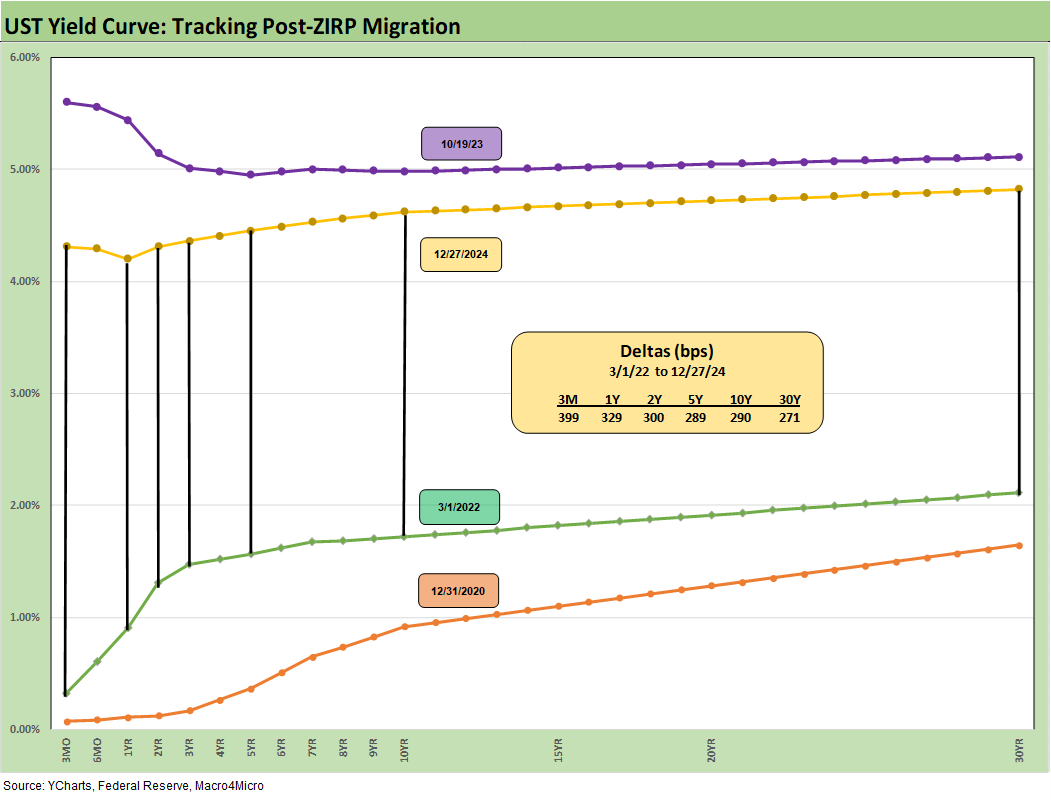
We wrap with our usual closing chart that breaks out the running UST deltas from March 1, 2022 just ahead of the end of ZIRP and first hike (effective March 17, 2022). We see the bear move from 12-31-20 to the 10-19-23 and now back to the Friday close. We are clearly much closer to the 10-19-23 peak in longer maturities than the March 2022 beginning of tightening.
Contributors:
Glenn Reynolds, CFA
Kevin Chun, CFA
See also:
Mini Market Lookback: Last American Hero? Who wins? 12-29-24
Spread Walk: Pace vs. Direction 12-28-24
Annual and Monthly Asset Return Quilt 12-27-24
Credit Returns: 2024 Monthly Return Quilt 12-26-24
New Home Sales: Thanksgiving Delivered, What About Christmas? 12-23-24
Footnotes & Flashbacks: Credit Markets 12-23-24
Footnotes & Flashbacks: State of Yields 12-22-24
Footnotes & Flashbacks: Asset Returns 12-22-24
Mini Market Lookback: Wild Finish to the Trading Year 12-21-24
Trump Tariffs 2025: Hey EU, Guess What? 12-20-24
PCE, Income & Outlays Nov 2024: No Surprise, Little Relief 12-20-24
Existing Home Sales Nov 2024: Mortgage Vice Tightens Again 12-19-24
GDP 3Q24: Final Number at +3.1% 12-19-24
Fed Day: Now That’s a Knife 12-18-24
Credit Crib Note: Iron Mountain 12-18-24
Housing Starts Nov 2024: YoY Fade in Single Family, Solid Sequentially 12-18-24
Industrial Production: Nov 2024 Capacity Utilization 12-17-24
Retail Sales Nov24: Gift of No Surprises 12-17-24
Inflation: The Grocery Price Thing vs. Energy 12-16-24
Toll Brothers: Rich Get Richer 12-12-24
CPI Nov 2024: Steady, Not Helpful 12-11-24
Mini Market Lookback: Decoupling at Bat, Entropy on Deck? 12-7-24
Credit Crib Note: Herc Rentals (HRI) 12-6-24
Payroll Nov 2024: So Much for the Depression 12-6-24
Trade: Oct 2024 Flows, Tariff Countdown 12-5-24
JOLTS Oct 2024: Strong Starting Point for New Team in Job Openings 12-3-24
Mini Market Lookback: Tariff Wishbones, Policy Turduckens 11-30-24
3Q24 GDP Second Estimate: PCE Trim, GPDI Bump 11-27-24
New Home Sales Oct 2024: Weather Fates, Whither Rates 11-26-24
Credit Crib Note: Ashtead Group 11-21-24
Credit Crib Note: United Rentals (URI) 11-14-24
Fixed Investment in 3Q24: Into the Weeds 11-7-24
Select Histories:
Mexico: Tariffs as the Economic Alamo 11-26-24
Tariff: Target Updates – Canada 11-26-24
Tariffs: The EU Meets the New World…Again…Maybe 10-29-24
Trump, Trade, and Tariffs: Northern Exposure, Canada Risk 10-25-24
Trump at Economic Club of Chicago: Thoughts on Autos 10-17-24
HY OAS Lows Memory Lane: 2024, 2007, and 1997 10-8-24
Credit Returns: Sept YTD and Rolling Months 10-1-24
HY Industry Mix: Damage Report 8-7-24
Volatility and the VIX Vapors: A Lookback from 1997 8-6-24
HY Pain: A 2018 Lookback to Ponder 8-3-24
Presidential GDP Dance Off: Clinton vs. Trump 7-27-24
Presidential GDP Dance Off: Reagan vs. Trump 7-27-24
The B vs. CCC Battle: Tough Neighborhood, Rough Players 7-7-24
HY Spreads: Celebrating Tumultuous Times at a Credit Peak 6-13-24
Credit Markets Across the Decades 4-8-24
Credit Cycles: Historical Lightning Round 4-8-24
Histories: Asset Return Journey from 2016 to 2023 1-21-24
Credit Performance: Excess Return Differentials in 2023 1-1-24
Return Quilts: Resilience from the Bottom Up 12-30-23
HY vs. IG Excess and Total Returns Across Cycles: The UST Kicker 12-11-23
HY Multicycle Spreads, Excess Returns, Total Returns 12-5-23
US Debt % GDP: Raiders of the Lost Treasury 5-29-23
Wild Transition Year: The Chaos of 2007 11-1-22
Greenspan’s Last Hurrah: His Wild Finish Before the Crisis 10-30-22