Mini Market Lookback: Last American Hero? Who wins?
The week was favorable in equities, but bonds keep limping home to wrap 2024.
Will 2025 be about Silicon Valley or NASCAR?
Note to readers: For our full “Footnotes publications on Asset Returns and Credit Markets, we will wait for the final 12-31-24 data. Herein, we include our Mini Lookback for the week ended 12-27-24. We will post the State of Yields later today.
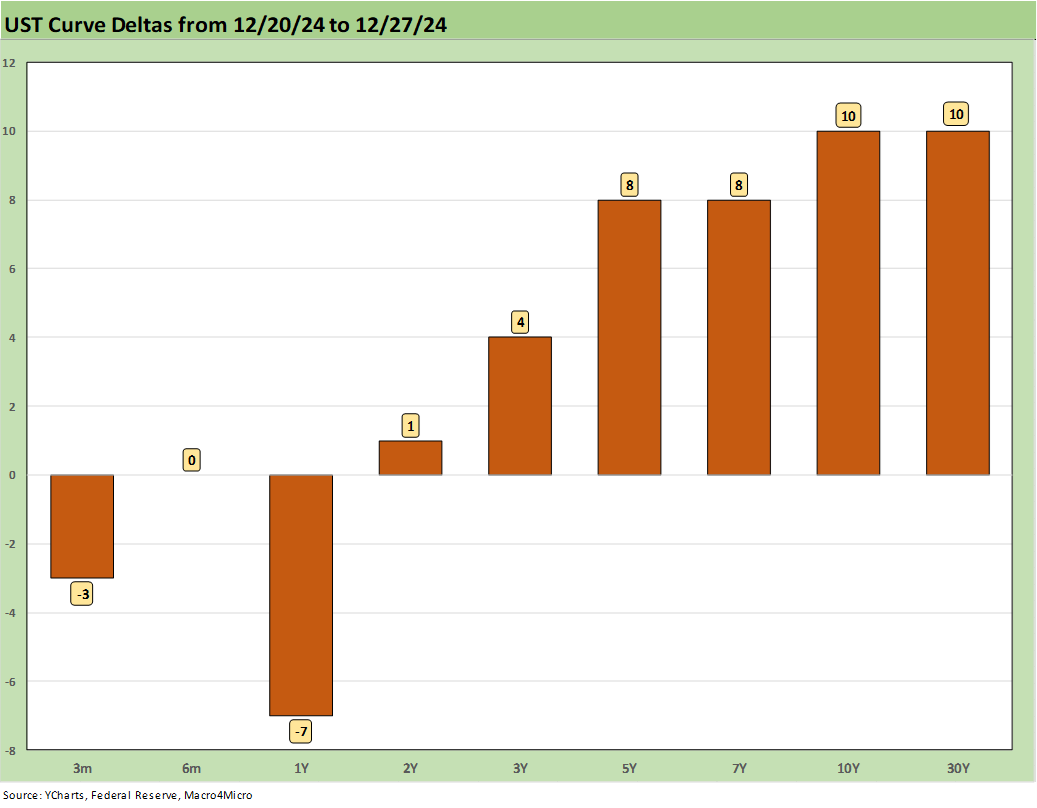
The week saw a mild comeback in equities with benchmarks higher but small caps only barely positive. Meanwhile, UST struggles continue with another bear steepener beyond 2Y UST and 6 of the 7 bond ETFs we track in the red.
Holidays kept life slow and simple in credit markets with spreads barely moving but netting out to slightly positive as investors, underwriters and market makers gear up for an uncertain 1Q25 as policy visibility gets some clarity after “Day 1” arrives.
The policy and economic dramas for the week move beyond the pending invasion of Panama and Greenland and annexation of Canada (I think I mean to be sarcastic but then again…) to an undercard of Tech Bros vs. NASCAR in the H-1B debates on high end immigration acceptability. That featured Musk insulting the MAGA crowd and Ramaswamy describing the mediocrity of American culture (via TV series), pitting Team Silicon Valley against the red meat of the MAGA lineup.
The focus on Trump’s recent “180” on H-1Bs and TikTok could signal some alliance game plan with “Big Tech” or a more rational economic view to bolster the US push for supremacy in all things tech (and tech applications to military) and support for equity markets. Extrapolating that reversal on these issues into the potential for a more economically rational set of tariff policies is for the half-full vs. half-empty crowd.
The movie picture used above includes an early Jeff Bridges as the Last American Hero. In a sign of age, that was from a 1973 movie I saw when it came out in theaters. One of the sideshows that seemed to be on the screens this week was the NASCAR crowd (and most vocal MAGA Meatheads such as Loomer et al.) in heated social media battles with the H-1B advocates (Musk, Ramaswamy). NASCAR seemed relevant in the scramble for MAGA hero status.
Trump 2.0 US ambitions include a desire to be the globally dominant player in tech and military might (those two overlap) and the lead player in oil & gas and the tech-intensive E&P business (and for some – not Trump – clean energy). That means there is plenty of room for MAGA residents at sea level and for the H-1B fans in the mansion or penthouse.
The US will need the tax base and maximized growth potential in tech…
The 60% of the GDP (per Brookings) that voted blue at the county level in the 2024 “mandate” also has a big stake in the H-1B issue if the tax base and tech-and-engineering intensive manufacturing sectors are to make the desired comeback. Given the Trump deficits plan (admitted or otherwise), an expanding economy and tax base will be needed for the income tax exporting states (heavily blue) to keep subsidizing the red states with their Federal income tax contributions. The coding jobs are not being recruited at the tailgating gathering ahead of the “Friday Night Lights” game.
The booming tech, defense and aerospace businesses in places such as Texas, Kansas, and Alabama, etc., make that ambition for a higher base of skill sets somewhat bipartisan. The risk of skill set shortages could be a very real problem for the next evolution of the US economy. The gross inconsistencies of killing the Department of Education while uncapping limits on H-1Bs is not without its glaringly self-evident stupidity. That tends to confuse the average MAGA land animal.
As we get ready for the arrival of 2025, the economy is in good shape, structural risks (notably in banking) are less than those seen in the last handful of cycles, inflation is stabilized at much lower levels, and payrolls are high with demographics favorable for demand. Perhaps this is not a great time to go rogue on trade in a globally intertwined economy, so the risks can move quickly subject to the judgement of policy makers. The cabinet nominee process will get more dramatic in the weeks ahead, so the noise level will remain high.
The above chart updates the broad mix of debt and equity returns we routinely watch. We line them up in descending order of LTM total returns. We tweaked the line items a bit for this edition, which is usually included in the Weekly Footnotes (note: we will publish the full Asset Return Footnotes commentary with Dec 31 pricing). The table shows a rough 1-month and 3-month timeline for debt while equities have also struggled in December. The 3-month run in equities reflects Fed easing and the initial wave of Trump tailwinds as well as net favorable guidance in earnings season.
The 1-year numbers highlight the banner year for Growth stock benchmarks, S&P 500 Financials, and NASDAQ with each of those weighing in with 30+% returns LTM and the Mag 7 heavy S&P 500 not far behind at over 26%. This past week saw the S&P 500s 11 sectors with 8 positive, one flat, and two negative (Consumer Staples, Materials).
Small caps had a respectable year as well as we already highlighted in our monthly asset return comments posted Friday (see Annual and Monthly Asset Return Quilt 12-27-24). For Midcaps and Small Caps, there was no competing with the overall Mag 7 mix and the benchmarks wagged by such names. The Midcaps (S&P Mid 400) and Small Caps (Russell 2000) are at least in double digits.
For the debt benchmarks, HY came in with a healthy “coupon plus” return just under the long-term return on equities. Less duration exposure, higher coupons, and spread compression carried the day (see Spread Walk: Pace vs. Direction 12-28-24, Credit Returns: 2024 Monthly Return Quilt 12-26-24).
The above chart covers the holiday week results with equities posting a winning week after an otherwise glum Dec for stocks. The positive-negative mix was 23-9 positive for the week ended 12-27-24 vs. 7-25 for the trailing 1-month period (not shown).
For the week, the upper quartile mix was more eclectic led by Energy (XOP at #1, XLE #4), BDCs (BIZD) at #2, Transports (XTN) at #3, Health Care (XLV) at #5 followed by Base Metals (DBB), Financials (XLF), and Tech (XLK). Some of these sectors had been laggards for the 1-month (notably XOP and XLE).
The negative returns for the week include 6 of 7 bond ETFs with the short duration UST 1-3Y ETF barely positive. Homebuilders (XHB) and Materials (XLB) joined the bond ETFs in the bottom quartile.
The above chart updates the tech bellwethers that we line up in descending order of weekly returns. The Mag 7 saw a mixed week with 4 of the 7 lagging the S&P 500 and 2 of 7 (MSFT, AMZN) lagging the Equal Weight S&P 500 ETF (RSP). Broadcom (AVGO) is continuing a strong recent run at #1 for the week and +52% for the 1-month period. MSFT has been the most notable Mag 7 laggard in recent weeks and months.
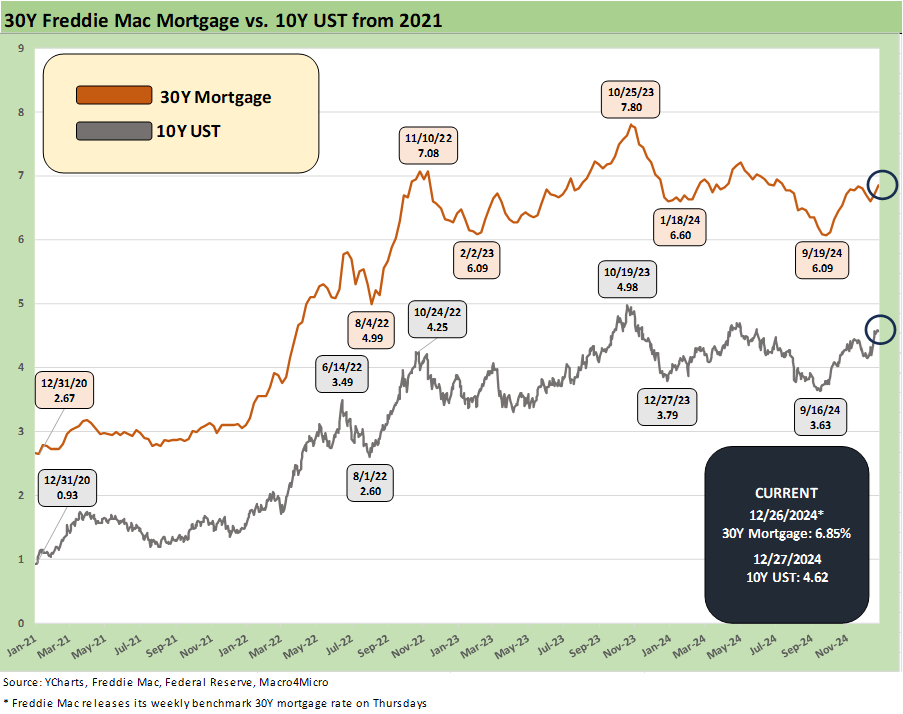
The above chart updates the 1-week UST deltas as the market saw yet another bear steepener of the UST curve beyond the 2Y out to 30Y. The 10Y is not making life easier for 30Y mortgage rates as covered in the next chart.
The above chart updates the Freddie Mac 30Y mortgage benchmark and 10Y UST, and both have been heading in the wrong direction since the Sept lows of 3.6% for the 10Y and under 6.1% for the Freddie benchmark. Freddie lags a range of other indicators in the market that are already at or above 7% with a different mix of mortgage criteria.
The above chart shows a slight -2 bps tightening in the HY index from last week as it remains below the 300 bps line and in a recent price range that has more in common with June 2007 and late 1997 (see HY OAS Lows Memory Lane: 2024, 2007, and 1997 10-8-24, HY Spreads: Celebrating Tumultuous Times at a Credit Peak 6-13-24).
The “HY OAS minus IG OAS” quality spread differential barely moved from last week and edged tighter by -1 bps.
The “BB OAS minus BBB OAS” differential stayed flat on the week at +80 bps, which is comfortably above the Nov 2024 low of +57 bps. Decompression waves can come on fast and Dec saw a small one. We looked at spread walks for 2023 and 2024 as a reminder in a commentary posted yesterday (see Spread Walk: Pace vs. Direction 12-28-24).
Contributors:
Glenn Reynolds, CFA
Kevin Chun, CFA
See also:
Spread Walk: Pace vs. Direction 12-28-24
Annual and Monthly Asset Return Quilt 12-27-24
Credit Returns: 2024 Monthly Return Quilt 12-26-24
New Home Sales: Thanksgiving Delivered, What About Christmas? 12-23-24
Footnotes & Flashbacks: Credit Markets 12-23-24
Footnotes & Flashbacks: State of Yields 12-22-24
Footnotes & Flashbacks: Asset Returns 12-22-24
Mini Market Lookback: Wild Finish to the Trading Year 12-21-24
Trump Tariffs 2025: Hey EU, Guess What? 12-20-24
PCE, Income & Outlays Nov 2024: No Surprise, Little Relief 12-20-24
Existing Home Sales Nov 2024: Mortgage Vice Tightens Again 12-19-24
GDP 3Q24: Final Number at +3.1% 12-19-24
Fed Day: Now That’s a Knife 12-18-24
Credit Crib Note: Iron Mountain 12-18-24
Housing Starts Nov 2024: YoY Fade in Single Family, Solid Sequentially 12-18-24
Industrial Production: Nov 2024 Capacity Utilization 12-17-24
Retail Sales Nov24: Gift of No Surprises 12-17-24
Inflation: The Grocery Price Thing vs. Energy 12-16-24
Toll Brothers: Rich Get Richer 12-12-24
CPI Nov 2024: Steady, Not Helpful 12-11-24
Mini Market Lookback: Decoupling at Bat, Entropy on Deck? 12-7-24
Credit Crib Note: Herc Rentals (HRI) 12-6-24
Payroll Nov 2024: So Much for the Depression 12-6-24
Trade: Oct 2024 Flows, Tariff Countdown 12-5-24
JOLTS Oct 2024: Strong Starting Point for New Team in Job Openings 12-3-24
Mini Market Lookback: Tariff Wishbones, Policy Turduckens 11-30-24
3Q24 GDP Second Estimate: PCE Trim, GPDI Bump 11-27-24
New Home Sales Oct 2024: Weather Fates, Whither Rates 11-26-24
Credit Crib Note: Ashtead Group 11-21-24
Credit Crib Note: United Rentals (URI) 11-14-24
Fixed Investment in 3Q24: Into the Weeds 11-7-24
Select Histories:
Mexico: Tariffs as the Economic Alamo 11-26-24
Tariff: Target Updates – Canada 11-26-24
Tariffs: The EU Meets the New World…Again…Maybe 10-29-24
Trump, Trade, and Tariffs: Northern Exposure, Canada Risk 10-25-24
Trump at Economic Club of Chicago: Thoughts on Autos 10-17-24
HY OAS Lows Memory Lane: 2024, 2007, and 1997 10-8-24
Credit Returns: Sept YTD and Rolling Months 10-1-24
HY Industry Mix: Damage Report 8-7-24
Volatility and the VIX Vapors: A Lookback from 1997 8-6-24
HY Pain: A 2018 Lookback to Ponder 8-3-24
Presidential GDP Dance Off: Clinton vs. Trump 7-27-24
Presidential GDP Dance Off: Reagan vs. Trump 7-27-24
The B vs. CCC Battle: Tough Neighborhood, Rough Players 7-7-24
HY Spreads: Celebrating Tumultuous Times at a Credit Peak 6-13-24
Credit Markets Across the Decades 4-8-24
Credit Cycles: Historical Lightning Round 4-8-24
Histories: Asset Return Journey from 2016 to 2023 1-21-24
Credit Performance: Excess Return Differentials in 2023 1-1-24
Return Quilts: Resilience from the Bottom Up 12-30-23
HY vs. IG Excess and Total Returns Across Cycles: The UST Kicker 12-11-23
HY Multicycle Spreads, Excess Returns, Total Returns 12-5-23
US Debt % GDP: Raiders of the Lost Treasury 5-29-23
Wild Transition Year: The Chaos of 2007 11-1-22
Greenspan’s Last Hurrah: His Wild Finish Before the Crisis 10-30-22


