
Footnotes & Flashbacks: Credit Markets 12-16-24
We update an uneventful week for spreads but one with another round of duration setbacks from the UST.


I’m in Health & Human Services. Running polio vaccine disposal. How about you?
The stable but tight spread backdrop keeps the streak going with the June 2007 style spreads not leaving a lot of room for upside in a market waiting for more clarity on the macro risk variables (tariffs, deportation).
2024 winds down as a winning year for excess returns with near-equity-like total returns for HY and one where credit risk maximization has paid off.
IG has been feeling the recent duration headwinds even with spreads ending the year like mid 2007 and not too far from late 1997.
We await the final result for 2024, but HY is shaping up to look more like 2019 and 2017 for 2024 HY excess returns which posted near 6% handle excess returns. These were solid years for HY excess returns but materially behind the 2010 and 2012-2013 banner years as a major chunk of the current HY rally came in late 2023 for a running start.
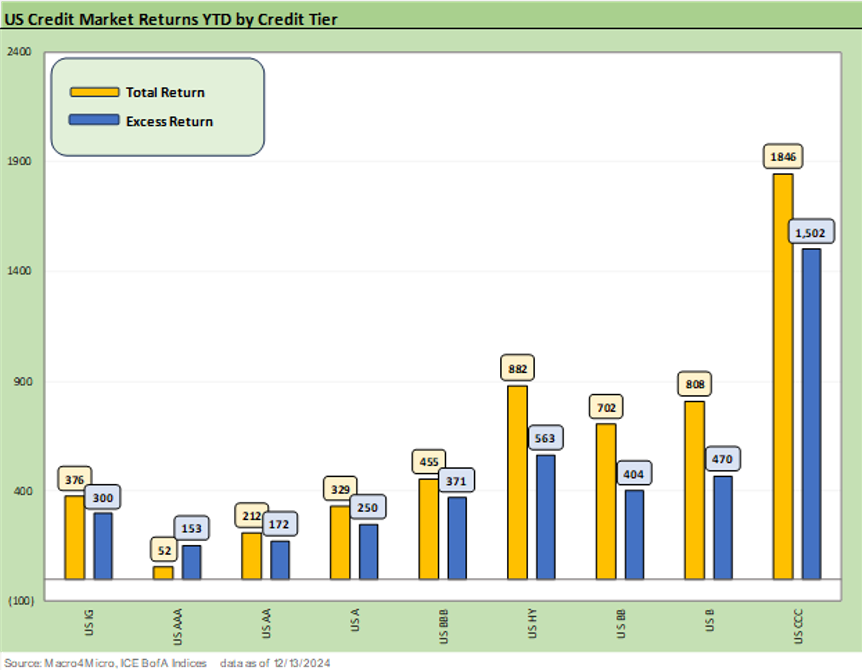
The above chart updates the running total returns and excess returns for IG Corp and HY and we also detail the credit tiers. We see the lower duration exposure in HY taking some of the edge off the duration damage relative to IG Corp in total returns.
For excess returns, that material outperformance of CCCs comes closer to the 2012-2013 home run that saw 14% handles for CCC in 2013 and just under 19% in 2012. Coming off a very bad year like 2011 is much different than coming off a good year in HY like we saw to wind down 2023 when spreads in HY and notably in the B tier came screaming in with a major rally to end the year (see Credit Performance: Excess Return Differentials in 2023 1-1-24).

The running HY vs. IG excess returns are framed above with HY running at +563 bps and IG at +300 bps. The good news is that the rule of “get paid more for taking more risk” is satisfied. That is not the case many times on a calendar year basis across the cycles. As a frame of reference, the HY excess return was +6.7% in 2019 (IG 3.0%) and HY was +6.1% in 2017 (IG +3.8%).
The 2018 volatility saw HY excess returns at -3.7% (IG -2.8%). Equities were also pummeled that year (see HY Pain: A 2018 Lookback to Ponder 8-3-24, Histories: Asset Return Journey from 2016 to 2023 1-21-24). The 2018 turmoil and the need of the FOMC to ease on weak investment and exports in 2019 is something to consider next time someone states (like too many apologists do every week) that NAFTA talks in 2018 and 2019 tariff clashes went smoothly. They did not. Oil crashed late in 2018, and that helped on some inflation metrics.
Over some very volatile HY decades where excess return data is available, we see negative excess return differentials (HY – IG) more than 1/3 of the time. Stretches of time such as 2000 to 2002, 2007-2008, 2014-2015 flunk the “get paid more for more risk” test since the HY markets were selling off. That is when the opportunities are best to add exposure.
It is not rocket science to know that credit compensation is higher and upside offers better symmetry when times are bad. That is the ultimate worry now when you are sitting near the most notable credit spread lows across the cycles. The challenge as always is “where do I go?” Taking the HY lite plan is one way and waiting for the spread decompression wave. That gets back to policy risks (tariffs, inflation, trade wars, FOMC vs. White House clash, etc.) and spread repricing that might come with a theoretical equity correction.

The BBB vs. BB excess returns are understandably more compressed given the growth of HY Lite strategies and the fact that more legacy BBB buyers step down across the divide to pick BB tier names where they see value and can find diversification by industry and issuer.
The BB tier long-term average default rates are negligible in HY context despite some major headliners back in the WorldCom/Enron years and in collapsing banks during the systemic bank crisis and ratings downgrades into HY. That comes with the asterisk that such situations were actually more about BBBs plunging than the BBs even if some BB tier meltdown tipped the scales on the default rate impacts.
For some frames of reference on the BB tier excess return YTD at +404 bps (+4.0%), the BB tier posted +6.5% in 2019 (BBB at +3.7%), -3.8% in 2018 (BBB at -3.4%), and +5.6% in 2017 (BBB at +4.6%). The easy takeaway is that BBB and BB were highly correlated in those pre-COVID markets given the industry mix overlap among other factors.
The late 2018 sell-off in HY was shortly after the cyclical lows of early Oct 2018 and featured a CCC plunge in Dec 2018. That was one of the stranger selloffs late in the year that gave 2019 a cheap starting point. For the current YTD 2024 excess return, the HY market had seen a monster rally in Nov-Dec 2023 and thus a compressed starting point in 2024 that became even tighter.

The B vs. CCC tier running excess returns show a dazzling performance in the CCC tier in 2024 relative to the B tier. As mentioned above and across the regular commentaries, the B tier had a solid year but had an impressive rally in Nov-Dec 2023 to start 2024 relatively tight before a fresh round of compression YTD of -74 bps for the B tier.
For a frame of reference on the B tier and its YTD numbers, we see +6.7% excess returns in 2019, -3.0% in 2018, and +5.4% in 2017 coming off the 2016 post-oil crisis bounce of +15.7% excess returns for the B tier for calendar 2016.
The CCC tier is wagged by the array of constituent changes that unfold across the year and the distorting effects of dropout (defaults) and distressed exchanges. We have already addressed the unusual histories of the CCC tier (see The B vs. CCC Battle: Tough Neighborhood, Rough Players 7-7-24).
The CCC tier excess return of +15.0% YTD 2024 really rings the bell on the net effects of the constituent action. That is well above the 2019 return of +7.8% and ugly 2018 CCC excess returns of -5.8%, and the +9.6% of 2017. The 2016 level of +35.2% for the CCC tier excess return offers a reminder that the best years come off an ugly prior year (if fundamentals allow, unlike 2000-2001-2002). For a not-so-fun fact, the late year crash of 2008 saw -48.7% in the CCC tier followed by +97% in 2009.
In the case of the 2016 rebound year to +35% for CCCs, the upstream energy mix was driving the whipsaw along with record E&P defaults and index dropouts along the way driving a better mix during the rally. For CCCs, it all gets back to name picking and that is when the distressed debt mavens do their best work (or die trying).
A look at spreads…
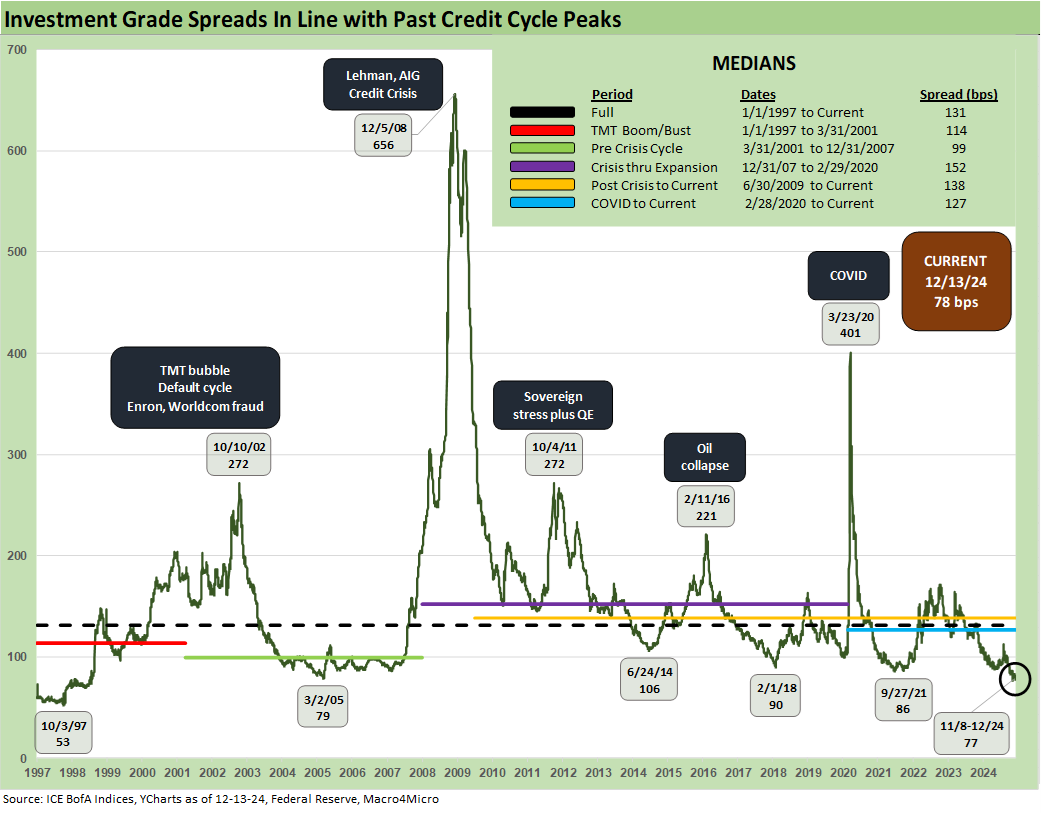
The IG OAS action saw another slight tightening to +78 bps or just above the Nov tights, inside the March 2005 lows of +79 bps, and well inside the long-term median of +131 bps. The IG OAS is well above the 1997 lows and modestly above where 1997 ended (+70 bps).

The HY OAS is still residing in the June 2007 zone at +268 after a slight tick higher on the week. This rivals the extended compressions of 1997 and the bubble period of June 2007 when HY OAS hit a low of +241 bps to start the month but ended June 2007 at +298 bps. Similarly, the Oct 1997 lows of +244 bps saw the year 1997 end at a HY OAS of +296 bps (see HY Spreads: Celebrating Tumultuous Times at a Credit Peak 6-13-24). Current spreads are in the danger zone of tights.

As we covered in the Mini Lookback, the “HY OAS minus IG OAS” quality spread differential remains below the rarely crossed dividing line of +200 bps as we show in the above chart.

The BBB vs. BB quality spread differential is off the lows of +55 bps seen in July and still dramatically below the long-term median of +135 bps

.The BB OAS level ticked slightly wider on the week to +165 bps vs. the long-term median of +300 bps. The BB tier remains inside the late May 2007 tights but well above the 1997 lows when the BB tier was much smaller and had higher issuer and industry concentrations. The BB tier is -40 bps tighter on the year.

The B tier also edged higher on the week to +267 after YTD tightening of -74 bps. The +267 bps is above the November tights of +254 bps but comfortably above the June 2007 lows of +236 bps. The long-term median of +468 bps is materially above the current levels.

The B vs CCC tier above drives home the occasional divergence of the B vs. CCC tier. That relationship in theory will be less volatile in this cycle given the migration of the most aggressively leveraged transactions over to the private credit sector. The move to private credit and loans reduces exposure to the outflow risks from HY bond funds that had historically plagued the low end of the HY bond tiers. HY bonds always will have its share of dogs, but the HY fund risks of being attacked by a very large pack of such dogs is lower in this cycle.

The above chart shortens the timeline for the B vs. CCC tier to just before the inflation spike and tightening cycle. The Jan 2022 to Dec 2024 timeline gives a better view of the low end spread gap and rally across what was the first major inflation fighting cycle in 4 decades. The fact that the market featured very low defaults and sustained expansion along with a strong consumer sector made 2022 to 2024 a radically different economic backdrop than the last tightening cycle under Volcker. Back then, the HY bond market was also in its infant stage.

The “CCC OAS minus B tier OAS” quality spread differential of +449 is now well inside the median of +484 bps as noted above.
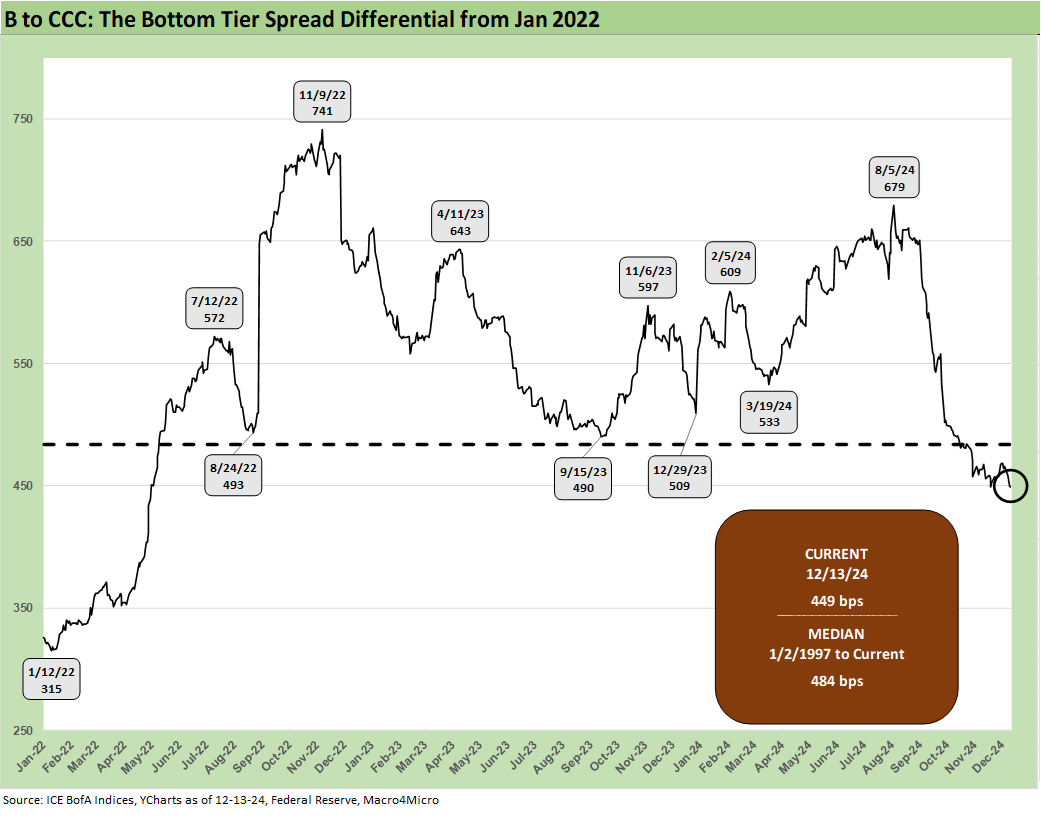
The timeline again gets shortened to a start date of Jan 2022 to better visualize the B vs. CCC tier OAS differential across the inflation and tightening cycle. We see the anxiety levels back in fall 2022 when so many were screaming “the recession is here” when it wasn’t by any stretch. The risk of recession down the line was there, but the economy and consumer were chugging along (see Unemployment, Recessions, and the Potter Stewart Rule 10-7-22).
A look at yields…
We already looked at the direction of UST yields in another tough week for duration (see Footnotes & Flashbacks: State of Yields 12-15-24). Below we touch on the all-in-yield trends for HY and IG.
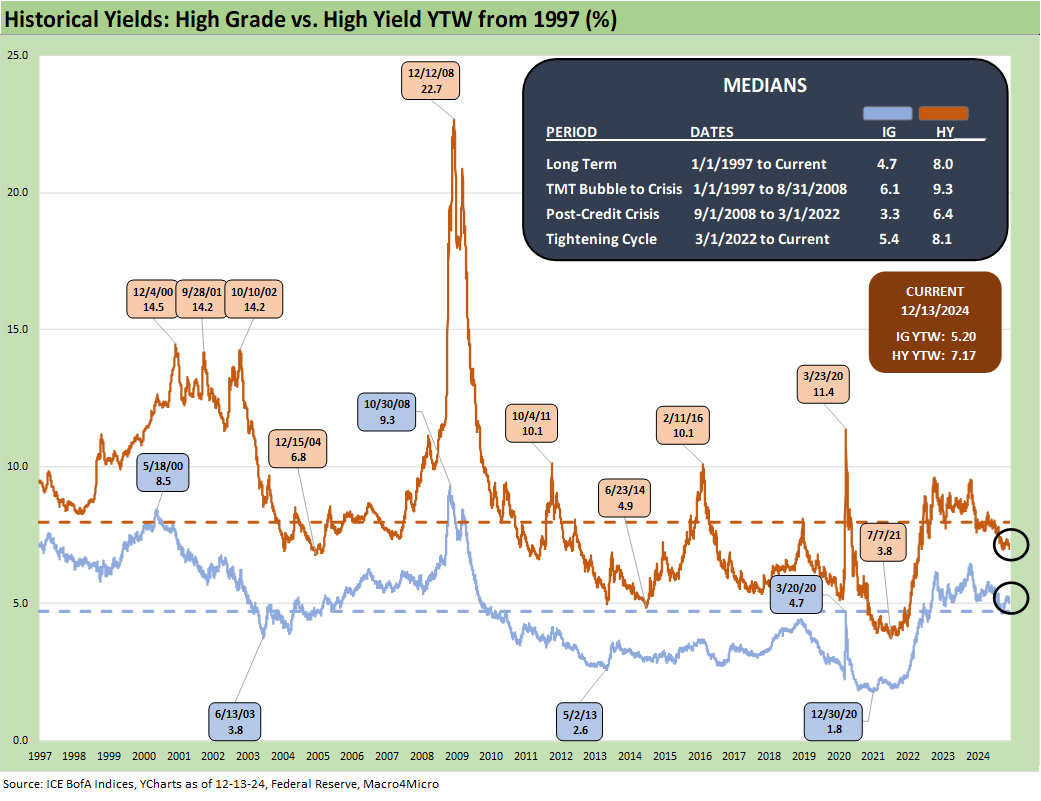
The above time series plots the IG Index and HY Index yields across the cycles from 1997 through this past week. With spreads near multicycle lows and the UST curve below any of the cyclical transition periods of the pre-crisis, pre-ZIRP years, investors do not have much to work with.
The long-term median of 4.7% for IG and 8.0% for HY index yields has a long stretch of ZIRP, QE, and semi-normalization distortions. We thus tend to see the pre-ZIRP and pre-crisis median of 6.1% for IG and 9.3% for HY as the more rational and logical comps. Tight spreads and low UST yields in this market make those frames of reference tough to match up with.
As we detail in the next two charts, the stunningly low UST curve in historical context and spreads at multi-cycle lows do not offer compelling risk-reward symmetry on credit pricing or duration risk when the market is staring down the barrel of a major tariff and deportation threat.
You have to play somewhere in that mix, and that is why God made diversification. Shorter duration exposure and more defensive in the middle tier credit range (BBB and BB) seems the safer game plan until we actually see what Trump will do vs. what he will threaten. It is a precarious time for radical policy actions.

The above chart frames IG index yield vs. prior credit cycle peaks in mid-2007 and late 1997. We plot the IG yields on the horizontal line and include the UST yield curves for the same dates. The lower UST rates drive the story for the IG index, and the 5.2% IG YTW is shockingly low relative to “normal” cycles in the pre-ZIRP years.

The above chart does the same exercise for the HY index yields vs. the 2007 and 1997 periods. Those periods after Dec 1997 and June 2007 did not end well, but the current index quality mix is superior as is the attribute of the relative lack of the “late-cycle crazy deal flow.” In the past, the late-cycle excess and private equity funding would come back to haunt the HY bond “spread gap” risk on the low end.
See also:
Footnotes & Flashbacks: State of Yields 12-15-24
Footnotes & Flashbacks: Asset Returns 12-15-24
Mini Market Lookback: Macro Grab Bag 12-14-24
Toll Brothers: Rich Get Richer 12-12-24
CPI Nov 2024: Steady, Not Helpful 12-11-24
Mini Market Lookback: Decoupling at Bat, Entropy on Deck? 12-7-24
Credit Crib Note: Herc Rentals (HRI) 12-6-24
Payroll Nov 2024: So Much for the Depression 12-6-24
Trade: Oct 2024 Flows, Tariff Countdown 12-5-24
JOLTS Oct 2024: Strong Starting Point for New Team in Job Openings 12-3-24
Mini Market Lookback: Tariff Wishbones, Policy Turduckens 11-30-24
PCE Inflation Oct 2024: Personal Income & Outlays 11-27-24
3Q24 GDP Second Estimate: PCE Trim, GPDI Bump 11-27-24
New Home Sales Oct 2024: Weather Fates, Whither Rates 11-26-24
Mexico: Tariffs as the Economic Alamo 11-26-24
Tariff: Target Updates – Canada 11-26-24
Mini Market Lookback: Market Delinks from Appointment Chaos… For Now 11-23-24
Credit Crib Note: Ashtead Group 11-21-24
Existing Home Sales Oct 2024: Limited Broker Relief 11-21-24
Housing Starts Oct 2024: Economics Rule 11-19-24
Mini Market Lookback: Reality Checks 11-16-24
Industrial Production: Capacity Utilization Circling Lower 11-15-24
Retail Sales Oct 2024: Durable Consumers 11-15-24
Credit Crib Note: United Rentals (URI) 11-14-24
Mini Market Lookback: Extrapolation Time? 11-9-24
The Inflation Explanation: The Easiest Answer 11-8-24
Fixed Investment in 3Q24: Into the Weeds 11-7-24
Morning After Lightning Round 11-6-24
Select Histories:
Mexico: Tariffs as the Economic Alamo 11-26-24
Tariff: Target Updates – Canada 11-26-24
Tariffs: The EU Meets the New World…Again…Maybe 10-29-24
Trump, Trade, and Tariffs: Northern Exposure, Canada Risk 10-25-24
Trump at Economic Club of Chicago: Thoughts on Autos 10-17-24
HY OAS Lows Memory Lane: 2024, 2007, and 1997 10-8-24
Credit Returns: Sept YTD and Rolling Months 10-1-24
HY Industry Mix: Damage Report 8-7-24
Volatility and the VIX Vapors: A Lookback from 1997 8-6-24
HY Pain: A 2018 Lookback to Ponder 8-3-24
Presidential GDP Dance Off: Clinton vs. Trump 7-27-24
Presidential GDP Dance Off: Reagan vs. Trump 7-27-24
The B vs. CCC Battle: Tough Neighborhood, Rough Players 7-7-24
HY Spreads: Celebrating Tumultuous Times at a Credit Peak 6-13-24
Credit Markets Across the Decades 4-8-24
Credit Cycles: Historical Lightning Round 4-8-24
Histories: Asset Return Journey from 2016 to 2023 1-21-24
Credit Performance: Excess Return Differentials in 2023 1-1-24
Return Quilts: Resilience from the Bottom Up 12-30-23
HY vs. IG Excess and Total Returns Across Cycles: The UST Kicker 12-11-23
HY Multicycle Spreads, Excess Returns, Total Returns 12-5-23
US Debt % GDP: Raiders of the Lost Treasury 5-29-23
Wild Transition Year: The Chaos of 2007 11-1-22
Greenspan’s Last Hurrah: His Wild Finish Before the Crisis 10-30-22
Greenspan’s First Cyclical Ride: 1987-1992 10-24-22
UST Curve History: Credit Cycle Peaks 10-12-22
Unemployment, Recessions, and the Potter Stewart Rule 10-7-22