
Footnotes & Flashbacks: Credit Markets 4-6-25
The Trump tariff driven 1-month spread move in HY just cracked into the low end of the top 10 since 1997. That says it all.


Tariff retaliation warming up…
We have looked at the risky asset markets from a few different angles on the back of the Trump Tariff fiasco, and there is no good angle. As we go to print, Asia is melting down and US futures are teed up for more of the same beatdown. Trump is still rolling with “seller pays.” Market players are angry, and that will not help in retaliation de-escalation.
HY is running at an ugly excess return number YTD of -4.0% and IG at -2.0%, and the UST curve can only do so much when the symmetry of spreads is still distinctly unfavorable with IG and HY OAS both still below the long-term median.
The more Trump says things like “only the weak fail” and “have faith” while golfing and his spokesmodels act like there are no issues, the more the market gets emotional and disgusted. That makes for tough decision-making for investors since they need to factor in rational behavior across the table. Irate trade partners complicate life for investors trying to get a read on retaliation risk and “retaliation to the retaliation” fallout from a very troubling personality profile.
Many would love to see the Trump Tariff apologists show us their “buy” tickets over the last two days and this week and sign an affidavit that they did not sell or short anything (mostly kidding).
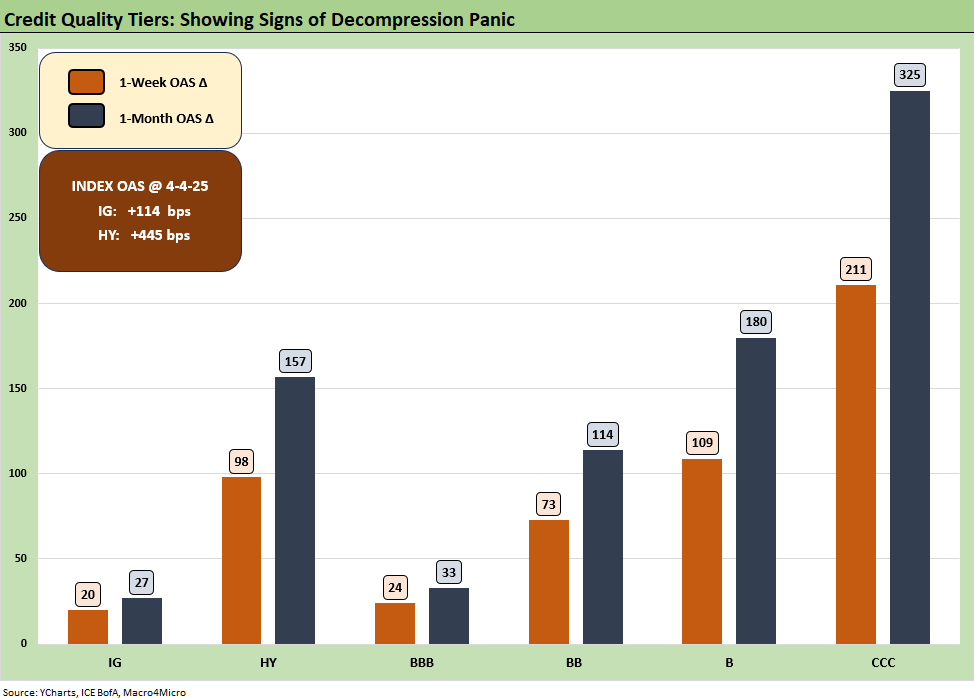
The above chart shows the spread deltas for IG, HY, and BBB and down the risk tiers. We already covered it in the Mini Market Lookback earlier this week and the short summary is a sharp credit risk-off move with decompression down the tiers. The balance of risks with US IG and US HY down near all-time lows just a month ago was very skewed towards widening and the policy misstep (ok, tar pit face plant) this week on trade and tariffs quickly sent both wider. Even with such a large spread widening this past week, we see the above indices closer to their long-term medians and with room to run as the retaliation tariff games start moving forward.
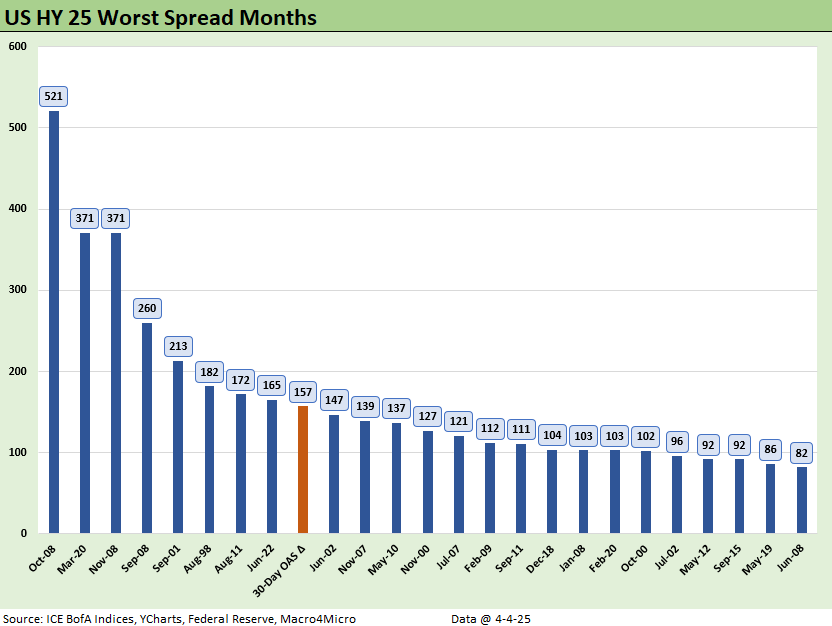
The above chart contextualizes the 30-day spread move in the context of the worst calendar month widenings for US HY. There is no shortage of ‘worst since’ titles to choose from for the most recent sell-off, but this history above helps provide a measuring stick for how bad the pain is. The +157 bps move would rank 9th in the history of US HY spread moves and +98 bps of that was just the Thursday and Friday moves.
The dates above include the TMT meltdown of 2001-2002, the financial crisis, COVID, the Eurozone sovereign stress in 2011-2012, the fall 2015 Asia mini-crisis, the Aug 1998 Russia default, and the start of the mortgage panic in Nov 2007, among others.
April MTD would have made the list as well by itself, but we viewed that as double counting. As we scan across the months in the list above, there was a lot of chaos and market turmoil but none as self-inflicted as the current bout.
We would highlight that Trump shows up in 4 of the months above, but his Dec 2018 month was right during Trump’s “greatest economy of all time (see HY Pain: A 2018 Lookback to Ponder 8-3-24 ). It was also when Trump was in what was very minor tariff mode compared to today’s global onslaught with all trade partners. Oil prices also cracked in Dec 2018. The year 2018 was an ugly year in asset returns and the Fed had to ease in 2019 (see Histories: Asset Return Journey from 2016 to 2023 1-21-24). Now Trump can say he outscored Biden finally since Biden only made the list during the June 2022 inflation peak. Trump is now in there twice (Dec 2018, this current rolling month) excluding COVID.
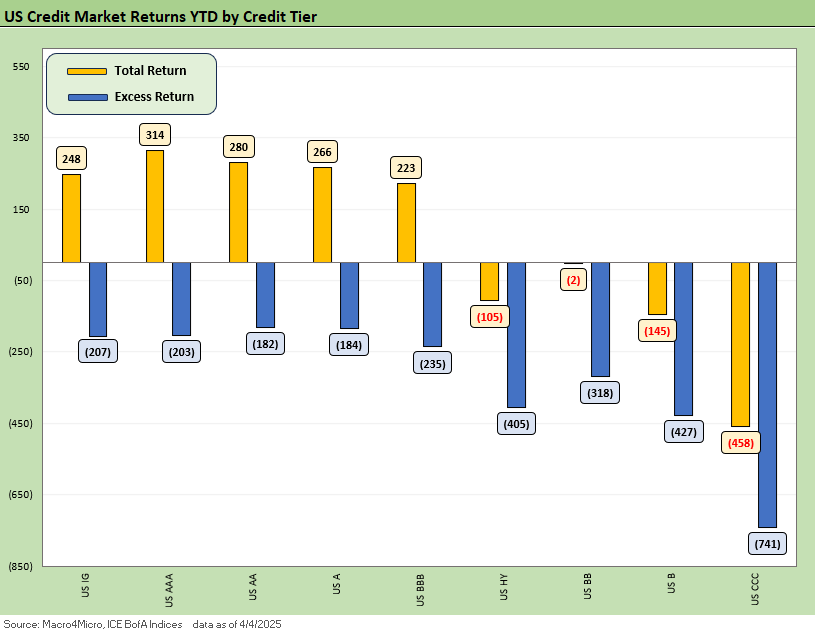
The above chart updates the running YTD total and excess returns for IG, HY, and their respective credit tiers. Excess returns reflect the spread pain as US IG moved to below -2% and US HY is just below -4%. This week’s market rout has flipped the US HY total returns mildly negative, down to -1% from +1% just a week ago. US IG and higher quality credit saw total returns edge higher as the curve move offset the spread widening.
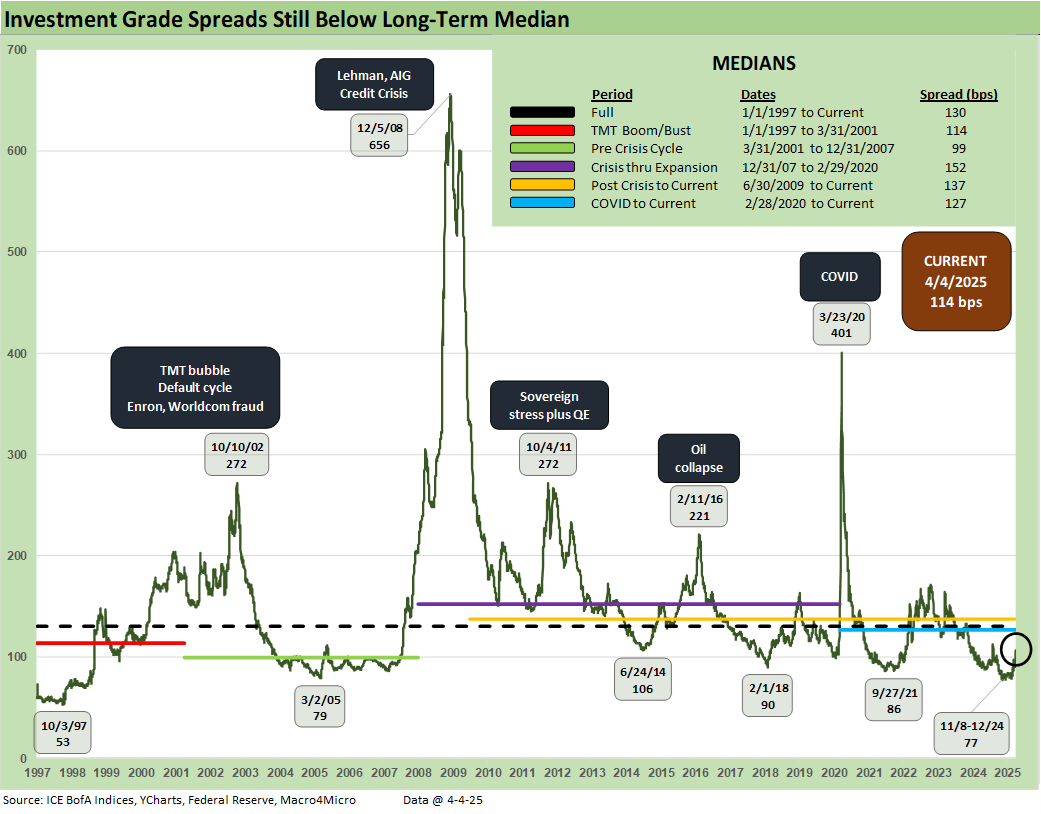
IG Spreads had held in well the past few week, but the tariffs rattled the IG market at +20 bps wider this week to +114 bps this week. However, that is still just above the June 2014 lows and still below the long-term +130 median. Even as spreads move out, the curve move still can keep the total return picture intact and give PMs cover to reposition and trim tactically where risks are perceived to be highest.
With such indiscriminate tariff policies, the analytical bar has moved from which industries are in the crosshairs to which are most/least exposed in continued actions. Energy, Autos/Manufacturing, Retail, and Banking remain high on our list.
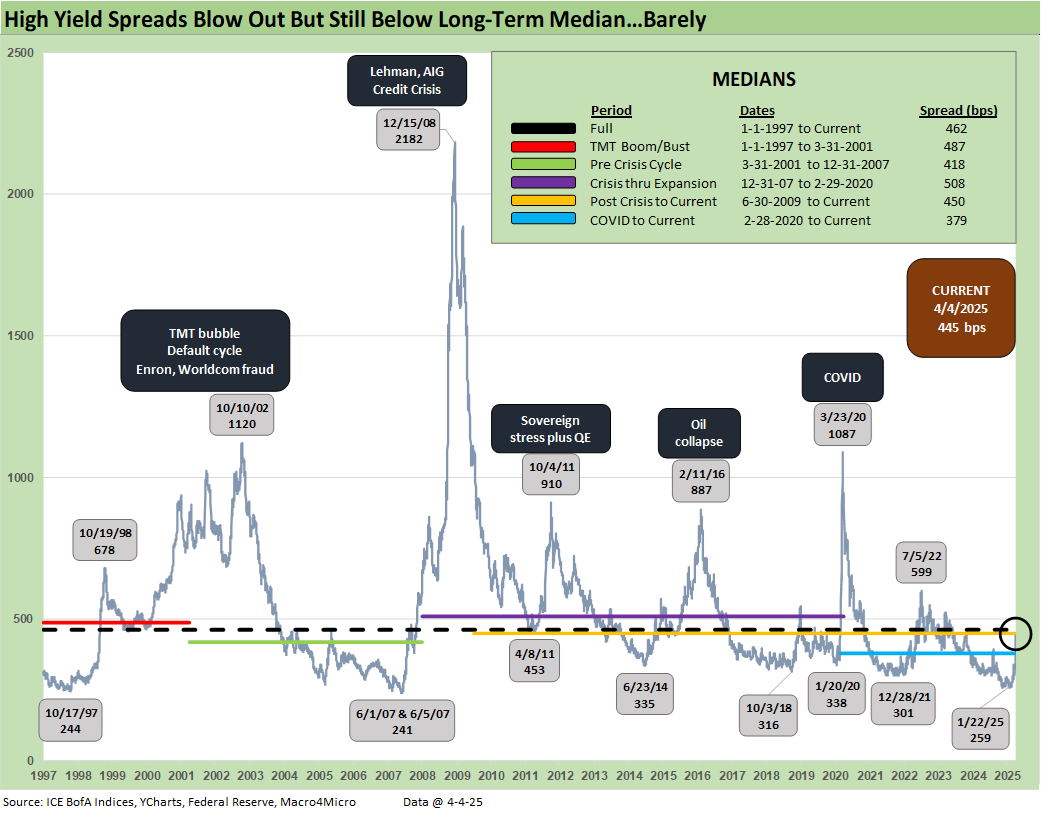
As we’ve covered plenty already, US HY moved +98 bps on the week, accelerating the widening already underway since January hit near all-time lows. This week is a good reminder that when the market gets panicked, the US HY spreads can move in a hurry and there is plenty of room to still run as +445 bps on Friday is still below some longer-term medians.
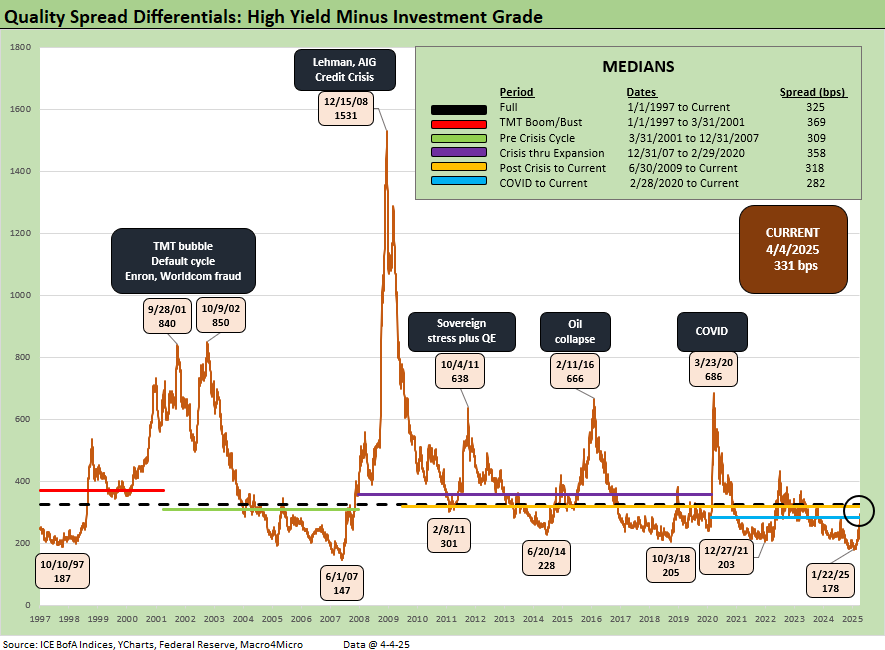
The HY-IG OAS differential tracks the spread pickup for stepping down the broader quality spectrum. The repricing this week moved this metric +78 bps and continues the march away from historically compressed levels earlier in the year. If there is no tariff relief or more sensible policy negotiated in the coming days, the decompression wave will continue.
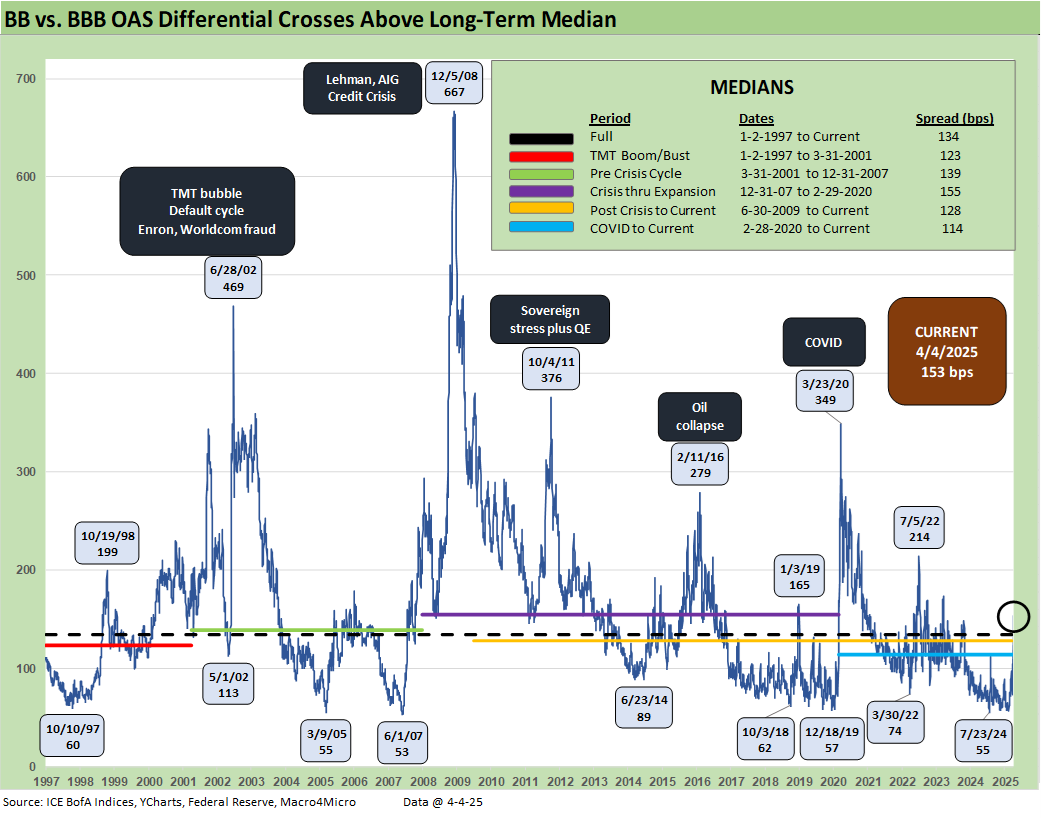
The BB-BBB OAS differential tracks the spread pickup as we step down across the IG/HY divide. The stark difference this week is between BBB and BB seeing widenings of +24 bps and +73 bps, respectively. That move leaves the BB vs. BBB differential another +49 bps wider this week. Rhyming with the themes above, the differential is now moving away from cyclical lows and above median levels.
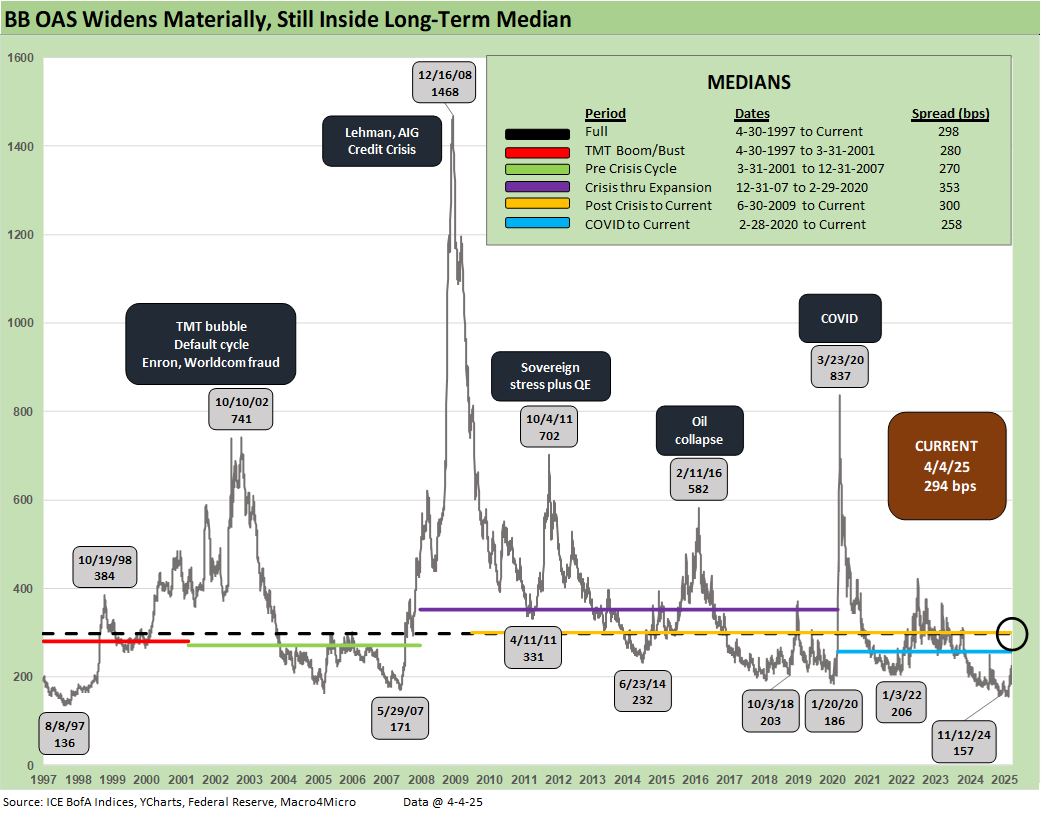
The BB OAS is covered above and shows the magnitude of the +73 bps widening in historical context. In good times, these are looked at for the incremental yield and income but sell-offs like this week remind that the good often comes with the bad. There are a lot of high-quality companies still in the BB tier and even though tariffs are necessarily negative for credit quality for most companies, the difference in degree of sell-off between BBB and BB could make for interesting opportunities later down the line.
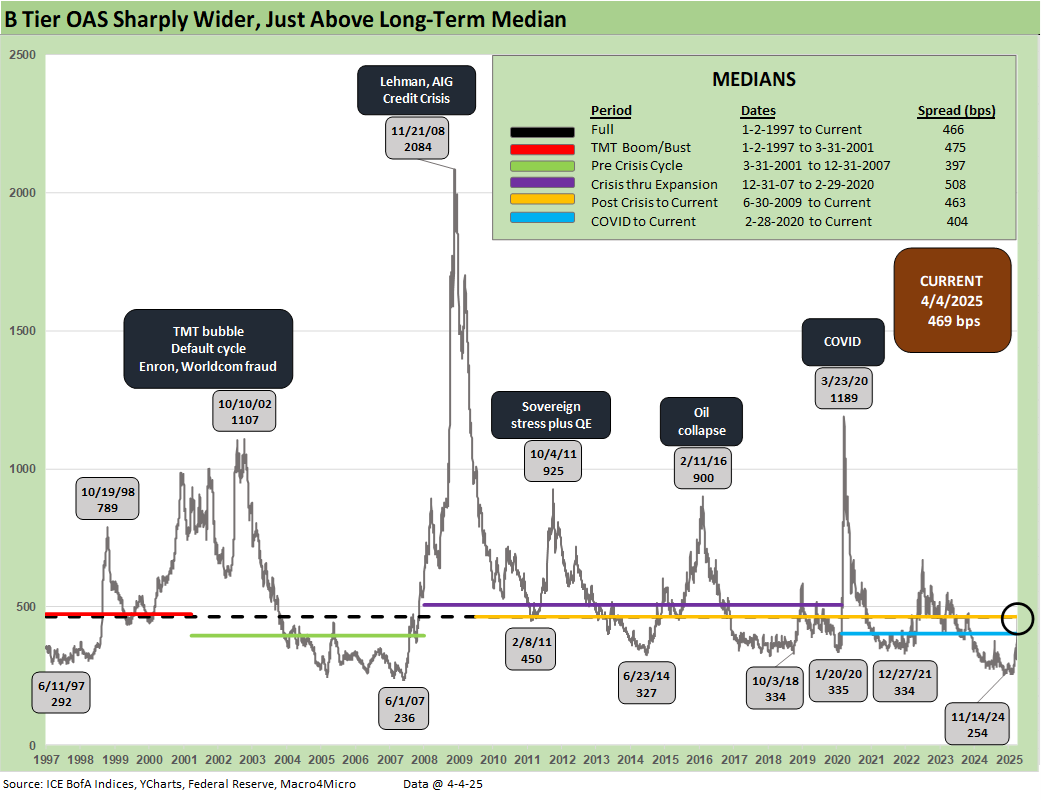
The B tier is the sweet spot for the “HY classic” investor and the investor base did not send different signals as the week ended +109 bps wider. The uncertainty around tariff policy was already sending jitters through the market but the reality was far more severe than imagined. Heading into next week starting at +469 bps is just around the median levels.
There is a bad history during such panics with the variables so uncertain and solutions not easy to see. Bad management teams are common in HY history, but very bad macro policy action with this type of fundamental impact is uncharted territory. There are no easy management changes to make. You are stuck with politicians that tend to go into CYA mode and not “fess up.”
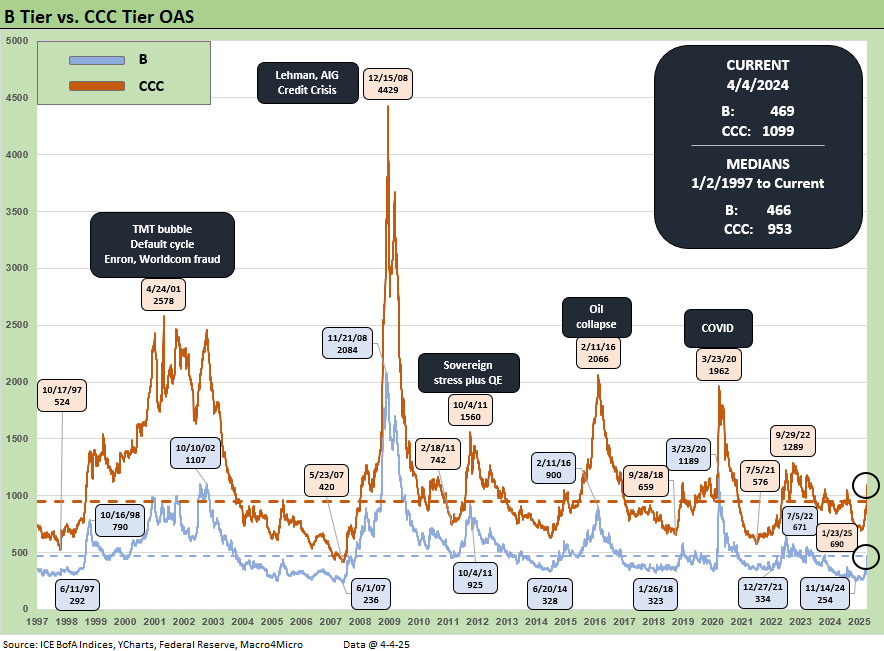
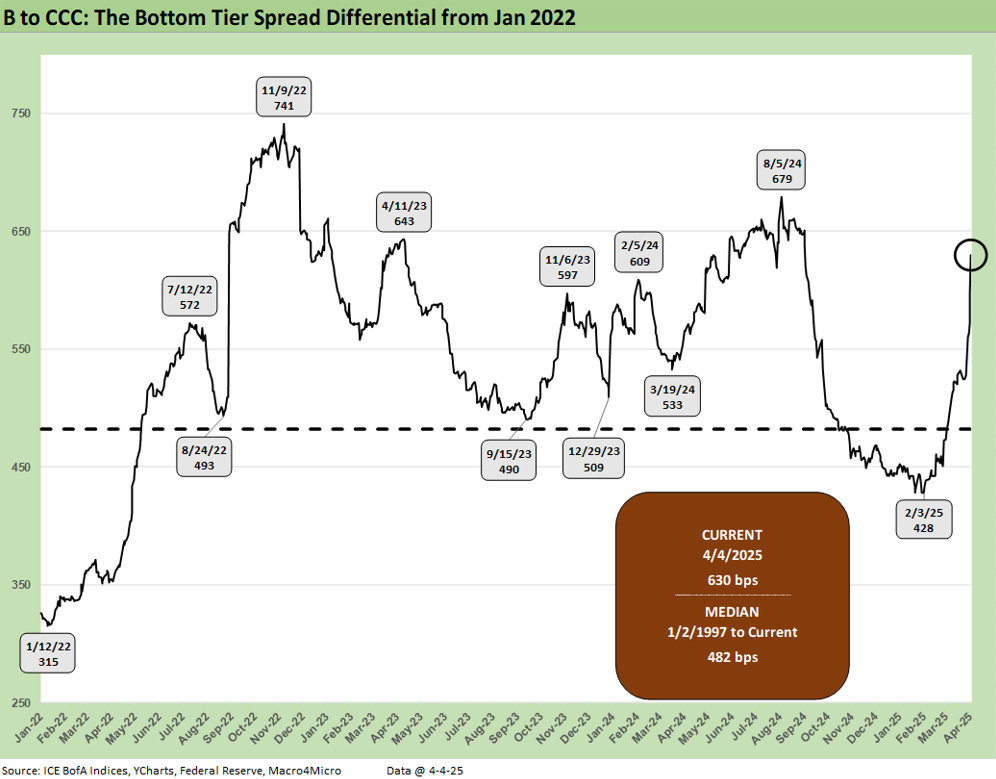
The B vs. CCC tier is plotted above. The timeline for B and CCC spreads highlights the points of major divergence along the way (see The B vs. CCC Battle: Tough Neighborhood, Rough Players 7-7-24). The current CCC tier OAS at +1099 bps moved sharply above the long-term median of +953 bps. It comes as no surprise that the multifront global trade war and unprecedented scale and breadth of tariffs is another moment of B vs. CCC divergence.
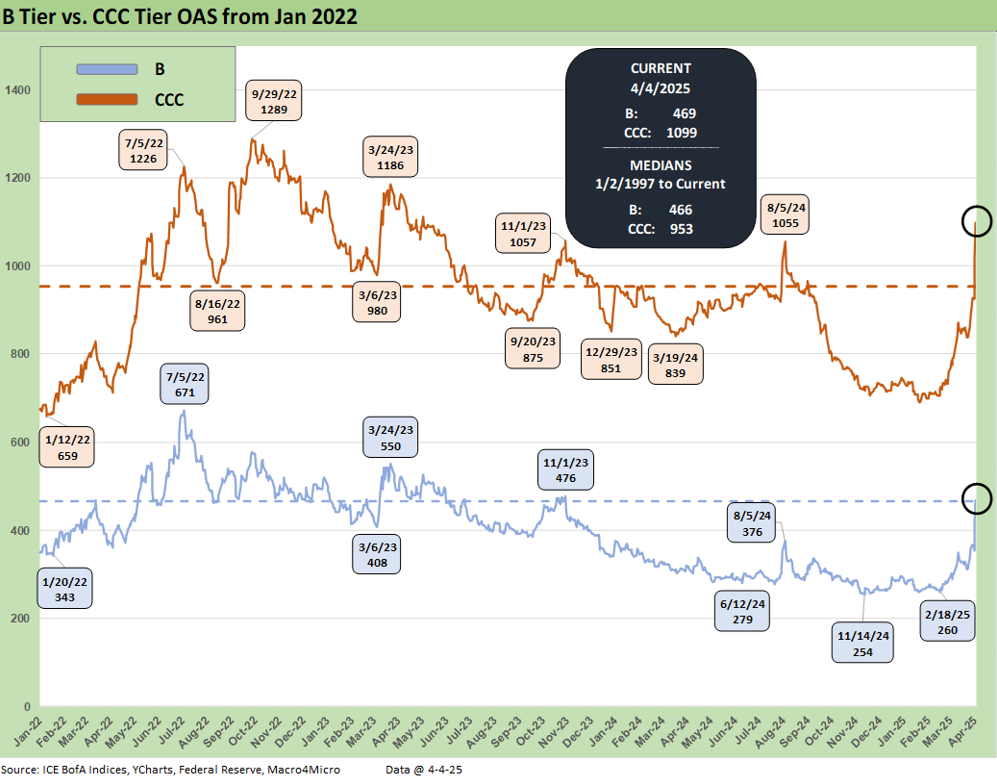
The shorter timeline from early 2022 gives better granularity on the more recent swings in the B and CCC tier across a market that saw a rare inflation spike and Fed inflation-fighting cycle. The most recent move sends both B and CCC back closer to November 2023 levels, with CCCs one more bad week away from the worst of the 2022 levels.
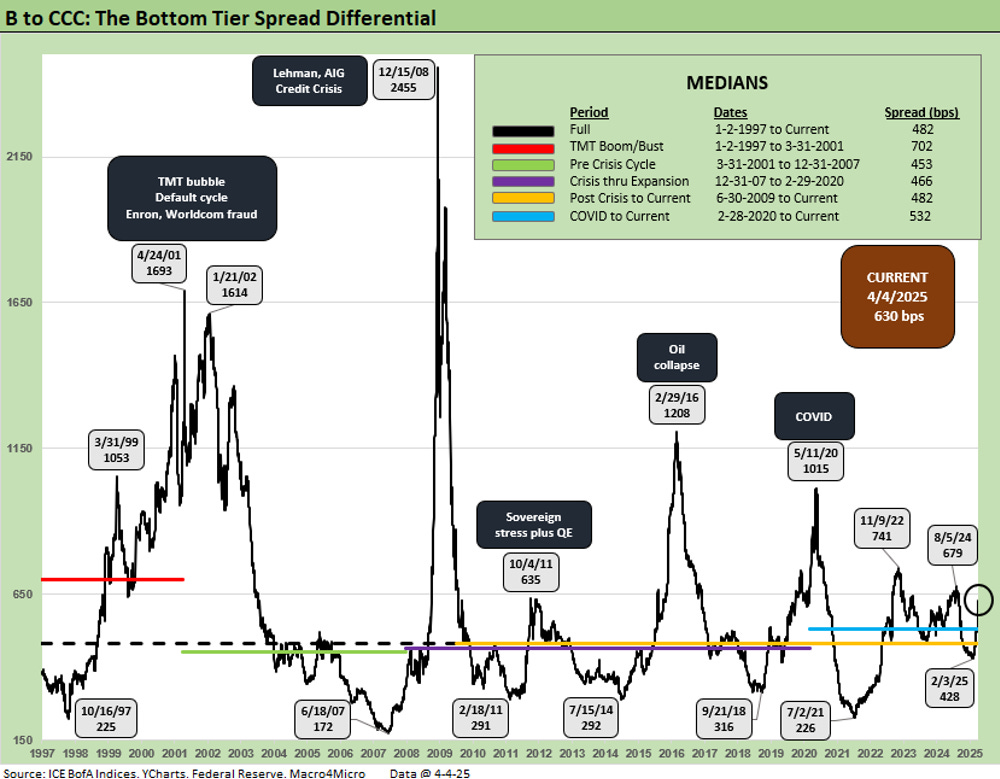
The B vs. CCC tier quality spread differential is detailed above. The current +630 bps is now well wide to the long-term median after the decompression wave brings it +102 bps wider. The “CCC OAS minus B OAS” quality spread differential is wide to all of the medians above with the glaring exception of the TMT implosion in 2000-2001.
We shorten the timeline to a Jan 2022 start date to give better visuals on more recent trends. The “CCC minus B” differential has gapped wider by 100 bps since early Feb 2025 to the current +630 bps.
A look at yields…
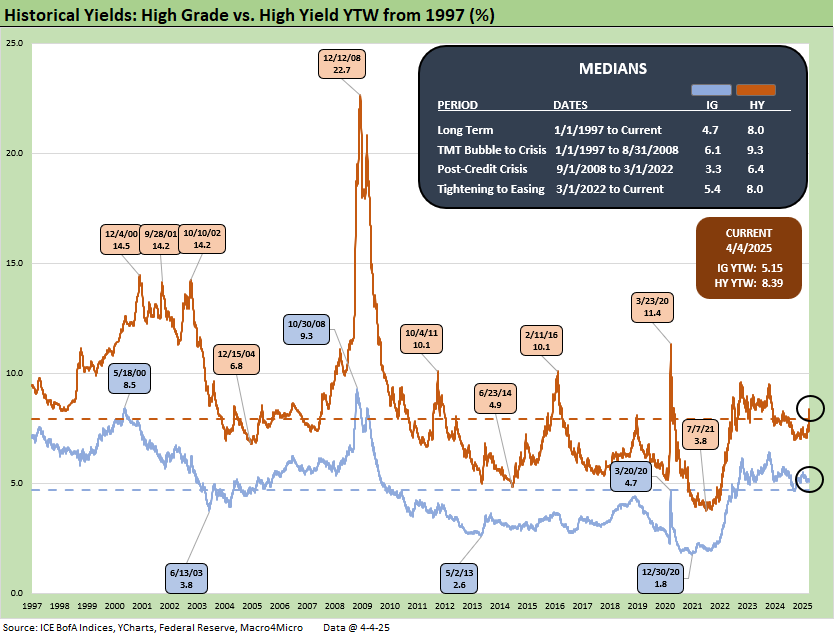
Moving away from spreads, which are just now approaching long-term medians for most tiers, yields for both IG and HY have a more complex story in historical context given the post-crisis distortions of ZIRP and “normalization.” The normalization period of Dec 2015 to Dec 2018 never really got on track with the economic weakness and Fed easing of 2019 followed by a COVID crisis and return to ZIRP in Mar 2020.
The current IG YTW at 5.15% is below the 6.1% pre-ZIRP median while HY YTW rose this week to 8.39% vs. a pre-ZIRP 9.3% mark. We consider the pre-ZIRP years the most rational frame of reference in light of the post-crisis ZIRP and QE as well as the COVID Fed reactions.
Spreads will remain a key swing factor for reaching those yield medians of pre-ZIRP years, but we never can ignore major variables that could drive UST levels and the slopes along the shapeshifting UST curve. The moves from inversion to modest steepening beyond 2Y alongside inversion from the short end opens up a lot of scenarios ahead. More FOMC easing with a bear steepener on stagflation and supply fears are among them. HY will be wagged more by spreads.
In this current market, the UST curve is a very critical wildcard since we have a rare debate unfolding over recession vs. stagflation. That decision point for asset allocators has not been a front burner decision since the early 1980s when the actively traded IG and HY bond market was still in its formative years.
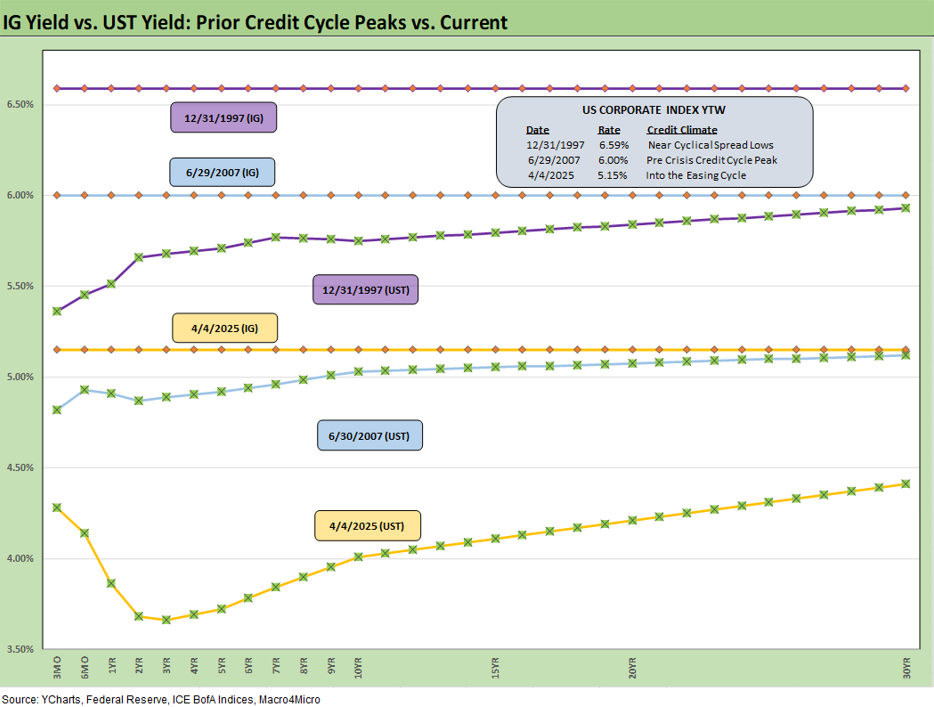
The above frames current IG index yields vs. previous credit peaks along with their respective UST curves. We include both prior credit peaks in June 2007 and Dec 1997 for context as prior peak credit cycles when high risk appetites saw investors chasing yields. Those 1997 and 2000 markets saw poor risk symmetry and low spreads.
Today’s curve is still low in those historical contexts. With stagflation risks back in the mix, the next stretch could see long yields return to rising as spreads widen out for renewed return pain. The short to intermediate IG market is nonetheless the safest bond game for now. The asset class constrained to HY can take refuge in the higher quality layers.
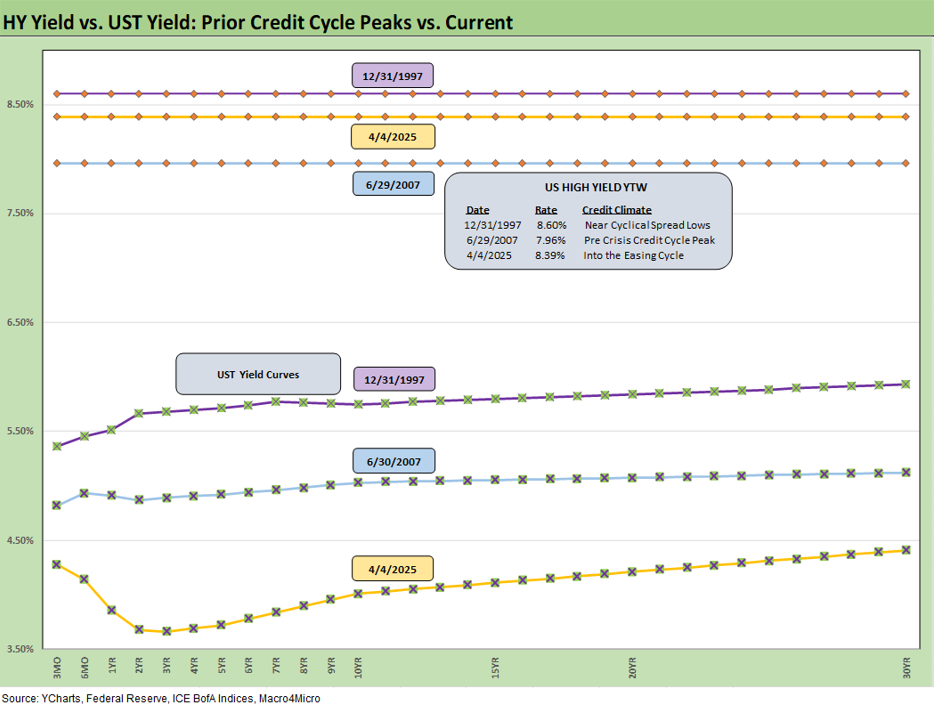
The final chart replicates the same drill but for HY index yields. This week’s spread move leaves current HY index yield still in line with prior peak credit cycles on wider spreads but with much lower UST.
The widening this week gave flashbacks to the volatility and major spread moves of the 1997-98 and 2007-08 periods that also posted triple-digit widzening months. The sheer speed of risk repricing has happened in earlier cycles as well. During 1990, securities firms started to collapse including Drexel’s Chapter 11 in Feb 1990 and bridge loan related bailouts of then-Shearson Lehman, First Boston, and Kidder Peabody. We do not face that type of intermediary meltdown risk here (at least not yet!).
The summer of 2007 was the start of major problems in the credit markets, but the equity markets and S&P 500 and NASDAQ kept on rallying into Oct 2007. Later in the turmoil and well after the fact, the start of the recession was tagged as Dec 2007 (see Business Cycles: The Recession Dating Game 10-10-22)
The 2007 experience reminded the market that credit leads the cycle and equity lags. The same was true in 1999 with the HY default cycle underway and NASDAQ at +86% that year. This time around, the credit markets did not expect the tariff insanity and is still making up its mind. We expect HY to stay unhappy and spread to average wider as the tariffs roll into actual corporate fundamentals.
See also:
Footnotes & Flashbacks: State of Yields 4-6-25
Footnotes & Flashbacks: Asset Returns 4-6-25
Mini Market Lookback: A Week for the History Books 4-5-25
Payroll March 2025: Last Call for Good News? 4-4-25
Payrolls Mar 2025: Into the Weeds 4-4-25
Credit Snapshot: AutoNation (AN) 4-4-25
Credit Snapshot: Taylor Morrison Home Corp (TMHC) 4-2-25
JOLTS Feb 2025: The Test Starts in 2Q25 4-2-25
Credit Snapshot: United Rentals (URI) 4-1-25
Footnotes & Flashbacks: Credit Markets 3-31-25
Footnotes & Flashbacks: State of Yields 3-30-25
Footnotes & Flashbacks: Asset Returns 3-30-25
Mini Market Lookback: The Next Trade Battle Fast Approaches 3-29-25
PCE Feb 2025: Inflation, Income, Outlays 3-28-25
Auto Tariffs: Questions to Ponder 3-28-25
4Q24 GDP: The Final Cut 3-27-25
Durable Goods February 2025: Preventive Medicine? 3-26-25
New Homes Sales Feb 2025: Consumer Mood Meets Policy Roulette 3-25-25
KB Home 1Q25: The Consumer Theme Piles On 3-25-25
Lennar: Cash Flow and Balance Sheet > Gross Margins 3-24-25
Mini Market Lookback: Fed Gut Check, Tariff Reflux 3-22-25
Existing Homes Sales Feb 2025: Limping into Spring 3-20-25
Fed Action: Very Little Good News for Macro 3-19-25
Industrial Production Feb 2025: Capacity Utilization 3-18-25
Housing Starts Feb 2025: Solid Sequentially, Slightly Soft YoY 3-18-25
Retail Sales Feb 2025: Before the Storm 3-17-25
Mini Market Lookback: Self-Inflicted Vol 3-15-25
Credit Spreads: Pain Arrives, Risk Repricing 3-13-25
CPI Feb 2025: Relief Pitcher 3-12-25
JOLTS Jan 2025: Old News, New Risks in the Market 3-11-25
Credit Spreads Join the Party 3-10-25
Mini Market Lookback: Tariffs Dominate, Geopolitics Agitate 3-8-25
Payrolls Feb 2025: Into the Weeds 3-7-25
Employment Feb 2025: Circling Pattern, Lower Altitude 3-7-25
Gut Checking Trump GDP Record 3-5-25
Trump's “Greatest Economy in History”: Not Even Close 3-5-25
Asset Returns and UST Update: Pain Matters 3-5-25
Mini Market Lookback: Collision Courses ‘R’ Us 3-2-25
Tariff and Trade links:
Tariffs: Diminished Capacity…for Trade Volume that is…4-3-25
Reciprocal Tariff Math: Hocus Pocus 4-3-25
Reciprocal Tariffs: Weird Science Blows up the Lab 4-2-25
Tariffs: Stop Hey What’s That Sound? 4-1-25
Tariffs are like a Box of Chocolates 4-1-25
Auto Tariffs: Questions to Ponder 3-28-25
Fed Gut Check, Tariff Reflux 3-22-25
Tariffs: Strange Week, Tactics Not the Point 3-15-25
Trade: Betty Ford Tariff Wing Open for Business 3-13-25
CPI Feb 2025: Relief Pitcher 3-12-25
Auto Suppliers: Trade Groups have a View, Does Washington Even Ask? 3-11-25
Tariffs: Enemies List 3-6-25
Happy War on Allies Day 3-4-25
Auto Tariffs: Japan, South Korea, and Germany Exposure 2-25-25
Mini Market Lookback: Tariffs + Geopolitics + Human Nature = Risk 2-22-25
Reciprocal Tariffs: Weird Science 2-14-25
US-EU Trade: The Final Import/Export Mix 2024 2-11-25
Aluminum and Steel Tariffs: The Target is Canada 2-10-25
US-Mexico Trade: Import/Export Mix for 2024 2-10-25
Trade Exposure: US-Canada Import/Export Mix 2024 2-7-25
US Trade with the World: Import and Export Mix 2-6-25
The Trade Picture: Facts to Respect, Topics to Ponder 2-6-25
Tariffs: Questions to Ponder, Part 1 2-2-25
US-Canada: Tariffs Now More than a Negotiating Tactic 1-9-25
Trade: Oct 2024 Flows, Tariff Countdown 12-5-24
Mexico: Tariffs as the Economic Alamo 11-26-24
Tariff: Target Updates – Canada 11-26-24
Tariffs: The EU Meets the New World…Again…Maybe 10-29-24
Trump, Trade, and Tariffs: Northern Exposure, Canada Risk 10-25-24
Trump at Economic Club of Chicago: Thoughts on Autos 10-17-24
Facts Matter: China Syndrome on Trade 9-10-24
Tariffs: Questions that Won’t Get Asked by Debate Moderators 9-10-24
The Debate: The China Deficits and Who Pays the Tariff? 6-29-24
Trade Flows: More Clarity Needed to Handicap Major Trade Risks 6-12-24
Trade Flows: Deficits, Tariffs, and China Risk 10-11-23
Midyear Trade Flows: That Other Deficit 8-10-23
State of Trade: The Big Picture Flows 12-18-22