
New Homes Sales Feb 2025: Consumer Mood Meets Policy Roulette
New home sales data offers some relatively positive numbers after a long stretch of rough headlines and revisions across builders.


Put another tariff in the chamber. We can do this…
The day-to-day Trump gyrations around trade wars and product group targeting does not help the homebuyer mood any more than the capex planners or securities markets, but Feb 2025 brought a slight sequential uptick in new home sales and a more positive YoY variance.
Strength in the South as the largest single family market helped at 65% of total, but weakness in the West (21% of total) can be tied to more than wildfires. The Midwest (11%) was solid, and the small Northeast market (3%) was weak.
The brief YTD period on a “not seasonally adjusted” basis showed YTD at -0.2% in new home sales but with the South at +12.4% and the other 3 regions negative.
Completed home sales were up sharply YoY vs. Feb 2024 and completed homes “for sale” are at a 1-year high. That could be stretching inventory at a time when incentives and price cuts might need to ride to the rescue as we have been seeing in recent earnings reports. The spring selling season is now underway.

The above chart updates the long-term time series for single family home sales since the early 1960s with the Feb 2025 tally of 676K ahead of the long-term median and well above the post-June 2009 median. The current number is unsurprisingly well below the housing bubble median of 989K and more in line with the 80s/90s expansion boom years and its 684K median. The trick now is to meet demographic demand that is much higher while homebuyers are facing high prices and a lack of affordable supply in this mortgage rate environment and monthly payment demands.

The above chart updates the mix of total single family home sales captured by new vs. existing home sales. Existing typically dominates in the high 80% range to low 90% area, but the homebuilders have seen their share of total sales rise and currently stands at 13.7% vs. the long-term median of 11.4%.
The pain of high mortgage rates running in a 200 bps range since the fall of 2023 keeps buyers on the fence (or out of the market entirely) in existing home sales as monthly payment pain combined with high home prices keeps many priced out of the market or waiting for lower rates (see Existing Homes Sales Feb 2025: Limping into Spring 3-20-25).
Existing Home inventory for sale has been climbing and counterintuitively running alongside rising prices. Higher supply might be seen as more likely to lower prices but the willingness to move on price and to transact has faced some headwinds with the uncertainty around mortgage rates and the fears around where the cycle (and payroll and wages) are heading. With headlines such as DOGE and the worries that trade wars will cause payroll retrenchment and potential erosion of upward mobility is creating a maelstrom of mixed emotions and weighing on consumer sentiment.
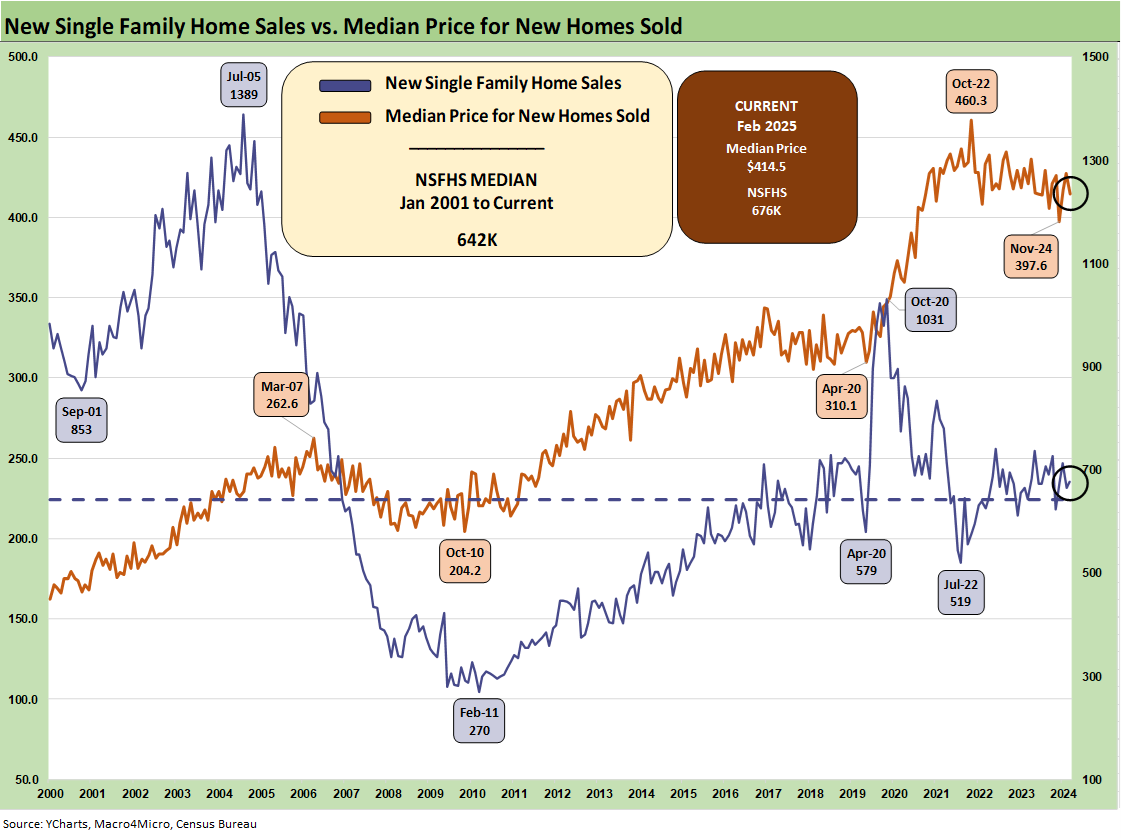
The above two-sided chart shows the sales pattern for the new home sales line since 2000 vs. the median prices. The fact that prices trended higher is not a new topic, but the sensitivity of monthly payments is married to mortgage rates, which remain the primary driver of weaker volume in the lower price tiers in both new and existing sales.
The current $414.5K price ticked down sequentially from a sharply revised (lower) price of $427.4K in Jan 2025. While prices always come with a very big asterisk of regional mix and product tiers, we are starting to get more color from builders on the mixed challenges of cost creep and the need to discount prices or offer incentives. That means margin squeeze.
We also hear that the mortgage buydowns don’t work as well as they used to even when the market was seeing higher mortgage rates. Consumers are doing more than monthly payment math as sentiment weighs in.
Some major builders reported this past week, and we got color on price and margin pressure from Lennar (see Lennar: Cash Flow and Balance Sheet > Gross Margins 3-24-25) and KB Home (see KB Home 1Q25: The Consumer Theme Piles On 3-25-25). The stocks sold off in both cases and guidance was downbeat.

Last month, the spike in the median home price to $446K looked like an outlier. It was revised downward in material fashion to $427.4 K along with the new Feb 2025 price tag of $414.5K. Rising existing home inventory (but still quite low) and builder fears of higher materials and supplier chain costs are not going to do much to relieve homebuilders in their pricing strategies.
The builders need to frame how they can get into a gross margin zone that works, and they know that the expectation of costs can get wagged meaningfully by tariffs. The NAHB has put out some numbers for the average home cost from recent tariffs (over $9K per average home), and we have commented on the NAHB view on tariff distortions in the past. They will be very busy in the coming weeks sorting out what is next. The NAHB published an updated commentary on tariffs this month (see NAHB: How Tariffs Impact the Home Building Industry March 2025).
Homebuilder stocks have been pummeled since the fall (see Footnotes & Flashbacks: Asset Returns 3-23-25), and we can expect a sustained high rate of stock repurchase activity from the builders.

The above chart gives a different visual angle on the median home prices from early 2022. That is a lot of $400K handles with one outlier in Nov 2024. The current $414.5K is now in the lower range of the timeline.
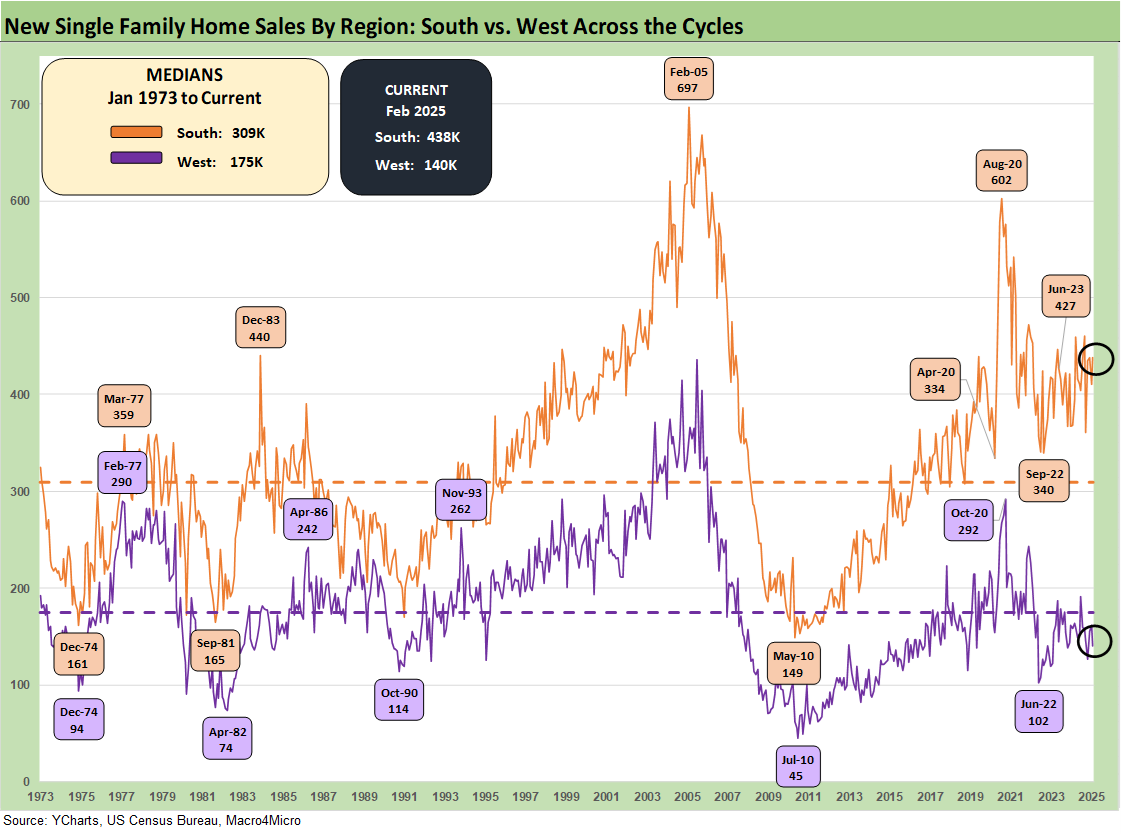
The time series above updates the new single family home sales across the cycles since 1973 for the #1 and #2 regions of the South and the West. The 438K for the South is around 65% of the total of all single family new home sales (SAAR) while the West at 140K is over 21% of the total. For the month, the South was +6.6% sequentially and +19.0% YoY. The West was -13.6% sequentially and -11.4% YoY.

The timeline of new home sales for the smaller Midwest and much smaller Northeast market is detailed above. The Midwest (11% of total) was +20.6% sequentially and +2.7% YoY. The Northeast market (3% of total) was -21.4% sequentially and -48.8% YoY.
See also:
Footnotes & Flashbacks: State of Yields 3-23-25
Footnotes & Flashbacks: Asset Returns 3-23-25
Mini Market Lookback: Fed Gut Check, Tariff Reflux 3-22-25
Fed Action: Very Little Good News for Macro 3-19-25
Housing:
Existing Homes Sales Feb 2025: Limping into Spring 3-20-25
Housing Starts Feb 2025: Solid Sequentially, Slightly Soft YoY 3-18-25
New Homes Sales Jan 2024: Homebuilders Feeling Cyclical Signals? 2-26-25
Existing Home Sales Jan 2025: Prices High, Volumes Soft, Inventory Up 2-21-25
Housing Starts Jan 2025: Getting Eerie Out There 2-19-25
New Home Sales Dec 2024: Decent Finish, Strange Year 1-28-25
Existing Home Sales Dec 2024: Another “Worst Since” Milestone 1-24-25
Housing Starts Dec 2024: Good Numbers, Multifamily Ricochet 1-17-25
Homebuilders:
KB Home 1Q25: The Consumer Theme Piles On 3-25-25
Lennar: Cash Flow and Balance Sheet > Gross Margins 3-24-25
Toll Brothers 1Q25: Performing with a Net 2-20-25
Credit Crib Note: Lennar Corp (LEN) 1-30-25
D.R. Horton: #1 Homebuilder as a Sector Proxy 1-28-25
KB Home 4Q24: Strong Finish Despite Mortgage Rates 1-14-25
Toll Brothers: Rich Get Richer 12-12-24
PulteGroup 3Q24: Pushing through Rate Challenges 10-23-24
KB Home: Steady Growth, Slower Motion 9-26-24
Lennar: Bulletproof Credit Despite Margin Squeeze 9-23-24
Credit Crib Note: PulteGroup (PHM) 8-11-24
Credit Crib Note: D.R. Horton (DHI) 8-8-24
Homebuilders: Updating Equity Performance and Size Rankings 7-11-24
Credit Crib Note: KB Home 7-9-24
Lennar: Key Metrics Still Tell a Positive Macro Story 6-20-24
Credit Crib Note: NVR, Inc. 5-28-24
Toll Brothers: A Rising Tide Lifts Big Boats 5-23-24
Credit Crib Note: Taylor Morrison 5-20-24
PulteGroup: Strong Volumes, Stable Pricing 4-24-24
D.R. Horton: Ramping Up in 2024 Despite Mortgages 4-19-24
D.R. Horton: Credit Profile 4-4-23