
Footnotes & Flashbacks: Credit Markets 3-31-25
The credit markets had a rough finish with a bigger set of risks to absorb this week if Trump moves as signaled.


Just a tariff wave. Shouldn’t be a problem.
A quiet UST curve the past week was joined by a +26 bps wave in HY (+20 bps on Friday alone) for a cumulative +66 bps move wider over the trailing 1-month period.
IG spreads remain well contained in double digits at levels more consistent with credit cycle peaks.
Even after the gap in HY pricing this week, HY spreads are still well inside long-term medians.
The onslaught of ill-conceived, underresearched, and politically hatched tariff plans promise disruptions along the goods chain and could set off too many unintended consequences to make a short list.

The above chart updates the 1-week and 1-month OAS deltas across IG and HY and from the BBB to CCC tier. Given the risk symmetry coming into the year and after reaching close to all-time lows on HY spreads in January at +259 bps, a painful but somewhat orderly decompression wave for spreads was likely. For context, the 1-month tally of +66 bps for HY widening is still outside of the worst 25 spread widening calendar months where 19 months saw triple-digit widening. While the calendar does not favor March 2025 breaching that list, the rolling 30-day could get very ugly soon depending on how this week plays out.
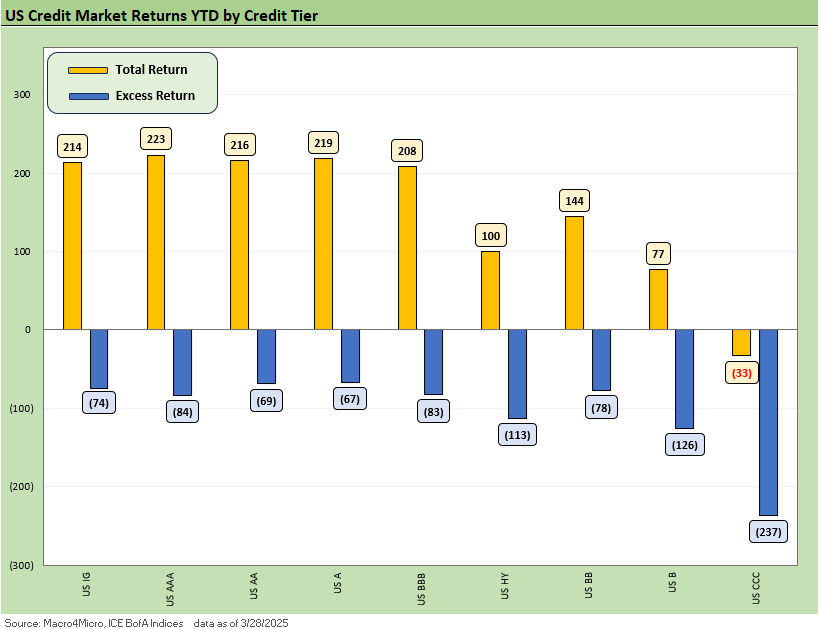
The above chart updates the running YTD total and excess returns for IG, HY, and the credit tiers within each. Excess returns have flipped to all negative across each tier given the spread widening, but duration has kept higher quality tiers still positive on a total return basis.
The CCC tier now registers negative on a total return basis this month with the risk-off sentiment in the market rising with the uncertainty of what tariff levers are pulled and what cascading effects follow.
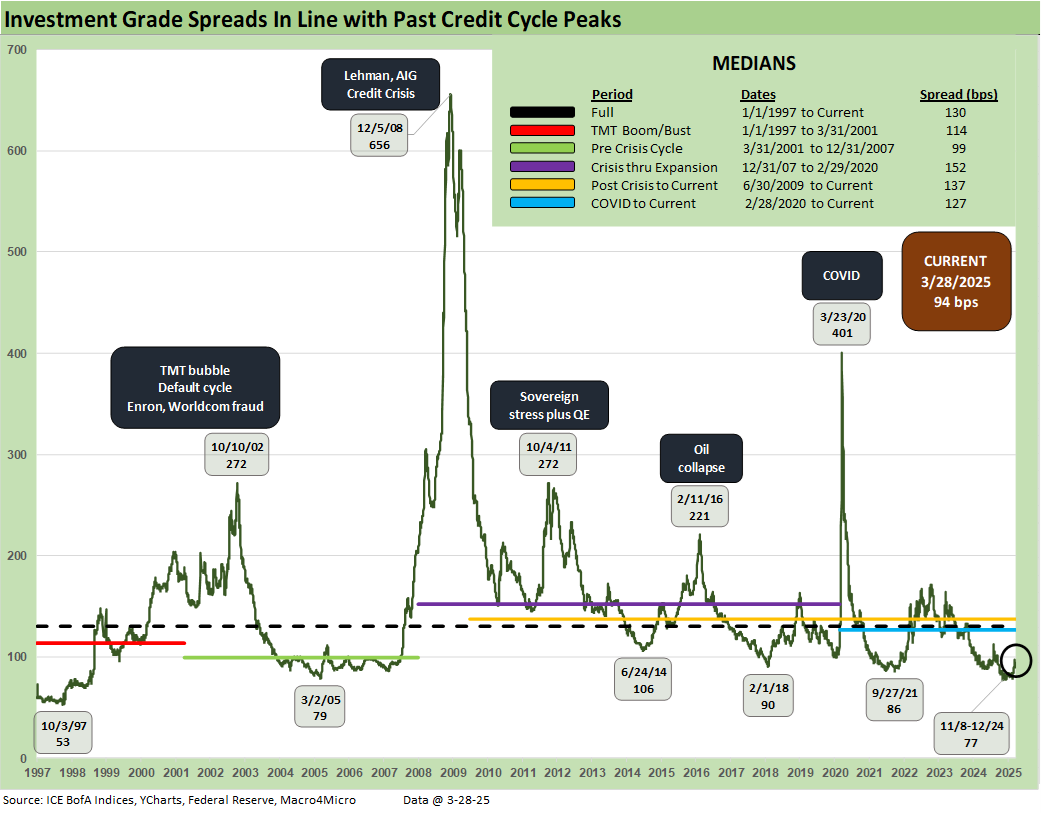
IG spreads held in well again this week with only a +2 bps widening to +94 bps. This level is just ahead of the post-COVID, pre-hiking cycle low of +86 bps in 2021 and still below the June 2014 lows. The nature of the investor base for IG reacts in a more measured way on the day-to-day headline wave, but the final tally on tariff effects and possible stagflation risks could see PMs trim industries most in the crosshairs for direct impact or collateral damage, many of which have large BBB concentrations (Energy, Autos/Manufacturing, Banking, etc.).
In the case of energy there is a lot more going on in basic supply-demand and the role of Russian and OPEC supply, but we never rule anything out these days on reversals of policy (e.g. Canadian crude). Battles in banking could cut across borders also given regulations and restrictions (who can operate where), but the biggest worry would simply be asset quality and funding costs and how those would hold up in a series of global trade wars.
Today’s spread levels are still below all of the longer-term cyclical medians that we track and only after the double-digit move this month are we approaching the pre-Credit Crisis median. Given the increasing size of the BBB market, these IG levels are still relatively calm and have room to decompress before triggering major alarms.

HY widened again this week to the tune of +26 bps, continuing the fast paced widening this month as the jitters set in and the January low of +259 bps is now squarely in the rearview mirror. Even after +60 bps of MTD widening, these levels are still not too far from past cyclical lows. HY spreads can move wider in a hurry as the bad news rolls in and more investors might decide to switch gears from income-generation to downside risk mitigation. As we said above, the risk symmetry still leaves plenty of room for spreads to move wider with current levels still well below longer-term medians.

The HY-IG OAS differential marks the spread pickup for stepping down the broader quality spectrum. The risk repricing trend has moved the needle another +24 bps this week and away from such compressed quality spread levels. We still see the quality spread decompression risk as high given that the nature of the next repricing leg in reaction to tariffs and headline uncertainties will continue to follow a bottom-up decompression wave.
Those “headlines” are now getting closer to the point where it is no longer just speculation and debate but instead is now reaching the transaction level that flows into revenues, earnings, and cash flow at the company level as well as making its way into the lagging economic releases. It now “gets real.” The 1Q25 earnings season will see some intensive Q&A and perhaps a wave of new guidance revisions.

The BB-BBB OAS differential tracks the spread pickup as we step down across the IG/HY divide. The stark difference this week is between BBB and BB seeing widenings of +3 bps and +22 bps, respectively. That move leaves the BB vs. BBB differential another +19 bps wider this week. Rhyming with the themes above, the differential is now higher than several of the cyclical lows seen in recent months but also still under the longer-term medians.

The BB OAS is covered above and shows the slow march up from the lows to +221bps after the +22 bps of widening this week. For these bonds that still have the moniker of high yield, a rapid decompression move could make for another round of buying opportunities vs. BBB subject to any outsized selling pressure at the issuer specific level.

The B tier is the sweet spot of the “HY classic” investor, so the +32 bps widening on the week and +72 bps MTD is sending some signals that risky credit markets do not like the direction of what they are seeing. If an OTC market gets defensive down the credit tiers, it can often be the equity price action that is having some influence. In this case, we are heading into a week with monumental stakes for global trade, supplier chains, and possible stagflation effects. In theory, headlines can shake up an already rattled consumer sector and the propensity to spend and “drop the card.” The spread widening is about more than equity correlation.
We could be at an inflection point in the cycle with the tone out of Washington that has shifted from “seller pays the tariff” and “tariffs do not cause inflation” to basically “it is worth the cost” and the White House “does not care” if car prices go up. That will set off ugly dialogues that are not consumer confidence builders. Social Security and Medicaid rhetoric also can tilt consumer sentiment when it strikes closer to pocketbook issues.

The B vs. CCC tier is plotted above. The timeline for B and CCC spreads highlights the points of major divergence along the way (see The B vs. CCC Battle: Tough Neighborhood, Rough Players 7-7-24). The current CCC tier OAS at +888 bps is moderately inside the long-term median of +953 bps. There is ample reason to expect a multifront global trade war and unprecedented scale and breadth of tariffs to be another moment of B vs. CCC divergence.

The shorter timeline from early 2022 gives better granularity on the more recent swings in the B and CCC tier across a market that saw a rare inflation spike and Fed inflation-fighting cycle. That came ahead of a rally that saw spreads overall in HY get back to June 2007 bubble levels as we have been covering.
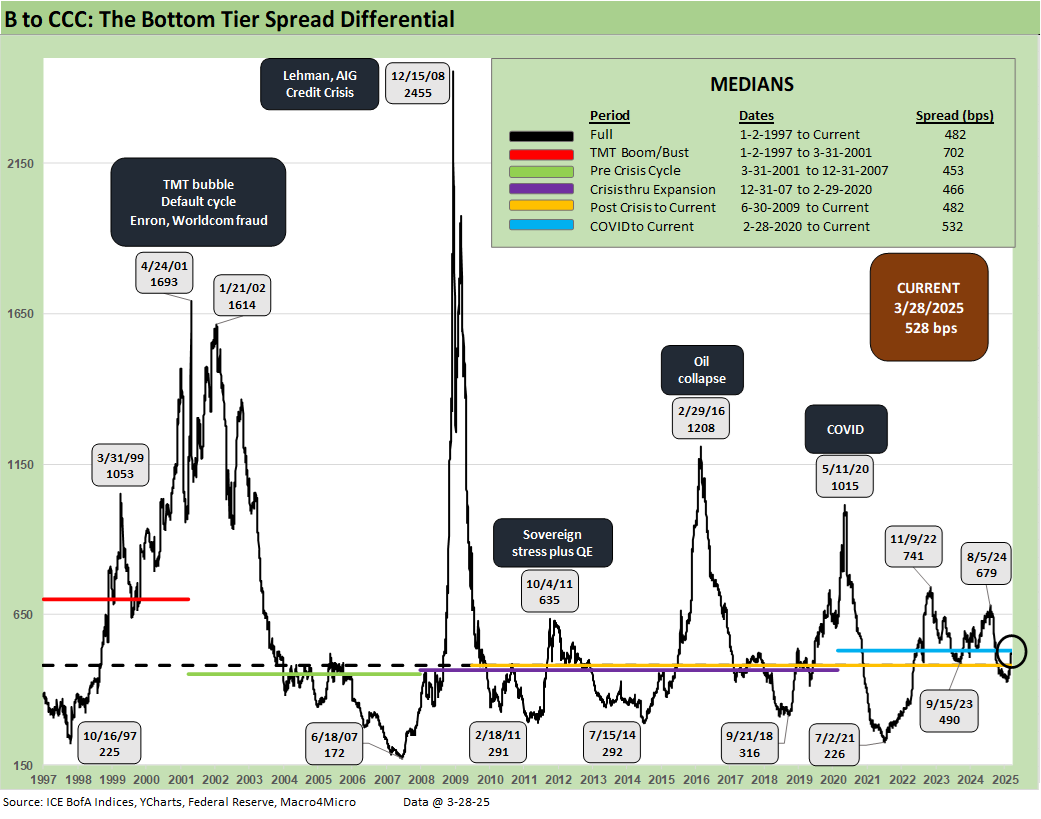
The B vs. CCC tier quality spread differential is detailed above. The current +528 bps is now wide to the long-term median and slightly below the median from the onset of COVID (Feb 2020) through current times. The “CCC OAS minus B OAS” quality spread differential is wide to most of the medians above with the glaring exception of the TMT implosion in 2000-2001.
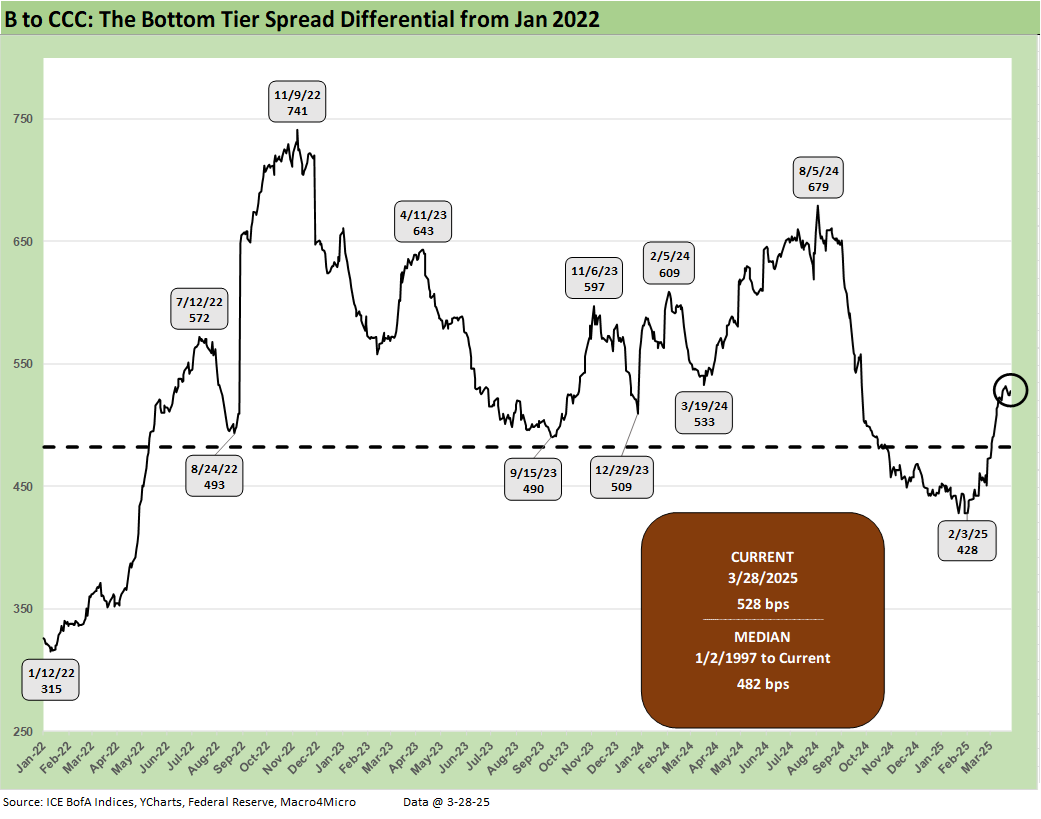
We shorten the timeline to a Jan 2022 start date to give better visuals on more recent trends. The “CCC minus B” differential has gapped wider by 100 bps since early Feb 2025 to the current +528 bps.
A look at yields…

Moving away from spreads, which are still compressed in the longer-term picture, yields for both IG and HY have a more complex story in historical context given the post-crisis distortions of ZIRP and “normalization.” The normalization period of Dec 2015 to Dec 2018 never really got on track with the economic weakness and Fed easing of 2019 followed by a COVID crisis and return to ZIRP in Mar 2020.
The current IG YTW at 5.15% is below the 6.1% pre-ZIRP median while HY YTW rose this week to 7.66% vs. a pre-ZIRP 9.3% mark. We consider the pre-ZIRP years the most rational frame of reference in light of the post-crisis ZIRP and QE as well as the COVID Fed reactions.
Spreads will remain a key swing factor for reaching those yield medians of pre-ZIRP years, but we never can ignore major variables that could drive UST levels and the slopes along the shapeshifting UST curve. The moves from inversion to modest steepening beyond 2Y alongside inversion from the short end opens up a lot of scenarios ahead. More FOMC easing with a bear steepener on stagflation and supply fears are among them. We have seen a bear steepening from 2Y to 30Y since the end of 2023, and the next migration move will be a key driver of bond returns for UST and IG. HY will be wagged more by spreads.
In this current market, the UST curve is a very critical wildcard since we have a rare debate unfolding over recession vs. stagflation. That decision point for asset allocators has not been a front burner decision since the early 1980s when the actively traded IG and HY bond market was still in its formative years.

The above frames current IG index yields vs. previous credit peaks along with their respective UST curves. We include both prior credit peaks in June 2007 and Dec 1997 for context as prior peak credit cycles when high risk appetites saw investors chasing yields. Those 1997 and 2000 markets saw poor risk symmetry and low spreads.
Today’s curve is still low in those historical contexts. With stagflation risks back in the mix, the next stretch could see long yields rise as spreads widen out for renewed return pain. The short to intermediate IG market is nonetheless the safest bond game for now. The asset class constrained to HY can take refuge in the higher quality layers.

The final chart replicates the same drill but for HY index yields. A low UST curve vs. history and still tight spreads puts the current HY index yield still below prior peak credit cycles. The volatility and major spread moves across the 1997-98 and 2007-08 periods are reminders of how fast the risk repricing move can happen with spreads seeing triple-digit widening months. That was true in earlier cycles as well. During 1990, securities firms started to collapse including a Drexel Chapter 11 in Feb 1990 and bridge loan related bailouts of then-Shearson Lehman, First Boston, and Kidder Peabody.
The summer of 2007 was the start of major problems in the credit markets, but the equity markets and S&P 500 and NASDAQ kept on rallying into Oct 2007. Later in the turmoil and well after the fact, the start of the recession was tagged as Dec 2007 (see Business Cycles: The Recession Dating Game 10-10-22).
The 2007 experience reminded the market that credit leads the cycle and equity lags. The same was true in 1999 with the HY default cycle underway and NASDAQ at +86% that year.
See also:
Footnotes & Flashbacks: State of Yields 3-30-25
Footnotes & Flashbacks: Asset Returns 3-30-25
Mini Market Lookback: The Next Trade Battle Fast Approaches 3-29-25
PCE Feb 2025: Inflation, Income, Outlays 3-28-25
Auto Tariffs: Questions to Ponder 3-28-25
4Q24 GDP: The Final Cut 3-27-25
Durable Goods February 2025: Preventive Medicine? 3-26-25
New Homes Sales Feb 2025: Consumer Mood Meets Policy Roulette 3-25-25
KB Home 1Q25: The Consumer Theme Piles On 3-25-25
Lennar: Cash Flow and Balance Sheet > Gross Margins 3-24-25
Footnotes & Flashbacks: Credit Markets 3-24-25
Footnotes & Flashbacks: State of Yields 3-23-25
Footnotes & Flashbacks: Asset Returns 3-23-25
Mini Market Lookback: Fed Gut Check, Tariff Reflux 3-22-25
Existing Homes Sales Feb 2025: Limping into Spring 3-20-25
Fed Action: Very Little Good News for Macro 3-19-25
Industrial Production Feb 2025: Capacity Utilization 3-18-25
Housing Starts Feb 2025: Solid Sequentially, Slightly Soft YoY 3-18-25
Retail Sales Feb 2025: Before the Storm 3-17-25
Mini Market Lookback: Self-Inflicted Vol 3-15-25
Credit Spreads: Pain Arrives, Risk Repricing 3-13-25
CPI Feb 2025: Relief Pitcher 3-12-25
JOLTS Jan 2025: Old News, New Risks in the Market 3-11-25
Credit Spreads Join the Party 3-10-25
Mini Market Lookback: Tariffs Dominate, Geopolitics Agitate 3-8-25
Payrolls Feb 2025: Into the Weeds 3-7-25
Employment Feb 2025: Circling Pattern, Lower Altitude 3-7-25
Gut Checking Trump GDP Record 3-5-25
Trump's “Greatest Economy in History”: Not Even Close 3-5-25
Asset Returns and UST Update: Pain Matters 3-5-25
Mini Market Lookback: Collision Courses ‘R’ Us 3-2-25
Tariff and Trade links:
Auto Tariffs: Questions to Ponder 3-28-25
Fed Gut Check, Tariff Reflux 3-22-25
Tariffs: Strange Week, Tactics Not the Point 3-15-25
Trade: Betty Ford Tariff Wing Open for Business 3-13-25
CPI Feb 2025: Relief Pitcher 3-12-25
Auto Suppliers: Trade Groups have a View, Does Washington Even Ask? 3-11-25
Tariffs: Enemies List 3-6-25
Happy War on Allies Day 3-4-25
Auto Tariffs: Japan, South Korea, and Germany Exposure 2-25-25
Mini Market Lookback: Tariffs + Geopolitics + Human Nature = Risk 2-22-25
Reciprocal Tariffs: Weird Science 2-14-25
US-EU Trade: The Final Import/Export Mix 2024 2-11-25
Aluminum and Steel Tariffs: The Target is Canada 2-10-25
US-Mexico Trade: Import/Export Mix for 2024 2-10-25
Trade Exposure: US-Canada Import/Export Mix 2024 2-7-25
US Trade with the World: Import and Export Mix 2-6-25
The Trade Picture: Facts to Respect, Topics to Ponder 2-6-25
Tariffs: Questions to Ponder, Part 1 2-2-25
US-Canada: Tariffs Now More than a Negotiating Tactic 1-9-25
Trade: Oct 2024 Flows, Tariff Countdown 12-5-24
Mexico: Tariffs as the Economic Alamo 11-26-24
Tariff: Target Updates – Canada 11-26-24
Tariffs: The EU Meets the New World…Again…Maybe 10-29-24
Trump, Trade, and Tariffs: Northern Exposure, Canada Risk 10-25-24
Trump at Economic Club of Chicago: Thoughts on Autos 10-17-24
Facts Matter: China Syndrome on Trade 9-10-24
Tariffs: Questions that Won’t Get Asked by Debate Moderators 9-10-24
The Debate: The China Deficits and Who Pays the Tariff? 6-29-24
Trade Flows: More Clarity Needed to Handicap Major Trade Risks 6-12-24
Trade Flows: Deficits, Tariffs, and China Risk 10-11-23
Midyear Trade Flows: That Other Deficit 8-10-23
State of Trade: The Big Picture Flows 12-18-22
Select Histories:
Annual and Monthly Asset Return Quilt 2024 Final Score 1-02-25
Spread Walk 2024 Final Score 1-2-25
HY and IG Returns since 1997: Four Bubbles and Too Many Funerals 12-31-24
HY OAS Lows Memory Lane: 2024, 2007, and 1997 10-8-24
The B vs. CCC Battle: Tough Neighborhood, Rough Players 7-7-24
HY Spreads: Celebrating Tumultuous Times at a Credit Peak 6-13-24
Credit Markets Across the Decades 4-8-24
Credit Cycles: Historical Lightning Round 4-8-24
Histories: Asset Return Journey from 2016 to 2023 1-21-24
HY Multicycle Spreads, Excess Returns, Total Returns 12-15-23
HY Credit Spreads: Migration, Medians, and Misdirection 11-6-23
Credit Spreads: Proportions Matter in Risk Compensation 8-14-23
Fed Funds vs. Credit Spreads and Yields Across the Cycles 6-19-23
Wild Transition Year: The Chaos of 2007 11-1-22
Greenspan’s Last Hurrah: His Wild Finish Before the Crisis 10-30-22
 |
|