
Housing Starts Feb 2025: Solid Sequentially, Slightly Soft YoY
We look at some of the moving parts for starts, construction, and completions as the spring selling season starts.


Make America’s lumber cost more.
Feb 2025 single family starts had a nice rebound of +11.4% MoM but -2.3% YoY as the peak spring selling season kicks off. The nuances of working capital management planning and inventory moves ahead of tariffs brings some speculation that overlaps with the relative confidence in volumes ahead and where mortgage rates take the markets.
Total permits were negative YoY and MoM for both total housing units (YoY -6.8%, MoM -1.2%) and single family (-3.4% YoY, -0.2% MoM). Housing units under construction were down YoY across all 4 major regions and in total (-14.8% total, -6.7% single family). Permit % changes were very low MoM with mixed positive/negative MoM by region. Single family completions were positive MoM in all 4 regions but with the important South region (54% of total) down -10% YoY. That all adds up to a case of YoY caution with some inventory building ahead of the tariff storm.
We looked at the granular line items for “sales costs” and “construction costs” for a typical new home in last month’s starts commentary (see Housing Starts Jan 2025: Getting Eerie Out There 2-19-25). That is a chart worth a fresh look and recurring review as we move into uncharted tariff territory for the modern economy. The tariffs are a net negative for homebuilding costs and thus prices unless builders eat the cost. Builders have pricing power, so it will be passed on.
The sad state of affairs for potential homebuyers is that the election promises from both parties to focus on more affordable homes for entry level and first-time buyers has been greeted this peak selling season by policies that will cause widespread, material cost cost increases. That applies to many items on the menu from lumber and metals to downstream items such as appliances that will also be impacted by tariffs (e.g. aluminum). The labor cost wildcard for subcontractors on deportation (deported by ICE, hiding, already self-deported, etc.) lacks visibility at this point.

The above chart updates single family home starts. We see a tally of 1108K for Feb 2025. As we cover in the bullets above, the overall MoM profile is respectable, but YoY is overall showing a downward bias across a mix of metrics in the starts release (includes permits, under construction, completions) .
The 1108K for single family starts is modestly above the long-term median and slightly below the Bull Market Expansion timeline (basically the 1980s/1990s) in the median box in the chart. The1108K is well below the 1312K median of the housing boom but running well ahead of the post-crisis (Jan 2009 to current) median of 783K.
Looking at single family start numbers still comes with the asterisk of demographics and a record number of people needing a door to close behind them at night. In other words, running around the long-term median does not meet today’s demographic need. That is where the mix of sales (new vs. existing/resale), geographic regional mix, and the buy vs. rent and multifamily variables come into play.
The easy and obvious conclusion is that there is not enough supply in affordable housing, entry level product, and product to meet first-time buyer needs. Mortgages are certainly not helping.
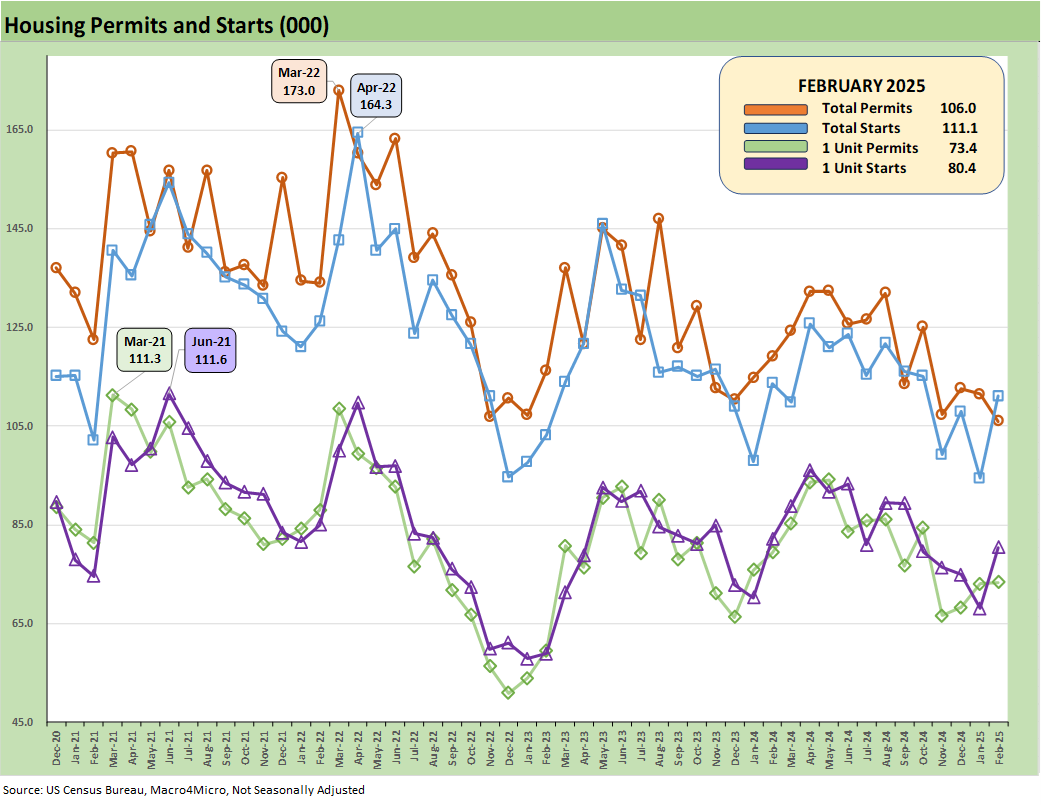
The Not Seasonally Adjusted (NSA) Starts and Permits are posted above for Total and for Single Family only. We see both Total Starts and Single Family starts up sharply in Feb 2025 vs. Jan 2025.
Permits are lower for Total and essentially flat for Single Family. The builders know there is plenty of excess demand in the market, but they know better at this point than to try and predict mortgage rates that have swung in a 200 bps range since fall 2023. Mortgages have been friendlier in the mid 6% range after running to 7% after the Sept 2024 lows near 6.0% (see Footnotes & Flashbacks: State of Yields 3-16-25).

The above chart updates Single Family Starts by region on a Not Seasonally Adjusted (NSA) basis. The dominant South region is higher along with the West. The smaller Midwest region is down, and the very small Northeast market is higher.
The West will be one to watch in coming months for obvious reasons as the rebuilding plans develop. They will face higher costs from tariffs as that rebuilding process begins.
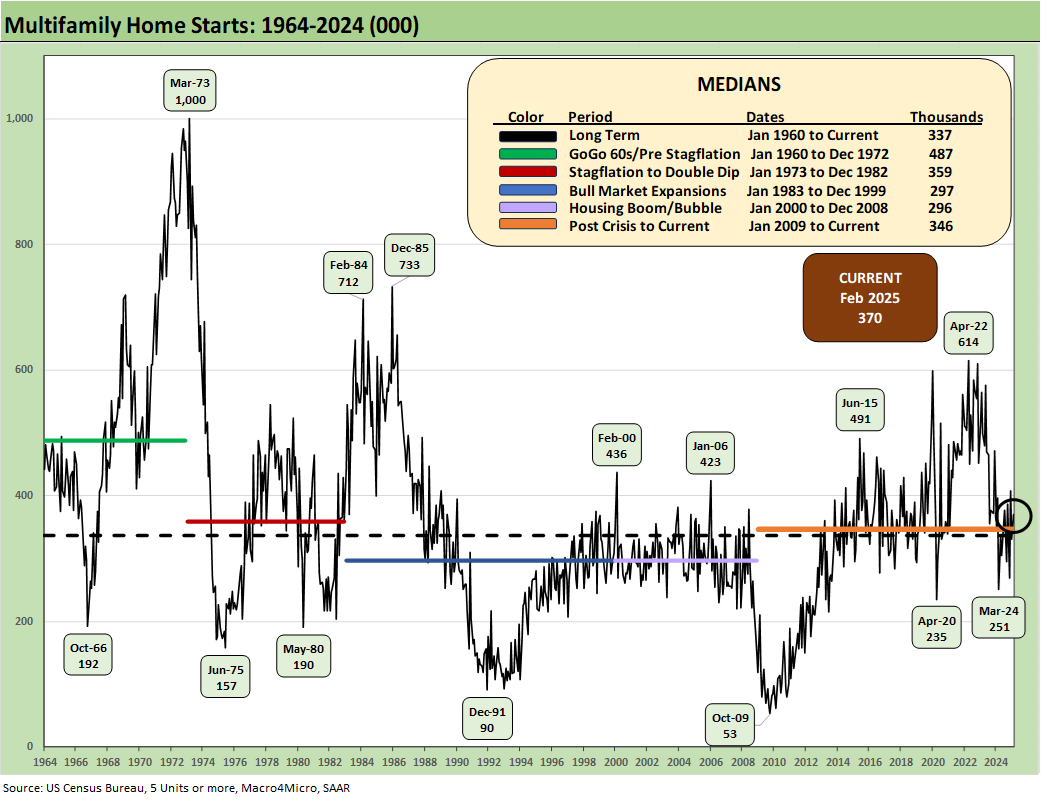
The above chart updates running Multifamily starts. At +370K, Feb 2025 is up by 12.1% sequentially but down by -6.6% YoY. The 370K is above the long-term median of 337K, above the median from Jan 2009 to current (346K), and above the median from 2000 to 2008 (296K). The 1960s was a boom period for multifamily with the postwar explosion of urbanization.
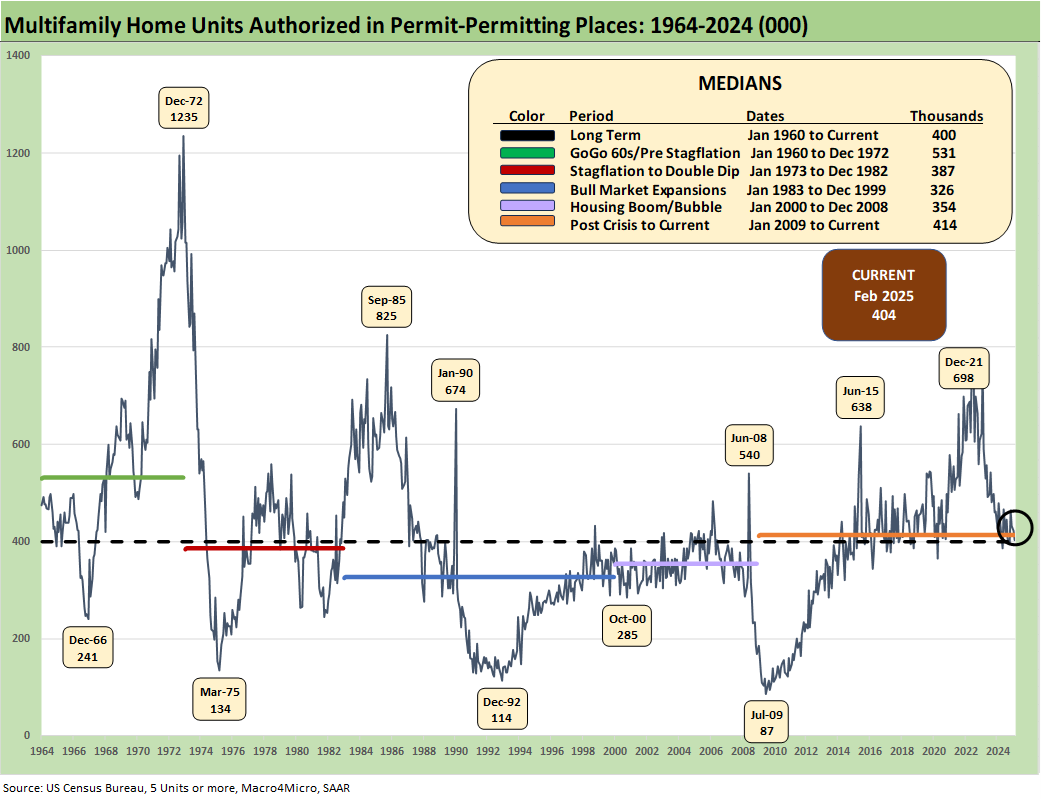
The above chart updates Multifamily permits. The 404K is down by -4.3% from Jan 2025 MoM and down -15.7% YoY. The YTD change on an NSA basis (not shown) is -11.1%.
See also:
Footnotes & Flashbacks: Credit Markets 3-17-25
Footnotes & Flashbacks: State of Yields 3-16-25
Footnotes & Flashbacks: Asset Returns 3-16-25
Mini Market Lookback: Self-Inflicted Vol 3-15-25
Credit Spreads: Pain Arrives, Risk Repricing 3-13-25
Trade: Betty Ford Tariff Wing Open for Business 3-12-25
CPI Feb 2025: Relief Pitcher 3-12-25
JOLTS Jan 2025: Old News, New Risks in the Market 3-11-25
Credit Spreads Join the Party 3-10-25
Housing:
New Homes Sales Jan 2024: Homebuilders Feeling Cyclical Signals? 2-26-25
Existing Home Sales Jan 2025: Prices High, Volumes Soft, Inventory Up 2-21-25
Housing Starts Jan 2025: Getting Eerie Out There 2-19-25
New Home Sales Dec 2024: Decent Finish, Strange Year 1-28-25
Existing Home Sales Dec 2024: Another “Worst Since” Milestone 1-24-25
Housing Starts Dec 2024: Good Numbers, Multifamily Ricochet 1-17-25
Homebuilders:
Toll Brothers 1Q25: Performing with a Net 2-20-25
Credit Crib Note: Lennar Corp (LEN) 1-30-25
D.R. Horton: #1 Homebuilder as a Sector Proxy 1-28-25
KB Home 4Q24: Strong Finish Despite Mortgage Rates 1-14-25
Toll Brothers: Rich Get Richer 12-12-24
PulteGroup 3Q24: Pushing through Rate Challenges 10-23-24
KB Home: Steady Growth, Slower Motion 9-26-24
Lennar: Bulletproof Credit Despite Margin Squeeze 9-23-24
Credit Crib Note: PulteGroup (PHM) 8-11-24
Credit Crib Note: D.R. Horton (DHI) 8-8-24
Homebuilders: Updating Equity Performance and Size Rankings 7-11-24
Credit Crib Note: KB Home 7-9-24
Lennar: Key Metrics Still Tell a Positive Macro Story 6-20-24
Credit Crib Note: NVR, Inc. 5-28-24
Toll Brothers: A Rising Tide Lifts Big Boats 5-23-24
Credit Crib Note: Taylor Morrison 5-20-24
PulteGroup: Strong Volumes, Stable Pricing 4-24-24
D.R. Horton: Ramping Up in 2024 Despite Mortgages 4-19-24
D.R. Horton: Credit Profile 4-4-23