
Mini Market Lookback: Tariffs Dominate, Geopolitics Agitate
The past week foreshadows a lot more to come in macro noise, unnerving economic signals and micro trigger points.


The US market saw all the major benchmarks from small caps to large caps in the red, 10 of 11 S&P 500 sectors negative, and 6 of the 7 bond ETFs we track in the red as tariffs roil the markets.
The 32 benchmarks and ETFs we track weighed in at 5-27 with Regional Banks (KRE) in dead last and Financials (XLF) 3 off the bottom with the E&P ETF (XOP) in the bottom 3.
The bottom quartile performers included the Russell 2000, Midcaps, the broad Energy ETF (XLE), and Transports (XTN). That is a vote of no confidence in how the cycle will behave with these tariffs.
After the prior week’s rally in the UST on cyclical anxiety, this week saw a bear steepener move as confusion reigns on whether “stag” or “flation” or both will start rearing their ugly heads. The full tariff visibility needs a lot more to happen and more certainty in policies.
CPI and Consumer Sentiment are coming this week with the following week much busier including the FOMC meeting and dot plot.
QUOTE OF THE WEEK
From Trump on Truth Social: “After speaking with President Claudia Sheinbaum of Mexico, I have agreed that Mexico will not be required to pay Tariffs on anything that falls under the USMCA Agreement. This Agreement is until April 2nd.”
The above quote captures the essence of the tariff problem in Washington and for the broader US, North America, and Global economies. The quote basically says: “2+2= whatever I want it to be.” Trump is once again stating in print that Mexico pays the tariff or “seller pays.” The buyer/importer in the US pays the tariff.
The Trump theme of “seller pays” would just be one more public embarrassment if the tariffs did not promise to materially impact costs to corporations (who fully know the “buyer pays”). These costs will need to be “eaten” in lower profit margins, offset by other cost reductions (hold that thought on future payrolls), or passed along in the form of price increases.
Some of the tariff apologists on the Econ PhD circuit are helping talk around the “inflation” hot button by saying “it is not inflationary as a monetary issue.” Of course, the apologists will not say clearly whether it is “a decrease in purchasing power.” Life as an economist wordsmith is not easy! All the consumer needs is a massive one-time household earnings increase to go with the one-time massive tariff impact. You can dance around it with assumptions on seller pricing strategies and currency trends but the tariff % is a reality.
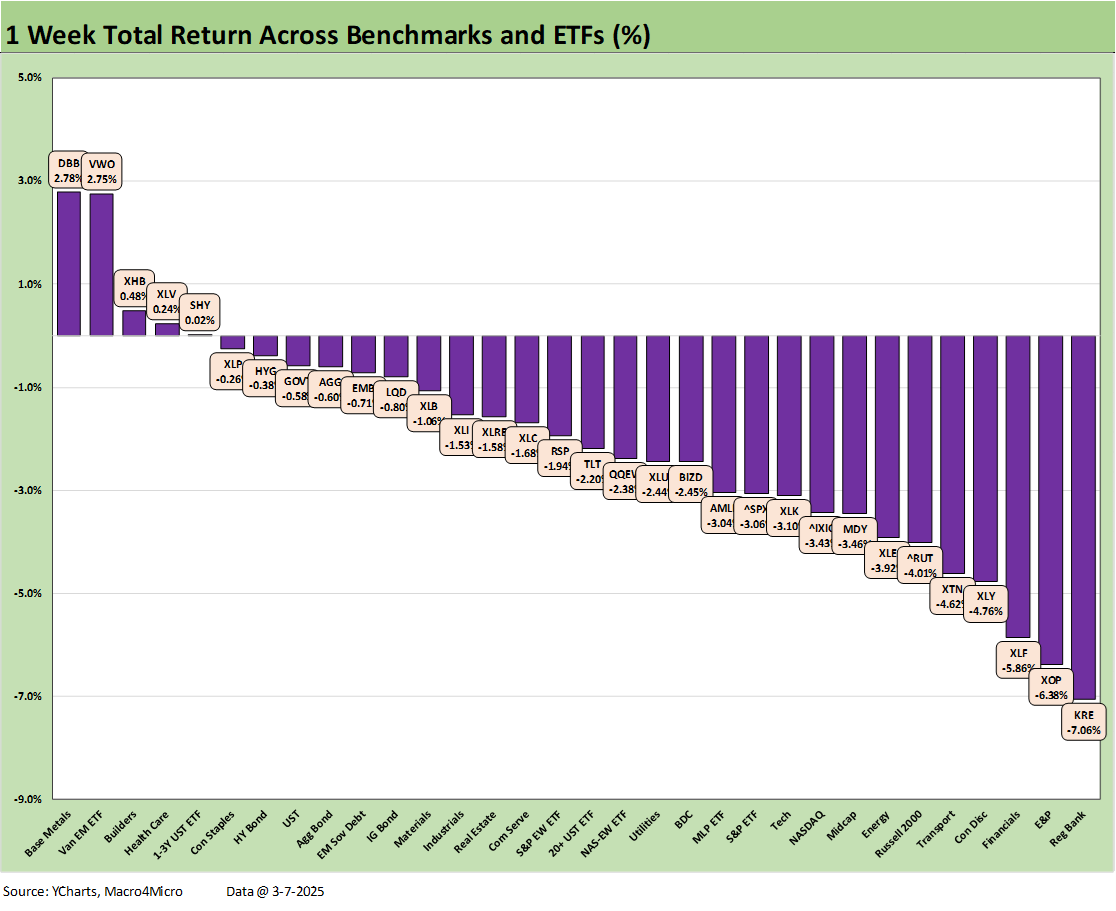
The chart on the 32 benchmarks and ETFs for the past week tells a simple enough story. The score of 5-27 was grim. Only 2 of the 5 were above +1%. In the positive range, we see optimistic China flavor (5% GDP growth targets) in EM Equities (VWO) and the Base Metals ETF (DBB) with a mixed read on who wins and loses in metals. The DBB constituents include an odd mix of copper, aluminum, zinc, and high-quality UST and agencies.
We saw a minimal positive number in the Homebuilding ETF on lower mortgage rates and some market debates on valuation after the builder share beatdown in recent months. We see Healthcare (XLV) and the short UST 1-3Y ETF (SHY) very slightly positive.
The asset returns for the week are rejecting the tariff sales pitch Trump 2.0 has been running as a MAGA shell game. The tariff story is working the same playbook that has been around since Trump 1.0. That had been built around the Trump assertion that he “collected billions and billions from China.” To admit the “buyer pays” now would be de facto confession to an egregious lie and undermining the foundation of what is a cornerstone economic policy of Trump 2.0.
For Bessent, he finesses his way around the buyer pays topic by essentially saying “China will cut prices to erase the tariff impact.” Of course, he avoids stating that Canada, Mexico, and the EU will eat the cost. After all, the EU and USMCA partners will not cut prices and all trade partners will in fact retaliate (including China).
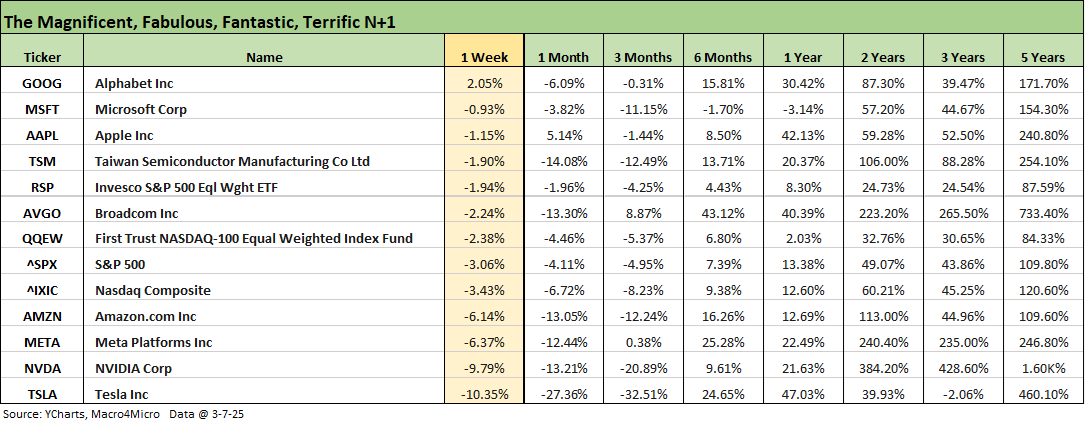
The response of the tech bellwethers and benchmarks as detailed in the above table has been fairly grim over the past 1-week, 1-month, and 3-months time horizons. As a reminder, we line them up above in descending order of returns for the past week. We see one positive for the week (Alphabet), 1 positive for the month (Apple) and 2 positive for 3-months (Broadcom, Meta).
Tesla has been getting crushed as the interest of many millions of potential consumers including current owners gets second guessed. The Musk brand in Europe has taken a hit. We will see how the pickup truck and Redman-chewing tobacco audience feels about a high-cost Tesla purchase in coming years. We think they stick with the pickup.

The questions around how the UST curve is supposed to behave in stagflation scenarios are part of the debate. The more routine question is what the UST will look like in a soft-landing/low-inflation backdrop with record UST issuance. There is no hiding from the stagflation discussion. If the promised growth sees confidence undermined by erratic policy uncertainty of this scale, it is easy to push the “pause button” on corporate capex, M&A, and consumer big ticket items.
The joy and psychic reward that Trump feels in watching global leaders squirm and industry leaders come hat-in-hand does not fuel confidence and can even stoke enmity and spite. Insulting nations and their leaders can work against the self-interest of the nation doing the provoking. Trump appears to have his own March of Folly band by inspiring countries and their citizens to tie patriotism to retaliation. The embrace of austerity to “get even” has plenty of history.
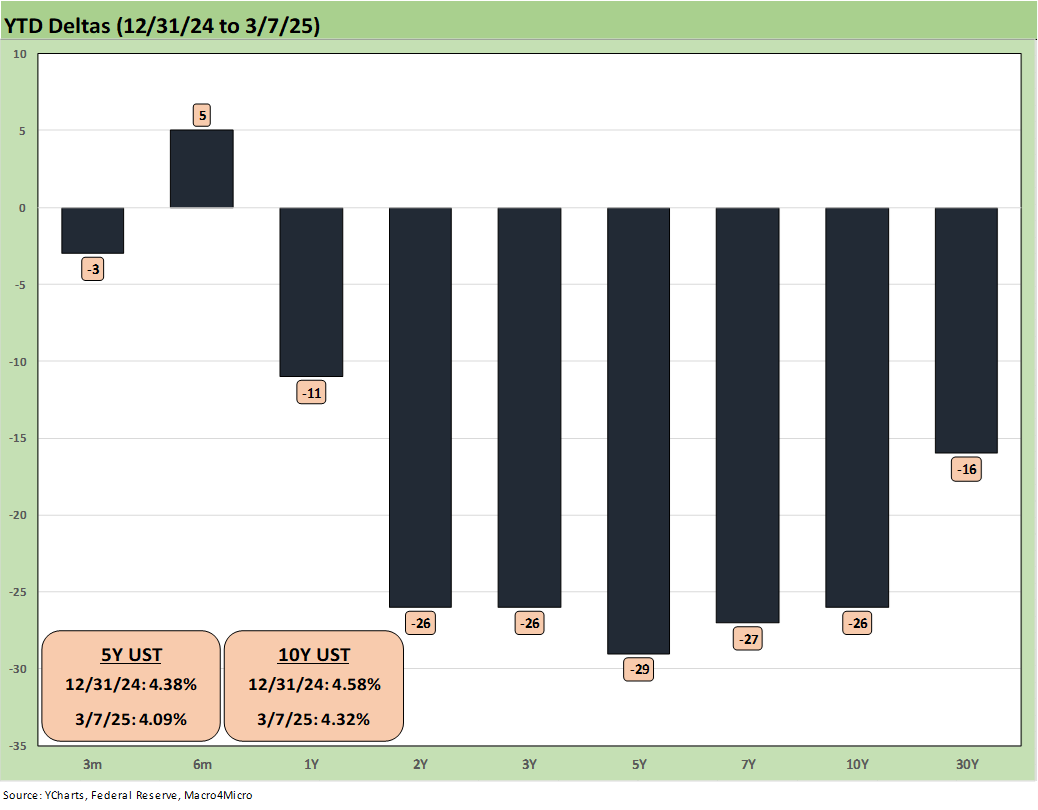
The above chart updates the YTD UST delta trends. We are still in a YTD bull flattener mode even if this past week reverted to steepening.

A revealing time horizon look at the UST curve shifts since the Oct 2023 peaks underscores what is at stake in the next leg of the price action. The impressive rally from 10-19-23 (peak date on 10Y UST) into yearend 2023 was a dazzling move that also saw risk rallies in equities and credit (see UST Yields: Sept 2024 UST in Historical Context 2-17-25).
During 2024, the UST action defied consensus and rolled into more than a little confusion with an initial bear steepener (see Footnotes & Flashbacks: State of Yields 6-30-24). That was before some relief in Sept 2024 with the start of the easing cycle and then a flip back into a bear steepening.

The above chart updates the running time series for the 10Y UST and the Freddie Mac 30Y mortgage benchmark, which this past week declined to 6.63% from 6.76% and bucked the modest rise in the 10Y UST.
Stagflation strategies creeping into the discussions…
At this juncture, the stagflation game plan for UST curve positioning is a more frequent discussion. First, you need to see the “stag” coming and the risk of “flation” ahead. The market has not been through a stagflation event since the 1979 inflation spike rolled into a massive tightening cycle and double dip recession in the Volcker years of 1980-1982. That was a radically different backdrop, inflation was at a multiple of today, and there were waves of structural changes unfolding in the broader economy (see UST Moves 1978-1982: The Inflation and Stagflation Years 10-18-23).
The changes back then ran the full gamut across global competitiveness (e.g. Japan in autos) to less regulated markets that brought cutthroat competition (airlines, transportation broadly, financial services, etc.). That market was more a bank lending and private placement (insurance portfolios) market in those days. After 1979-1982, the process was ugly in sectors from airlines to steel to mining among others.
Currencies and interplay with tariffs have a mixed history of “policy pitches.”
The challenges to global currency frameworks and relationship with trade were hot items of their own on the way to the Plaza Accord of 1985. Those currency issues are topics for another day, but the relationship of trade partner currency reactions to tariffs and what that all means to the cost to US dollar buyers raises a raft of issues.
The strong dollar offset to tariffs was a big issue back during the BAT Tax proposal from Ryan/Brady in 2017. The idea was that the cost to the US buyer would be fully offset. They even wheeled out an academic to help rationalize a 20% tax on all imports (aka tariffs) to replace income taxes.
It is always interesting to look back at some of the ideas and see the parallels:
From Cato Institute: “Congressmen Ryan and Brady claim the BAT will “level the playing field” which, in the plain English of Boston University economist Larry Kotlikoff, means “reducing the U.S. trade deficit.” The tax is also projected to raise $1 trillion over the next ten years. In other words, a “free lunch” that will pay for itself.”
That sounds familiar in parts.
I recall writing about it at the time (I thought it was simplistic, assumption-dependent idiocy), but it was killed by the Senate. It was easy to punch holes in the idea at sea level. It was easy to frame how lame the assumptions were on currency offsets in proportion to a wide range of trade partners with different currencies. It also seemed to ignore dollar denominated imports in the story line.
It is worth looking back at these debates again. They wheel out theories to talk around major problems in the operational trenches – like the current tariff plans. The “cost of being wrong” on the 30,000-foot theory can be fatal to a business that has to operate at sea level and the same for their employees.
We have one question from the BAT Tax days that applies today. It revolves around “currency-adjusted tariff costs” and always bothered me on what it meant for US investment. The question is:
If the trade partners targeted see the dollar spike in relative terms, why would the seller or supplier relocate to the US and spend all those capex dollars and take the policy risks of what the “next guy” (party change) will do? After all, they are still the seller but from a weaker currency market.
The other question/variable is that a strong dollar undermines the export market even as trade partners are also retaliating. Listening to Trump explain the currency and manufacturing cost dynamics would be “interesting.” He might be at risk of having to use an actual number and graduate from adjectives. He just “talks at people” and ignores the question. Bessent wheeled out the exchange rate offset in some of his tariff PR marketing blitz. It sounded a lot like the BAT pitch from 2017 on risk-free tariffs.
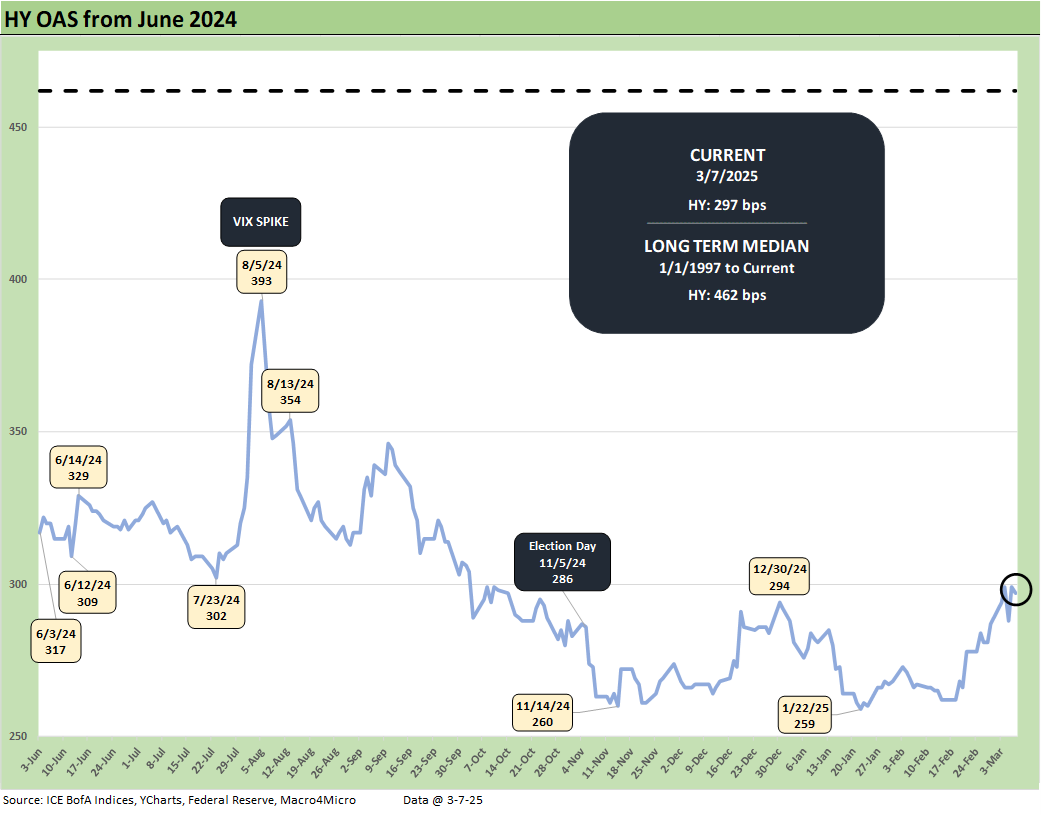
The above chart updates HY OAS with a +10 bps widening to +297, which keeps HY OAS in the June 2007 band (barely) when the month end HY OAS was +298 bps.

The above chart updates the HY-IG quality spread differential which rose by +9 bps this past week with IG rising only by +1 bps and HY by +10 bps.

The BB OAS minus BBB OAS quality spread differential is updated above with the quality spread rising by +4 bps with the BB tier +5 bps wider and BBBs +1 bps wider.
See also:
Payrolls Feb 2025: Into the Weeds 3-7-25
Employment Feb 2025: Circling Pattern, Lower Altitude 3-7-25
Tariffs: Enemies List 3-6-25
Gut Checking Trump GDP Record 3-5-25
Trump's “Greatest Economy in History”: Not Even Close 3-5-25
Asset Returns and UST Update: Pain Matters 3-5-25
Happy War on Allies Day 3-4-25
Footnotes & Flashbacks: Credit Markets 3-3-25
Footnotes & Flashbacks: Asset Returns 3-2-25
Footnotes & Flashbacks: State of Yields 3-2-25
Mini Market Lookback: Collision Courses ‘R’ Us 3-2-25
PCE Jan 2025: Prices in Check, Income and Outlays Diverge 2-28-25
Durable Goods Jan25: Waiting Game 2-27-25
GDP 4Q24 Second Estimate: PCE Inflation the Main Event 2-27-25
New Homes Sales Jan 2024: Homebuilders Feeling Cyclical Signals? 2-26-25
Existing Home Sales Jan 2025: Prices High, Volumes Soft, Inventory Up 2-21-25
AutoNation: Retail Resilient, Captive Finance Growth 2-21-25
Toll Brothers 1Q25: Performing with a Net 2-20-25
Housing Starts Jan 2025: Getting Eerie Out There 2-19-25
Herc Rentals: Swinging a Big Bat 2-18-25
UST Yields: Sept 2024 UST in Historical Context 2-17-25
Tariff links:
Auto Tariffs: Japan, South Korea, and Germany Exposure 2-25-25
Mini Market Lookback: Tariffs + Geopolitics + Human Nature = Risk 2-22-25
Reciprocal Tariffs: Weird Science 2-14-25
US-EU Trade: The Final Import/Export Mix 2024 2-11-25
Aluminum and Steel Tariffs: The Target is Canada 2-10-25
US-Mexico Trade: Import/Export Mix for 2024 2-10-25
Trade Exposure: US-Canada Import/Export Mix 2024 2-7-25
US Trade with the World: Import and Export Mix 2-6-25
The Trade Picture: Facts to Respect, Topics to Ponder 2-6-25
Tariffs: Questions to Ponder, Part 1 2-2-25
US-Canada: Tariffs Now More than a Negotiating Tactic 1-9-25
Trade: Oct 2024 Flows, Tariff Countdown 12-5-24
Mexico: Tariffs as the Economic Alamo 11-26-24
Tariff: Target Updates – Canada 11-26-24
Tariffs: The EU Meets the New World…Again…Maybe 10-29-24
Trump, Trade, and Tariffs: Northern Exposure, Canada Risk 10-25-24
Trump at Economic Club of Chicago: Thoughts on Autos 10-17-24