
Payroll March 2025: Last Call for Good News?
Payroll doesn’t reflect the “ugly stuff” unfolding, but the solid numbers tell a story of what we might be killing off with tariffs.


Will they be serving new jobs later in 2025?
The steady payroll numbers are still in place with +228K adds for March, but the big test lies ahead on how many of the job openings hold up, how hiring appetites trend while set against the weaker forward macro backdrop, and how soon employers seek some cost offsets to tariffs via layoffs (see JOLTS Feb 2025: The Test Starts in 2Q25 4-2-25).
The forward-looking capital market reactions in equities and credit are obviously sounding alarms. For many equity holders, the sight of material spread widening is now back on their front burner to monitor even if the credit spreads in the IG and HY market are still at levels inside long-term medians (see Tariffs: Diminished Capacity…for Trade Volume that is…4-3-25).
This morning’s China retaliation was bigger news than the March jobs, and one irony is that the “Fed put” crowd just lost an easy excuse for Powell and the FOMC to jump in. The dual mandate is about price stability and full employment, and this is the first time since the Volcker years that the market faces stagflation as a very real risk.
The CME handicapping is moving toward odds now favoring 5 cuts in 2025. That is a market sentiment gut check also – as in unfavorable. Trump will be hammering Powell to ease, but maybe Powell can say “Reduce inflation risk by taking these moronic tariffs off and I will!” That only happens in dreamland (Powell did not say it today in his press conference even as Trump was letting loose on Powell on social media). In the meantime, the Fed needs job losses to make that “Fed put” realistic. The jobs are steady and solid while inflation is well above target and likely to go higher.

The above chart updates the monthly job adds since the end of ZIRP and the start of the tightening cycle in March 2022. We just printed an above median job adds number for March using the timeline from Jan 2009. The economy rolling out of 2024 was solid as evident in the final print of the 4Q24 GDP results (see 4Q24 GDP: The Final Cut 3-27-25). The consumer and PCE lines were the anchors in GDP, but the tariff regime and consumer sentiment metrics have been trending in a very negative direction. For now, jobs are hanging in, but we did get two negative revisions for Jan and Feb 2025.

The above chart plots the running job adds/declines since Jan 2009 against the unemployment rate, which ticked up to 4.2% in March from 4.1%. We isolate the worst months of the COVID dislocations in the box for better visuals in the other periods.
The 4.2% unemployment rate is derived from the Household data with 7.083 million unemployed (+31K MoM) as a % of 170.59 million in the civilian labor force (+232K MoM). We also see 163.5 million (+201K MoM) classified as employed.
The headline payroll level and unemployment rate is solid, but the DOGE effects (or non-DOGE government layoffs) will start flowing more into the April numbers based on how they are counting them in what is a lagged methodology. The same will be the case in May.
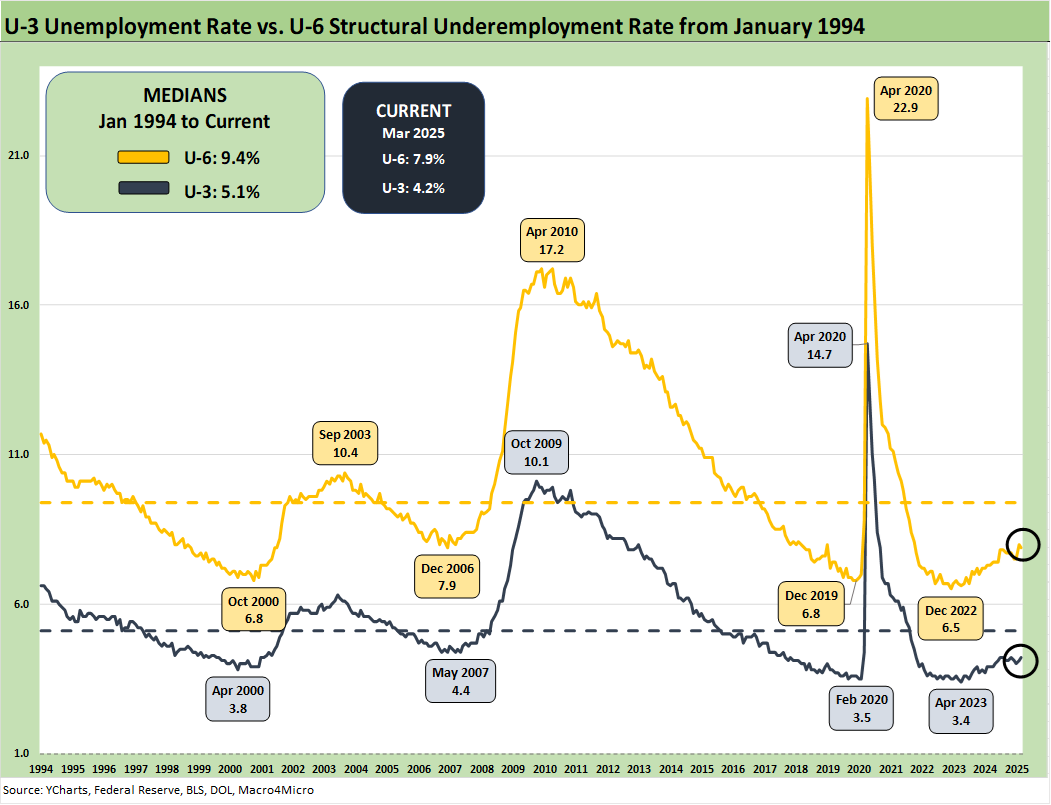
The above chart updates the time series for the U-3 unemployment rate and U-6 structural underemployment rate across the years from 1994. The current U-3 rate of +4.2% is up sequentially from 4.1% and up YoY from March 2024 at 3.9%.
As a reminder, the U-6 metric is defined with the numerator as “total unemployed + persons marginally attached to the labor force + total employed part time for economic reasons.” The denominator is “civilian labor force + workers marginally attached to the labor force.”
The U-6 ticked lower to 7.9% from 8.0% after it rose sharply in Feb 2025 to 8.0% from 7.5% in Jan 2025. The current 7.9% is well above the 6% handles seen in spring of 2023. The U-6 is also up from the 7.3% level of last year during March 2024. The 7.9% is below the median from 1994 of +9.4%. That 9.4% includes the post-crisis shock and the longest recession since the Great Depression.
As we will cover in a separate commentary that drills into the occupation-level data, the needle did not move much in the Establishment data for Manufacturing at +1K and +19K for Construction with +197K in Services the main driver of the job adds.
Within Services, the +77.8K in Health Care and Social Assistance does not ring the economic multiplier effects bell. Retail posted 23.7K with Transportation and Warehousing at +22.9K. We would put an asterisk on those two (notably Retail) as industry groups at risk from tariff effects. That includes a high risk of bankruptcies and downsizing in retail.
The +19K in Government was comprised of Federal at only -4K, State at +6K, and Local at +17K. In the midst of all the DOGE noise, it is important to remember that State and Local payrolls are almost 7x the size of Federal payrolls within the 23.6 million total government payroll.
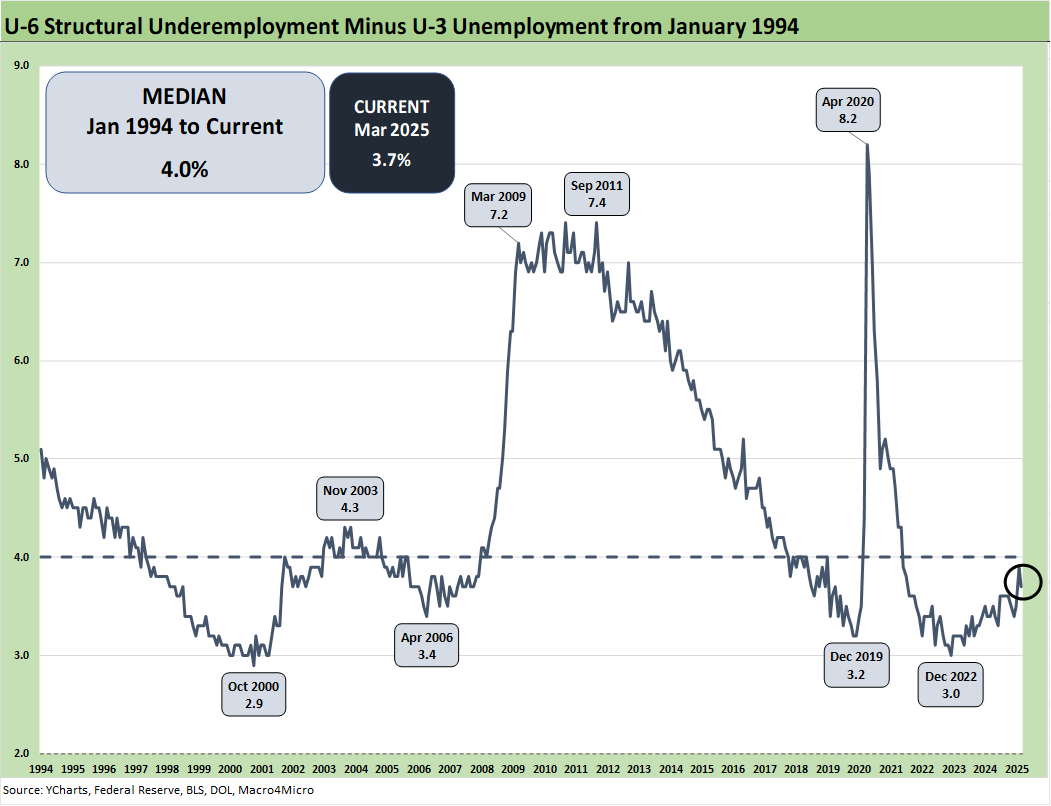
The time series above updates the U-6 minus U-3 differential as a measure of relative employment quality and to flag risks of major dislocations in large swaths of the economy (think oil patch in the late 1980s, tech bubble imploding 2001-2003, financial services and automotive in 2009). The current 3.7% is modestly below the long-term median of 4.0%.
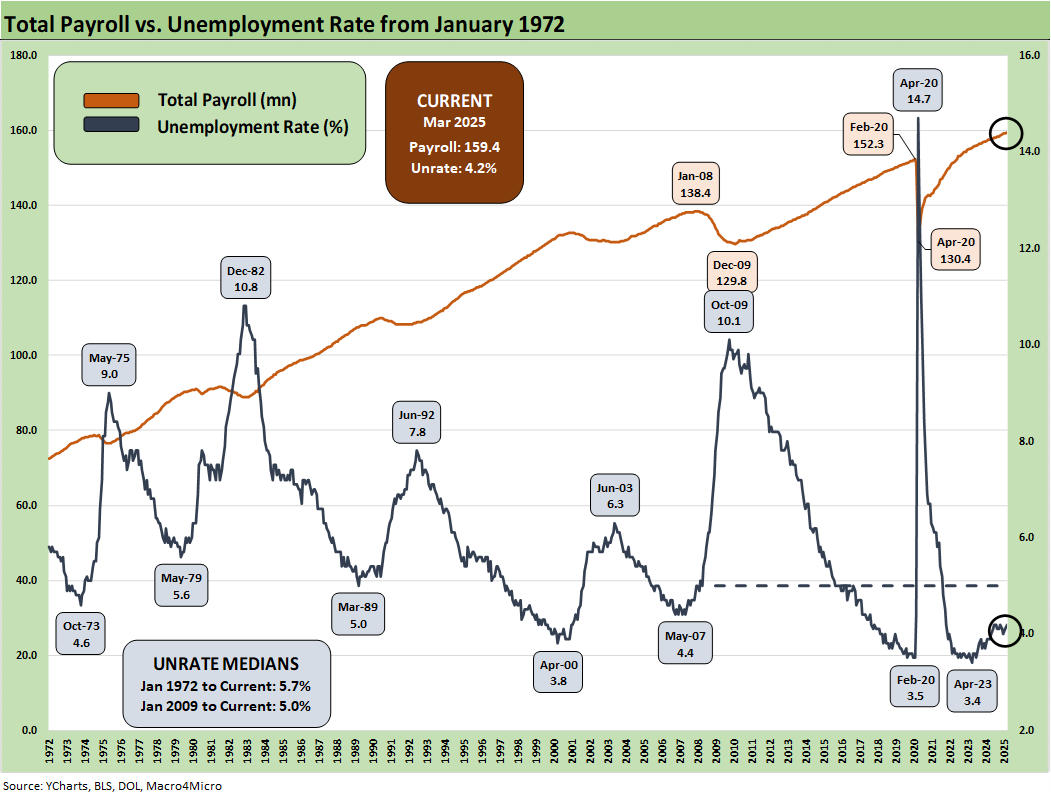
The above chart updates total payroll vs. the unemployment rate. More bodies with more paychecks is always a good thing. The trick from here is how the consumer deploys that paycheck, and the consumer has just been handed a bundle of reasons to get defensive and push saving rates even higher than what we saw in the monthly PCE numbers (see PCE Feb 2025: Inflation, Income, Outlays 3-28-25).
As we saw in the recent income and outlays release, saving rates are climbing and spending will be influenced by the adverse trends in confidence and sentiment. With inflation expectations soaring in the consumer base, that worry will impact not only household willingness to spend but also inspire more shifts across price tiers in a range of staples as well as pulling back on discretionary items.
Among big tickets, the used car market will get popular again as auto tariffs slam new vehicle prices. The “inflation expectations” boogeyman was a regular variable factored in by economists in bygone days. The 1970s and early 1980s was the ultimate inflation expectations fiasco, and Volcker beat it down.

The above chart updates the total payroll number vs. job openings. The most recent JOLTS number was in line with the highest one posted under Trump in his first term when he saw 7.5 million in Nov 2018 (see JOLTS Feb 2025: The Test Starts in 2Q25 4-2-25).
The job openings number for Feb 2025 (1-month lag in that data) and now the payroll number for March 2025 have been steady and solid, but that was before Trump went off the rails on tariffs on Liberation Day. His Rose Garden speech on the issue bordered on incoherent even for him. It appeared he was targeting his 30% MAGA hard core audience and not the rest of the country – or the world.
As we enter 1Q25 earnings season, the management teams have a lot of specifics to factor into guidance whether quantitative or qualitative. That will make for demanding investors who want to hear rational analysis of what these tariffs mean in their core products and markets.

The CPI vs. Unemployment Rate time series will start getting more focus as stagflation debates get louder and the focus on upward pricing pressure from tariffs gets framed against potential layoffs and downsizings.
At 4.2% on the U-3 in March 2025, that frames up favorably vs. the long-term median of 5.7% while the Feb 2025 headline CPI of 2.8% (3.1% Core CPI) show headline CPI just under the long-term median of 3.1% (see CPI Feb 2025: Relief Pitcher 3-12-25). The 4.2% U-3 is in line with metrics that in the 1990s would have been called full employment. Powell referenced employment numbers as being near full employment in his interview today. Powell’s comments today were a clear commitment to the Fed’s dual mandate and not Trump’s desire for the Fed to bail him out at the expense of price stability.
See also:
Credit Snapshot: Taylor Morrison Home Corp (TMHC) 4-2-25
JOLTS Feb 2025: The Test Starts in 2Q25 4-2-25
Credit Snapshot: United Rentals (URI) 4-1-25
Footnotes & Flashbacks: Credit Markets 3-31-25
Footnotes & Flashbacks: State of Yields 3-30-25
Footnotes & Flashbacks: Asset Returns 3-30-25
Mini Market Lookback: The Next Trade Battle Fast Approaches 3-29-25
PCE Feb 2025: Inflation, Income, Outlays 3-28-25
Auto Tariffs: Questions to Ponder 3-28-25
4Q24 GDP: The Final Cut 3-27-25
Durable Goods February 2025: Preventive Medicine? 3-26-25
New Homes Sales Feb 2025: Consumer Mood Meets Policy Roulette 3-25-25
KB Home 1Q25: The Consumer Theme Piles On 3-25-25
Lennar: Cash Flow and Balance Sheet > Gross Margins 3-24-25
Mini Market Lookback: Fed Gut Check, Tariff Reflux 3-22-25
Existing Homes Sales Feb 2025: Limping into Spring 3-20-25
Fed Action: Very Little Good News for Macro 3-19-25
Industrial Production Feb 2025: Capacity Utilization 3-18-25
Housing Starts Feb 2025: Solid Sequentially, Slightly Soft YoY 3-18-25
Retail Sales Feb 2025: Before the Storm 3-17-25
Mini Market Lookback: Self-Inflicted Vol 3-15-25
Credit Spreads: Pain Arrives, Risk Repricing 3-13-25
CPI Feb 2025: Relief Pitcher 3-12-25
JOLTS Jan 2025: Old News, New Risks in the Market 3-11-25
Credit Spreads Join the Party 3-10-25
Mini Market Lookback: Tariffs Dominate, Geopolitics Agitate 3-8-25
Payrolls Feb 2025: Into the Weeds 3-7-25
Employment Feb 2025: Circling Pattern, Lower Altitude 3-7-25
Gut Checking Trump GDP Record 3-5-25
Trump's “Greatest Economy in History”: Not Even Close 3-5-25
Asset Returns and UST Update: Pain Matters 3-5-25
Mini Market Lookback: Collision Courses ‘R’ Us 3-2-25
Tariff and Trade links:
Tariffs: Diminished Capacity…for Trade Volume that is…4-3-25
Reciprocal Tariff Math: Hocus Pocus 4-3-25
Reciprocal Tariffs: Weird Science Blows up the Lab 4-2-25
Tariffs: Stop Hey What’s That Sound? 4-1-25
Tariffs are like a Box of Chocolates 4-1-25
Auto Tariffs: Questions to Ponder 3-28-25
Fed Gut Check, Tariff Reflux 3-22-25
Tariffs: Strange Week, Tactics Not the Point 3-15-25
Trade: Betty Ford Tariff Wing Open for Business 3-13-25
CPI Feb 2025: Relief Pitcher 3-12-25
Auto Suppliers: Trade Groups have a View, Does Washington Even Ask? 3-11-25
Tariffs: Enemies List 3-6-25
Happy War on Allies Day 3-4-25
Auto Tariffs: Japan, South Korea, and Germany Exposure 2-25-25
Mini Market Lookback: Tariffs + Geopolitics + Human Nature = Risk 2-22-25
Reciprocal Tariffs: Weird Science 2-14-25
US-EU Trade: The Final Import/Export Mix 2024 2-11-25
Aluminum and Steel Tariffs: The Target is Canada 2-10-25
US-Mexico Trade: Import/Export Mix for 2024 2-10-25
Trade Exposure: US-Canada Import/Export Mix 2024 2-7-25
US Trade with the World: Import and Export Mix 2-6-25
The Trade Picture: Facts to Respect, Topics to Ponder 2-6-25
Tariffs: Questions to Ponder, Part 1 2-2-25
US-Canada: Tariffs Now More than a Negotiating Tactic 1-9-25
Trade: Oct 2024 Flows, Tariff Countdown 12-5-24
Mexico: Tariffs as the Economic Alamo 11-26-24
Tariff: Target Updates – Canada 11-26-24
Tariffs: The EU Meets the New World…Again…Maybe 10-29-24
Trump, Trade, and Tariffs: Northern Exposure, Canada Risk 10-25-24
Trump at Economic Club of Chicago: Thoughts on Autos 10-17-24
Facts Matter: China Syndrome on Trade 9-10-24
Tariffs: Questions that Won’t Get Asked by Debate Moderators 9-10-24
The Debate: The China Deficits and Who Pays the Tariff? 6-29-24
Trade Flows: More Clarity Needed to Handicap Major Trade Risks 6-12-24
Trade Flows: Deficits, Tariffs, and China Risk 10-11-23