
Footnotes & Flashbacks: State of Yields 3-30-25
We update UST curve action in a rare time of debate on stagflation not seen in decades and tariffs not seen in a century.


Babes in Tariffland. A 1930s tariff comedy continues. It’s not funny this time either.
We look back at a mild week in UST with the short end unmoved (or dazed) by the headlines, the 2Y lower and the 30Y higher. Mortgages barely moved.
We update the 2Y to 30Y UST slope history with a reasonable upward slope but still well short of long-term medians.
The UST curve and investor sentiment will get tested again this week with what is dubbed as Liberation Day but will raise fears of stagflation, which is the wrong enemy to be prodding. Then comes the payroll release on Friday (after JOLTS Tuesday).

The above chart plots some key cyclical transition periods from the Carter inversion of 1978 across the Volcker years, the credit cycle peak in 1989, the TMT cycle in 2000, and the housing bubble in 2006. We then jump beyond the crisis period and the ZIRP years with the QE and normalization distortions to the Oct 2023 UST peak date on the 10Y UST.
The most important takeaway is how extraordinarily low UST rates are at this point in time even if above the recent Sept 2024 lows. History is not very supportive of the risk reward symmetry that could unfold if we faced another bout of stagflation not seen since 1980-1981. That was a drastically different backdrop, and this market stands out with its own set of dynamics including sovereign systemic debt leverage and funding needs much worse than anything we have seen and facing a tariff strategy that dwarfs anything seen since Smoot-Hawley (and that one did not end so well).

The above chart breaks out the migration of the UST curve since the end of 2021 just ahead of the end of ZIRP in March 2022. The eye-catching inversions hit a level not seen since the Volcker years when the monetary policy drove a record inversion and then record steepening on the front end in a compressed time frame.
We see the brief 1Q23 downshift during the regional bank crisis and then the upward shift across 2023. We then see the bear steepening during the easing cycle despite the UST rally and downshift in Sept 2024 that we break out in other charts. The rally into Sept-Oct 2024 after the 1H24 steepening did not last long.
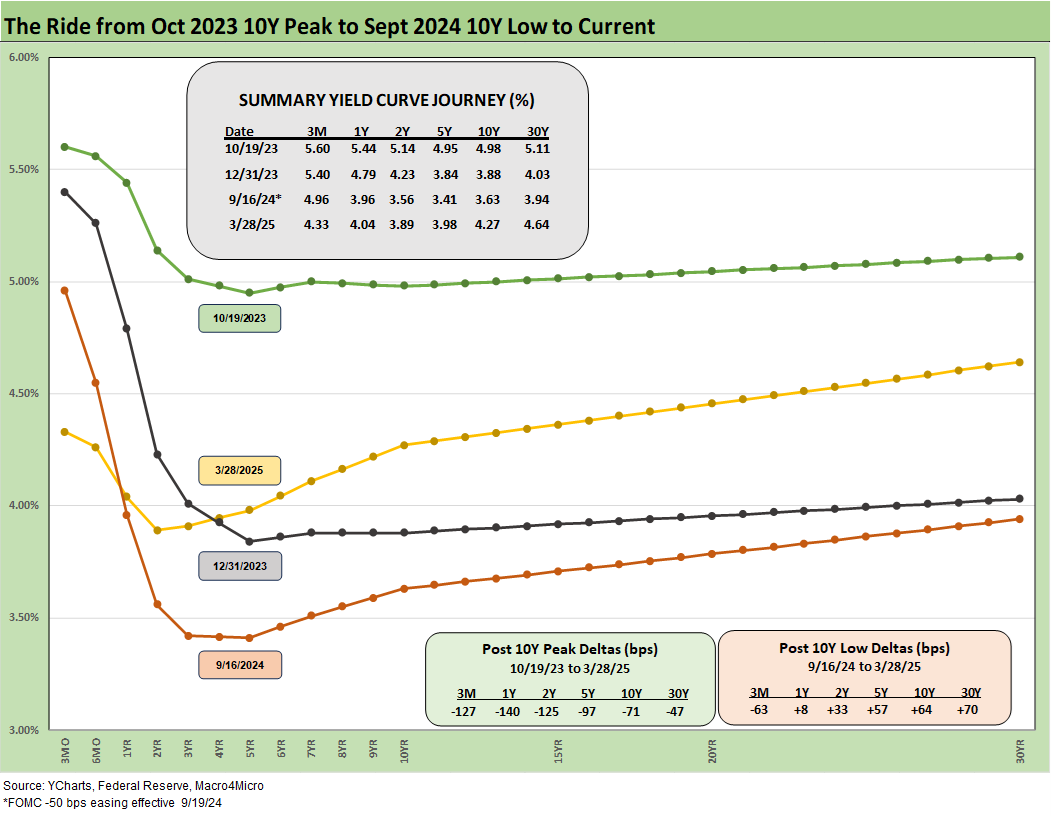
The above chart captures the sharp moves from the peak UST curve of 10-19-23 down into the major rally of Nov-Dec 2023 and then eventually into the lows of Sept 2024. The Sept 2024 low only came after a bear steepener hit the curve through the summer of 2024. Then the bear steepener eventually went back into action to where we stood at as Friday close.
Forecasting the UST curve has not been easy with the start of 2024 calling for repeated cuts (many predictions of 5-6 cuts) and a downward shift. We got 4 of those cuts later in the year but the protracted flattening called for by the end of 2024 was not in place by then. YTD 2025 has seen modest bull flattening from where 2025 started as we cover below in the UST delta charts.

The UST deltas for the past week show modest declines in 2Y and a small rise of the 10Y to 30Y. The lack of movement in the short end despite all the tariff headlines, negative consumer data and higher core PCE inflation makes for another data point that the market is wrestling with the mixed signals. The mixed signals on cyclical health and stall in inflation could also feed flight to quality.
The moving parts are battling it out with a very big week ahead. We are more afraid of this out-of-control, ill-conceived, and conceptually “wacked” tariff program than we are of recession risk at this point. But it would not take long for contraction risk to rise if the tit-for-tat retaliation gets out of control. UST supply potential remains anything but friendly to the UST curve at this point.

The YTD deltas have shown a bull flattener with the 2Y to 10Y range shifting lower with the 5Y UST leading the way in a tight range from 2Y to 10Y. The 30Y moved less but still lower. The asset returns saw decent performance from bond ETFs on the UST action (see Footnotes & Flashbacks: Asset Returns 3-30-25).

The UST deltas above update the running shift since the 9-16-24 lows. As the crow flies, the market moved back into another bear steepener since then even with the YTD rally.
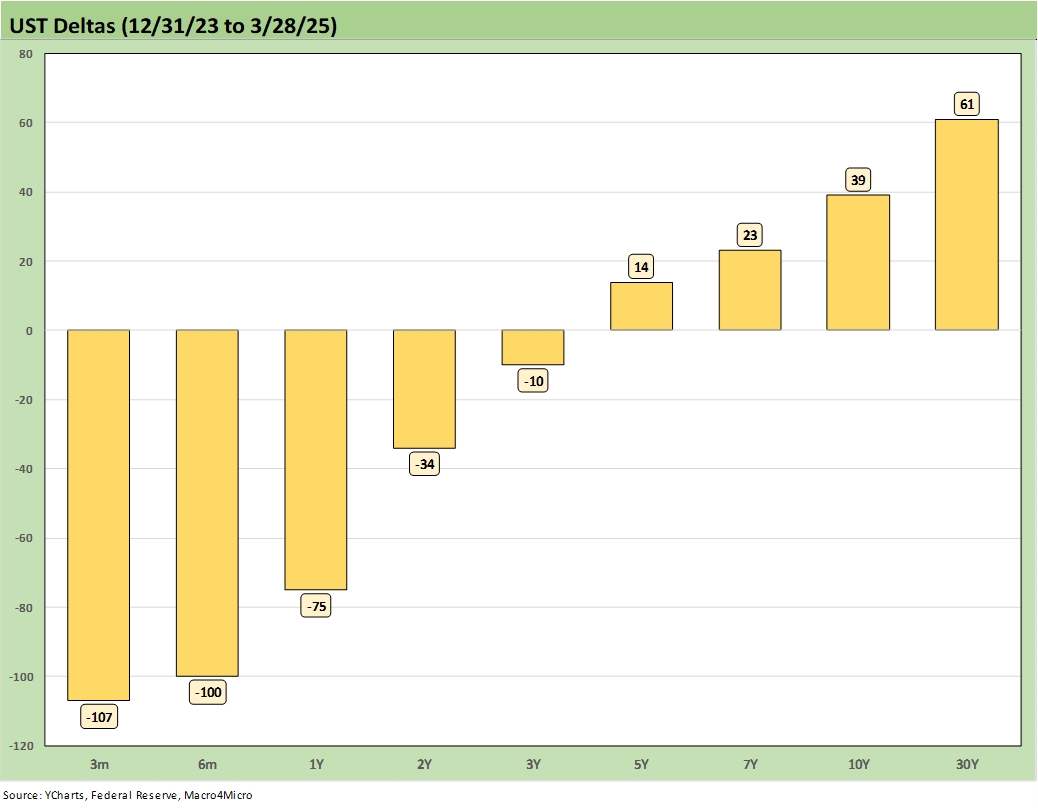
The UST deltas from the end of 2023 tell a bullish story on the front end but more of a struggle out the curve in a mixed steepener.
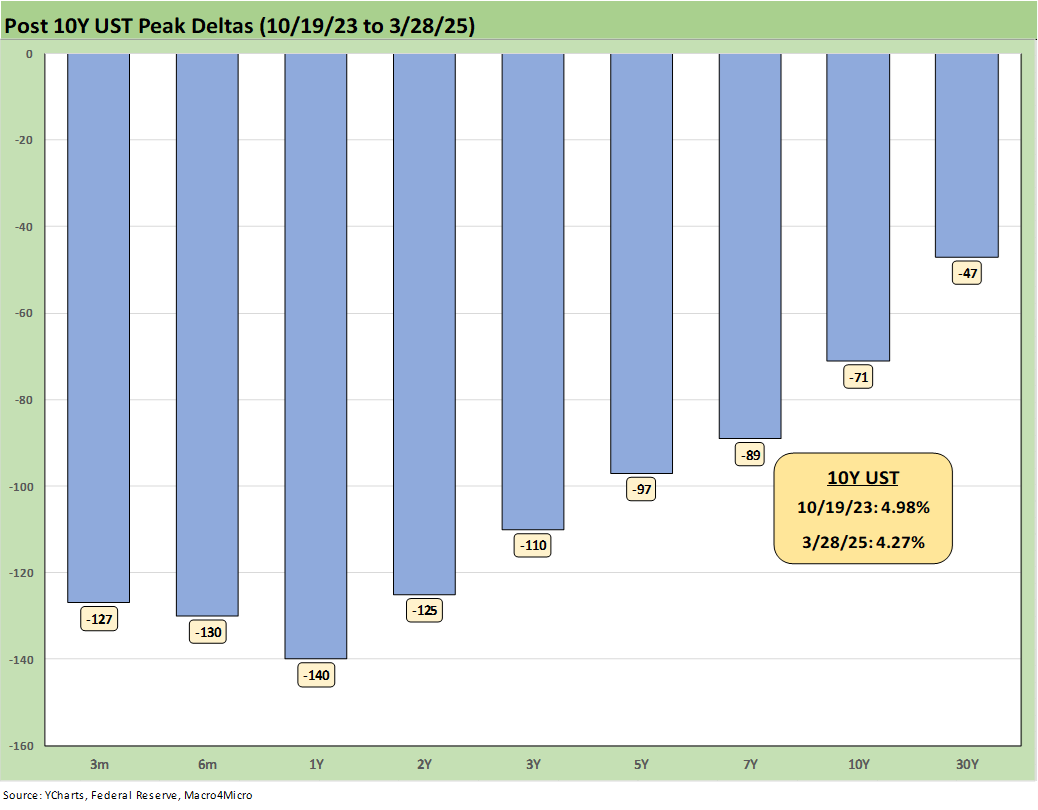
The running UST deltas from the 10-19-23 peak are updated above, and that has been a relief for the broader economy as inflation was quickly brought under control and more FOMC easing action was expected along the way. The bulls got 4 eases (across 3 actions) on the front end in Sept to Dec 2024 but did not get their desired consensus on the long end.

The above chart updates the UST curve for this past Friday and Freddie Mac 30Y Mortgage benchmark rate (noon Thursday release). We include two useful historical periods including the peak homebuilder year end of 2005 and mid-2006 when RMBS quality concerns were catching headlines as the housing bubble was peaking. We post UST curves for each period in the chart.
We recently added a column detailing the differential between the Freddie Mac 30Y and the 10Y UST. The year 2005 makes a statement on what the mortgage market was like in 2005 in terms of originating “anything” and selling it to someone else to bundle and then sell it again. It was a world of unbridled caveat emptor (the caveats were too small and the emptors got screwed).
We are seeing mortgage rates very slowly coming down again to the mid-6% area with this past week at 6.65% (-2 bps from the prior week). Mortgage spreads remain a headwind vs. earlier periods. Mortgages are now down from the sharp rise seen to near 7.0% after the Sept 2024 lows of around 6.0%.
The materially lower UST curve and 10Y UST now vs. 2006 still sees current mortgage rates closer to but slightly below mid-2006. Dec 2005’s Freddie Mac 30Y rate at 6.22% is well below current mortgage rates despite a slightly higher 10Y UST in Dec 2005 vs. the past Friday close. The Freddie 30Y at 6.22% was only 100 bps above the 10Y UST back in Dec 2005.

This week we update the 2Y to 30Y that is upward sloping at +75 bps vs. the post-1984 median of +123 bps. The peak inversion was seen in March 2023 at -117 bps.
The peak inversion in this cycle was steeper than the infamous inversion in May 2000 after a balanced budget under Clinton (and mixed GOP Congress) saw a dramatically different UST supply picture than today. The credit cycle and tech bubble had peaked and was heading to a very bad ending at that point as the tech equities crashed and an ugly default cycle arrived along with waves of Greenspan easing in 2001 (see Greenspan’s Last Hurrah: His Wild Finish Before the Crisis 10-30-22).
Another major inversion was back in the spring of 1989 at -66 bps at the peak of the LBO boom and in the days of Glass Steagall, when the credit markets were peaking and bridge loans would be blowing up by year end. That ensuing period and a few major securities firms were heading toward financial stress in 1990 with bankruptcies and a few bailouts (see UST Moves: The 1990-1991 Risk Factor Pig Pile 10-24-23, UST Moves: 1988-1989 Credit Cycle Swoon 10-20-23).

The above chart shortens up the timeline in the 2Y to 30Y for a more granular view on the move from ZIRP to inflation and the tightening cycle and then back into easing.
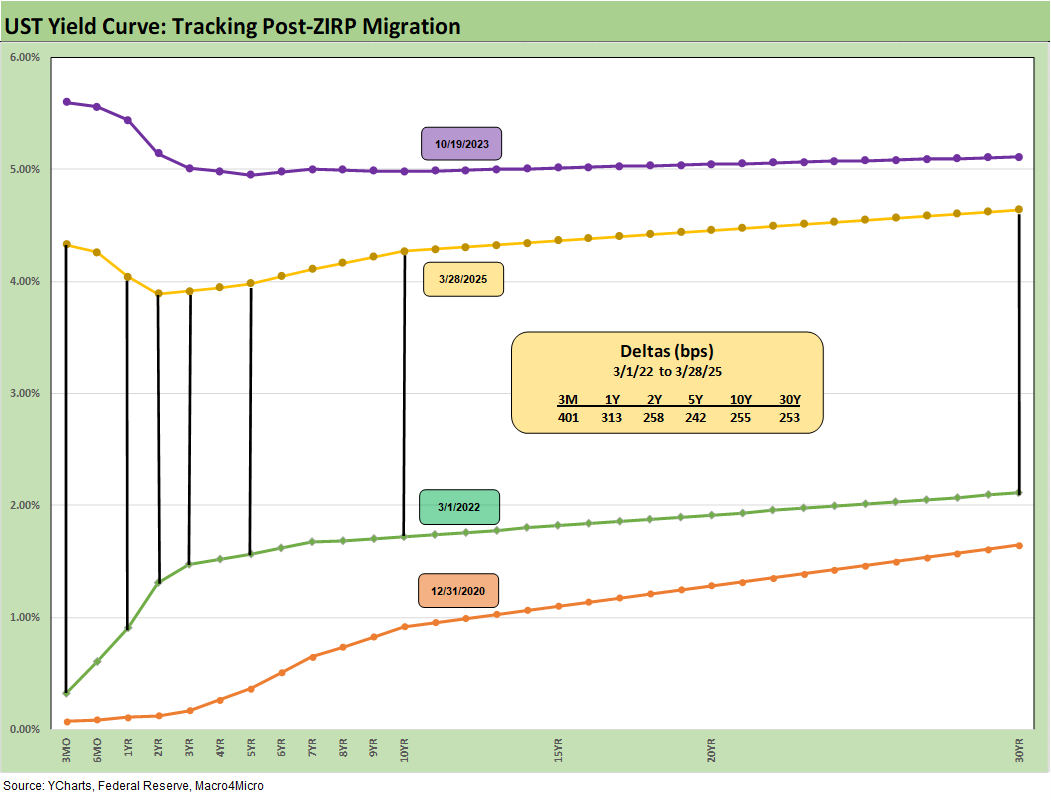
We wrap this week’s State of Yields with an update of the running UST deltas since March 1, 2022 just ahead of the end of ZIRP (effective 3-17-22). We include the 12-31-20 UST curve and 10-19-23 peak UST curve as frames of reference.
See also:
Footnotes & Flashbacks: Asset Returns 3-30-25
Mini Market Lookback: The Next Trade Battle Fast Approaches 3-29-25
PCE Feb 2025: Inflation, Income, Outlays 3-28-25
Auto Tariffs: Questions to Ponder 3-28-25
4Q24 GDP: The Final Cut 3-27-25
Durable Goods February 2025: Preventive Medicine? 3-26-25
New Homes Sales Feb 2025: Consumer Mood Meets Policy Roulette 3-25-25
KB Home 1Q25: The Consumer Theme Piles On 3-25-25
Lennar: Cash Flow and Balance Sheet > Gross Margins 3-24-25
Footnotes & Flashbacks: Credit Markets 3-24-25
Footnotes & Flashbacks: State of Yields 3-23-25
Footnotes & Flashbacks: Asset Returns 3-23-25
Mini Market Lookback: Fed Gut Check, Tariff Reflux 3-22-25
Existing Homes Sales Feb 2025: Limping into Spring 3-20-25
Fed Action: Very Little Good News for Macro 3-19-25
Industrial Production Feb 2025: Capacity Utilization 3-18-25
Housing Starts Feb 2025: Solid Sequentially, Slightly Soft YoY 3-18-25
Retail Sales Feb 2025: Before the Storm 3-17-25
Mini Market Lookback: Self-Inflicted Vol 3-15-25
Credit Spreads: Pain Arrives, Risk Repricing 3-13-25
CPI Feb 2025: Relief Pitcher 3-12-25
JOLTS Jan 2025: Old News, New Risks in the Market 3-11-25
Credit Spreads Join the Party 3-10-25
Mini Market Lookback: Tariffs Dominate, Geopolitics Agitate 3-8-25
Payrolls Feb 2025: Into the Weeds 3-7-25
Employment Feb 2025: Circling Pattern, Lower Altitude 3-7-25
Gut Checking Trump GDP Record 3-5-25
Trump's “Greatest Economy in History”: Not Even Close 3-5-25
Asset Returns and UST Update: Pain Matters 3-5-25
Mini Market Lookback: Collision Courses ‘R’ Us 3-2-25
Tariff and Trade links:
Auto Tariffs: Questions to Ponder 3-28-25
Fed Gut Check, Tariff Reflux 3-22-25
Tariffs: Strange Week, Tactics Not the Point 3-15-25
Trade: Betty Ford Tariff Wing Open for Business 3-13-25
CPI Feb 2025: Relief Pitcher 3-12-25
Auto Suppliers: Trade Groups have a View, Does Washington Even Ask? 3-11-25
Tariffs: Enemies List 3-6-25
Happy War on Allies Day 3-4-25
Auto Tariffs: Japan, South Korea, and Germany Exposure 2-25-25
Mini Market Lookback: Tariffs + Geopolitics + Human Nature = Risk 2-22-25
Reciprocal Tariffs: Weird Science 2-14-25
US-EU Trade: The Final Import/Export Mix 2024 2-11-25
Aluminum and Steel Tariffs: The Target is Canada 2-10-25
US-Mexico Trade: Import/Export Mix for 2024 2-10-25
Trade Exposure: US-Canada Import/Export Mix 2024 2-7-25
US Trade with the World: Import and Export Mix 2-6-25
The Trade Picture: Facts to Respect, Topics to Ponder 2-6-25
Tariffs: Questions to Ponder, Part 1 2-2-25
US-Canada: Tariffs Now More than a Negotiating Tactic 1-9-25
Trade: Oct 2024 Flows, Tariff Countdown 12-5-24
Mexico: Tariffs as the Economic Alamo 11-26-24
Tariff: Target Updates – Canada 11-26-24
Tariffs: The EU Meets the New World…Again…Maybe 10-29-24
Trump, Trade, and Tariffs: Northern Exposure, Canada Risk 10-25-24
Trump at Economic Club of Chicago: Thoughts on Autos 10-17-24
Facts Matter: China Syndrome on Trade 9-10-24
Tariffs: Questions that Won’t Get Asked by Debate Moderators 9-10-24
The Debate: The China Deficits and Who Pays the Tariff? 6-29-24
Trade Flows: More Clarity Needed to Handicap Major Trade Risks 6-12-24
Trade Flows: Deficits, Tariffs, and China Risk 10-11-23