
Existing Homes Sales Feb 2025: Limping into Spring
A mixed picture on existing home sales with better sequential and weaker YoY. Prices and inventory keep rising YoY.


With MoM sales up +4.2% and YoY down -1.2%, prices higher YoY (+3.8%) and inventory rising (+5.1% MoM, +17% YoY) the crosscurrents lack a clean story line like most things these days.
Single family homes moved sequentially higher in price to +402.5K (+3.7% YoY) with Condos up to $355.1K (+3.5% YoY).
Across the price tiers, the YoY increases were down to only 2 of 6 positive from 4 of 6 last month with the highest price tiers posting positive growth once again, in this case the $750K to $1 million tier and the 1+ million tier.
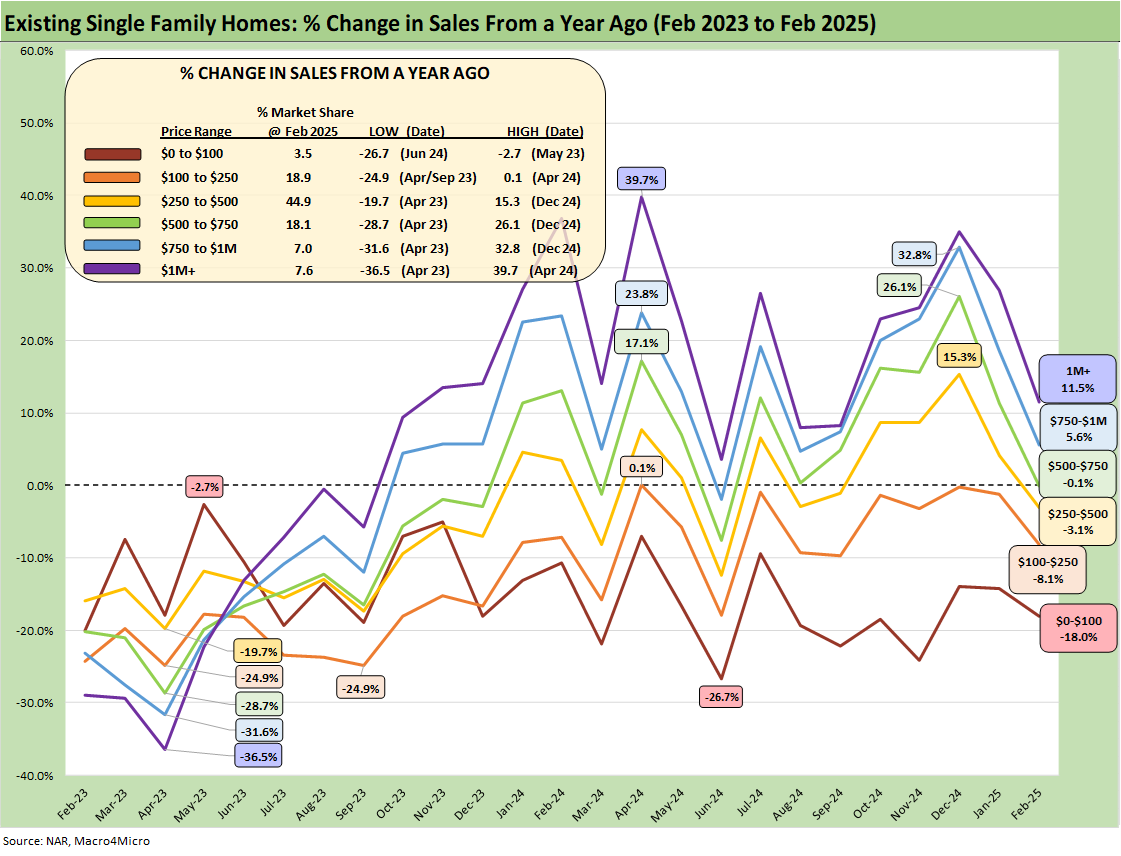
The above chart shows the deltas by price tier with the 4 lowest tiers down and the 2 higher price tiers posting growth. That trend line “rich folks winning” is not new with the volumes rising where buyers are less likely to get squeezed out based on mortgage rates or higher prices. That is a pattern we have seen frequently over the past year.
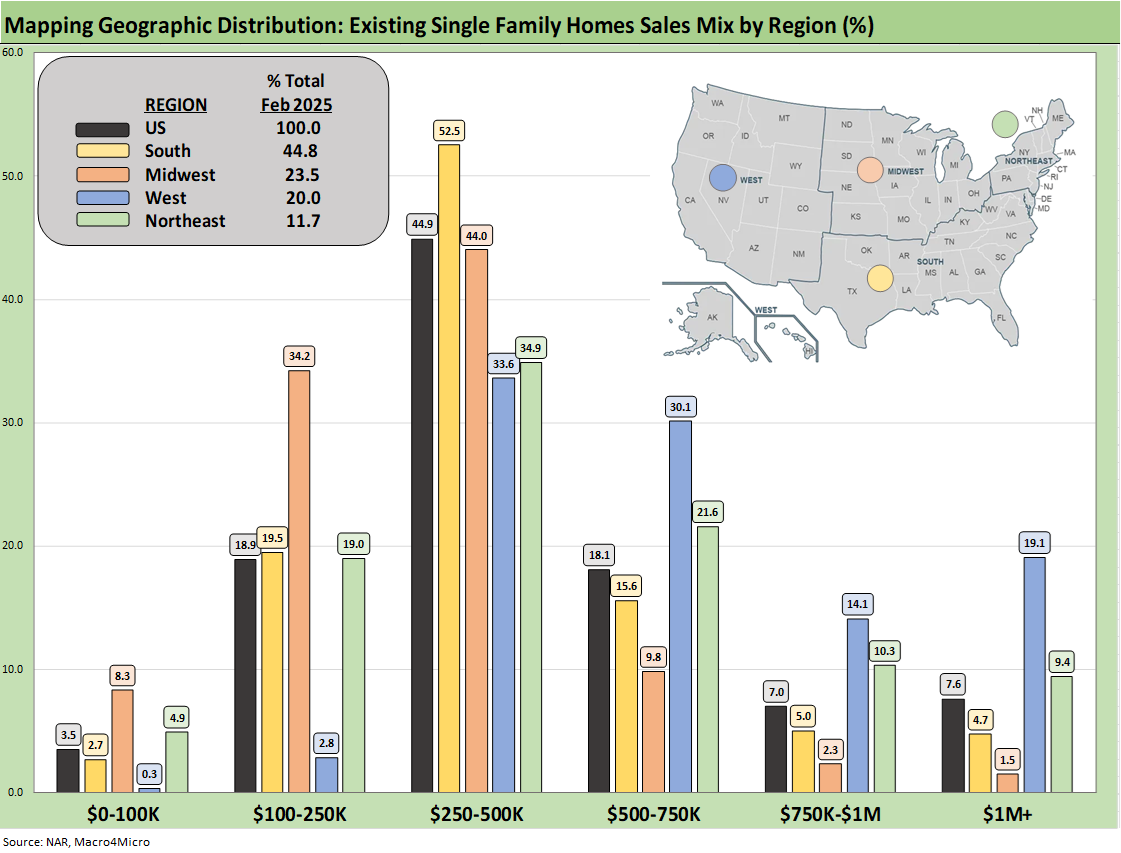
The above chart shows the geographic mix of volumes and details on price mix by region. The South is the main event in single family volumes whether new or existing at almost 45% of volumes for single family existing.
For the bar chart, we break out the mix for each region by price tier. For example, the South shows over 52% of its existing home sales volume in the $250k to $500K range and over 15% of its sales in the $500 to $750K bucket. The bars for each region add up to 100% (occasionally a rounding miss!). The high cost of homes in the West (notably California) is clear enough in the West price mix just by glancing at the bar chart with over 19% in prices over $1 million. The second highest in the $1 million club is the Northeast at over 9%.
We see a big concentration in the $250K to $500K bracket for all regions at almost 45% of the total and a heavy weighting in the $100K to $250K bracket for the Midwest at over 34%. The map explains what states are in each Census region, and there is a wide range of home price profiles in the West and Midwest.
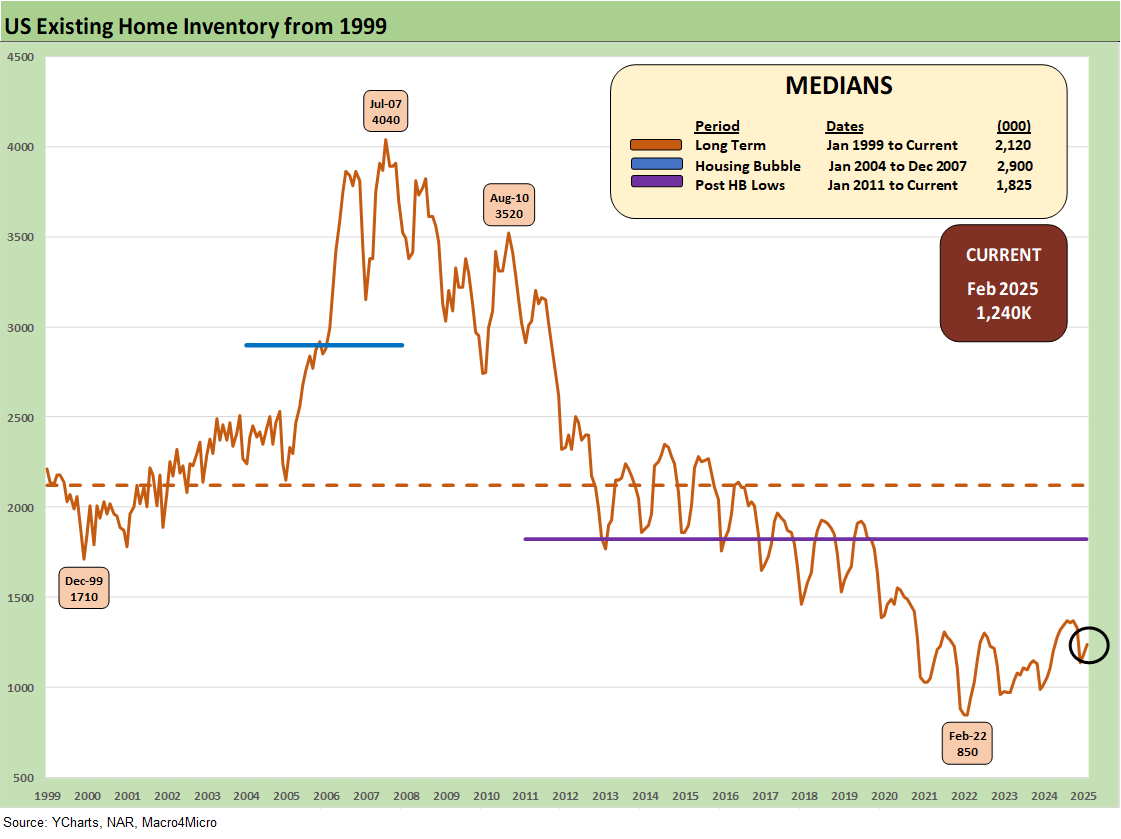
Inventory rose on the month by +5.1% sequentially to 1.24 million for total existing homes. The existing home inventory trend is back to climbing off the lows of 2022-2023. Inventory has risen into the 1.3 million handle range in 2024 before dipping back down to a recent low of 1.14 million to close out 2024. We see the Feb 2022 lows at 850K above when demand was very high just before the tightening cycle kicked into gear in March 2022. Separately, single family home inventory is up by +17.2% YoY and +5.8% sequentially.
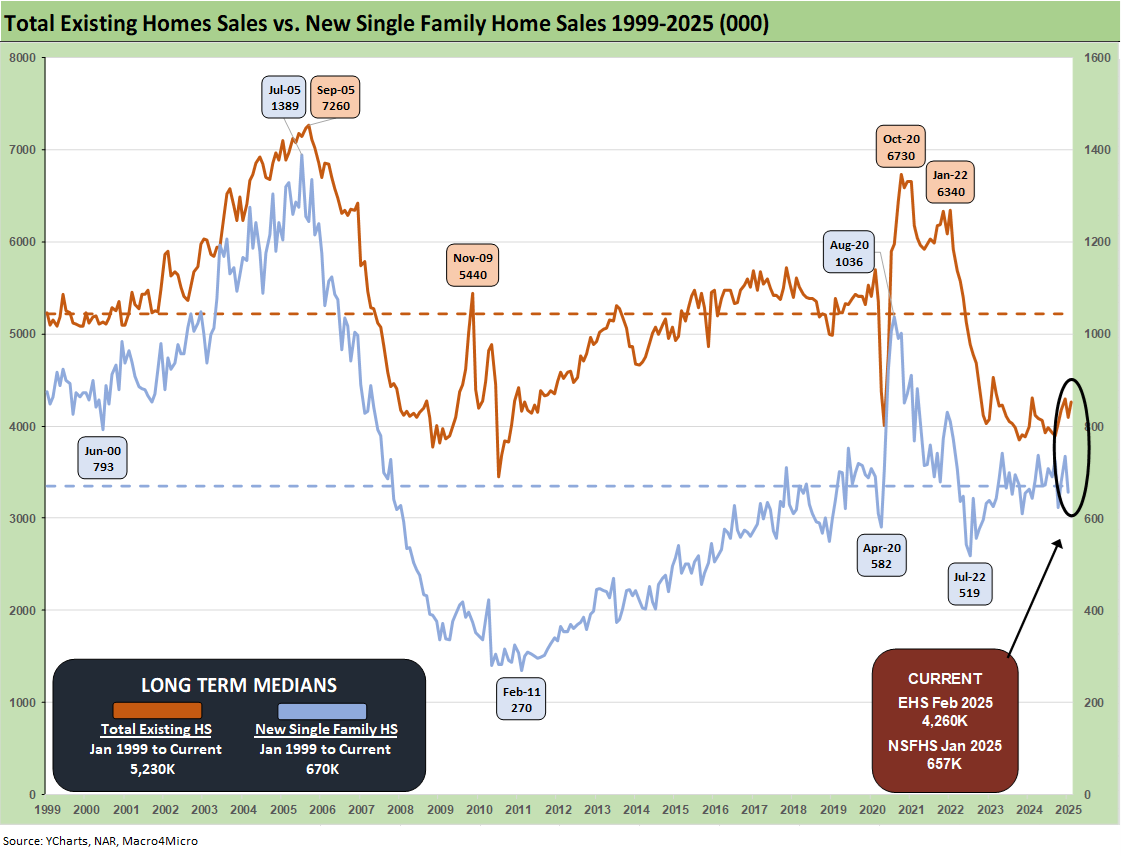
The above two-sided chart updates the trend line in total existing home sales vs. new single family homes. We look at this trend each month in the New Home Sales release when the two are on the same month (the above chart is for Jan for new and Feb for existing). New home sales for Feb will be released on March 25th.
With mortgage rates generally in the mid 6% range again and Freddie Mac’s benchmark set at 6.67% today at noon, the affordability headwinds remain very much alive. Color from the homebuilders in some recent earnings reports signal that the mortgage buydowns and incentives have not been as effective in the new home sales market even as the existing home sales markets are still seeing a gap between what the seller wants and how the buyer sees the world. That in turn continues to undermine transaction volume.
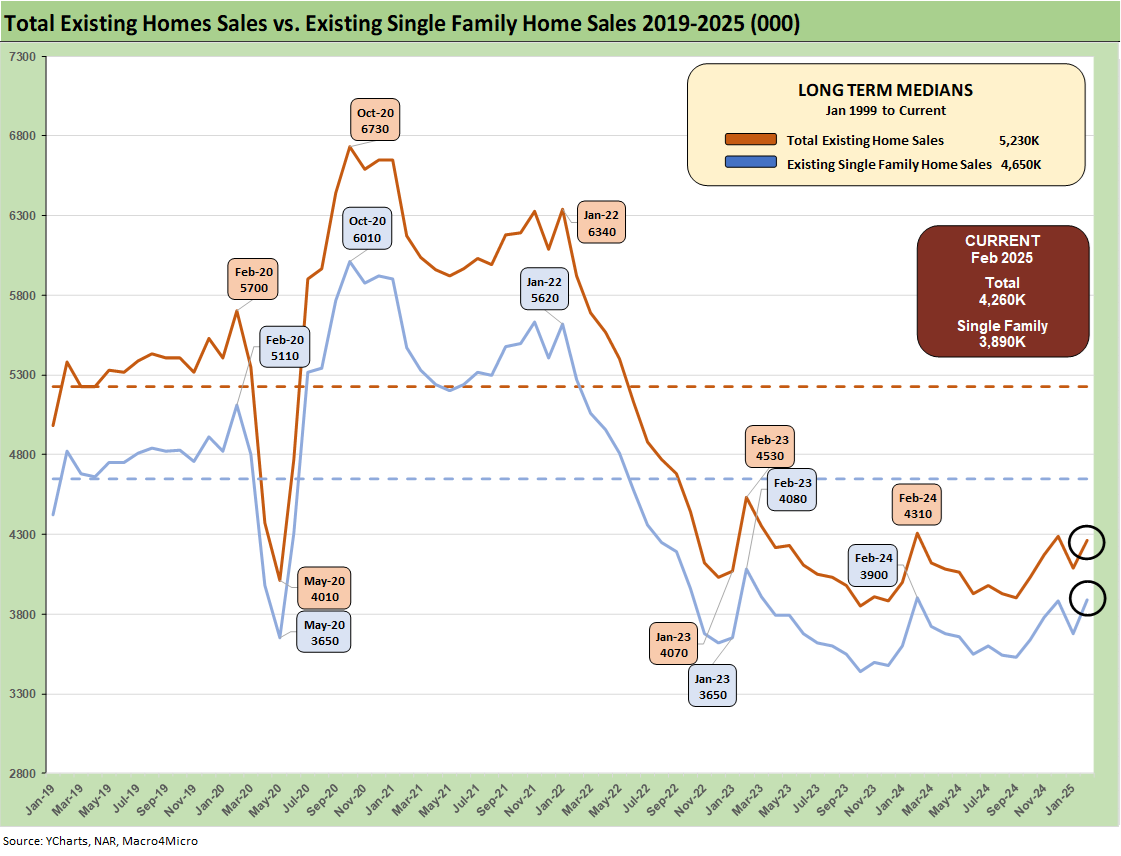
The above chart breaks out the timeline for single family alone of 3.89 million vs. total existing home sales of 4.26 million, which is well below the long-term median (from Jan 1999) of 5.23 million for total existing homes. The lower line is ex-condo/ex-co-ops. We saw 370K in condos and co-ops in Feb 2025, down from 410K in Jan 2025 (revised).
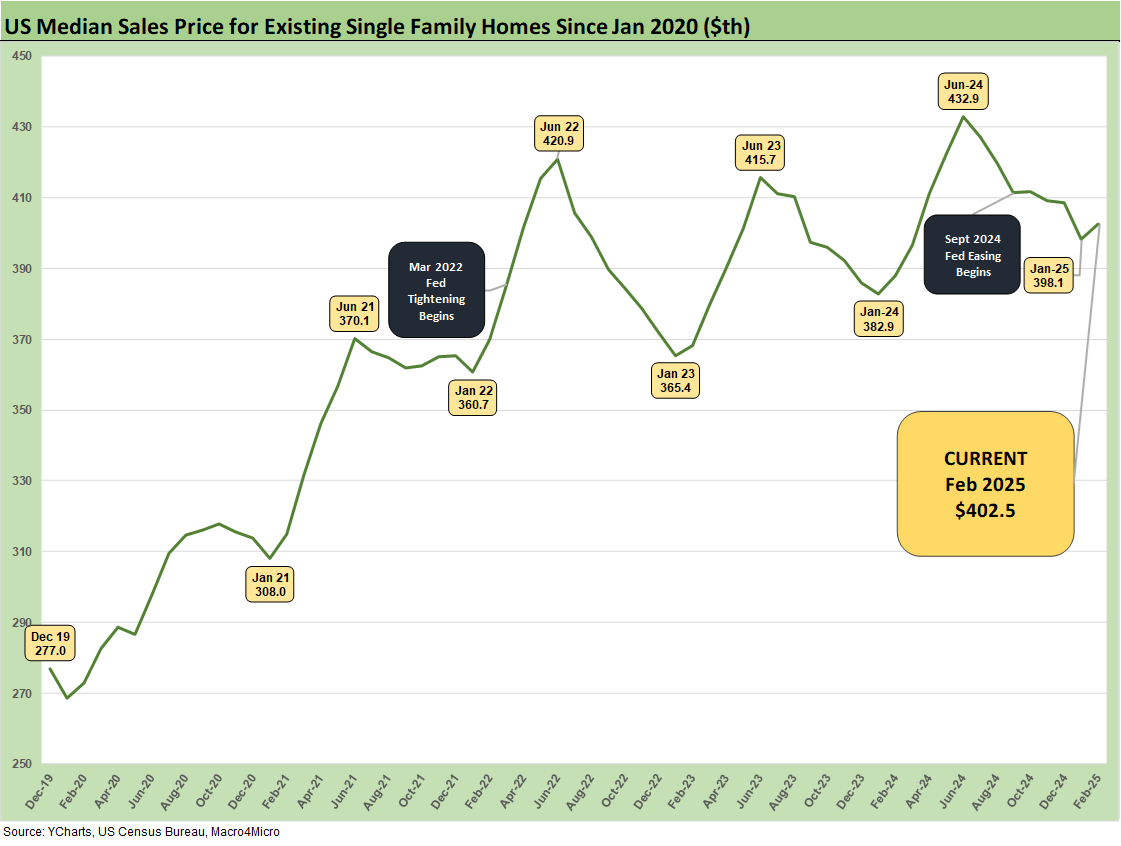
The above chart updates the median price for existing single family homes at $402.5K. Though down from the June 2024 high of $432.9K, the median price remains well above the $308K back in Jan 2021 and $277K in Dec 2019 when mortgage rates were in a different zip code.
Potential sellers and buyers had some recent mortgage relief in the low 6% range in late Sept and early Oct 2024 before mortgage rates pushed back to the 7% area. We saw 6.67 % posted by Freddie Mac’s benchmark earlier today.
The above chart updates the monthly existing home sales across the timeline from Jan 2022 through Feb 2025. The market is a long way from the mid-6 and high 5 million handles of 2021 and then into early 2022 when many homeowners refinanced, and new buyers locked in low mortgages. ZIRP ended in March 2022 and then the UST migration began.
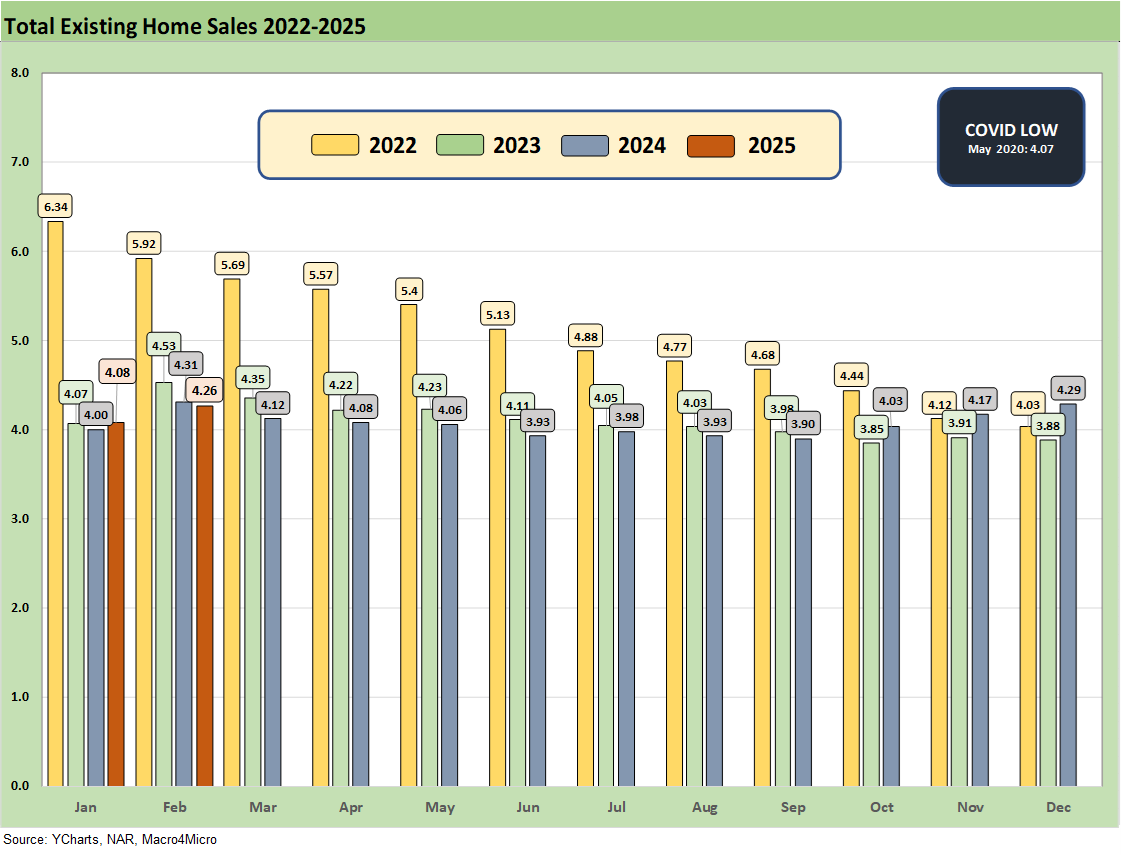
The Feb 2025 total of 4.26 million is slightly above the May 2020 COVID trough of 4.07, so there are not too many bragging rights in run rates. We had a few more sub-4 million handles along the way as noted in the chart, so this has been a brutal period for brokers.
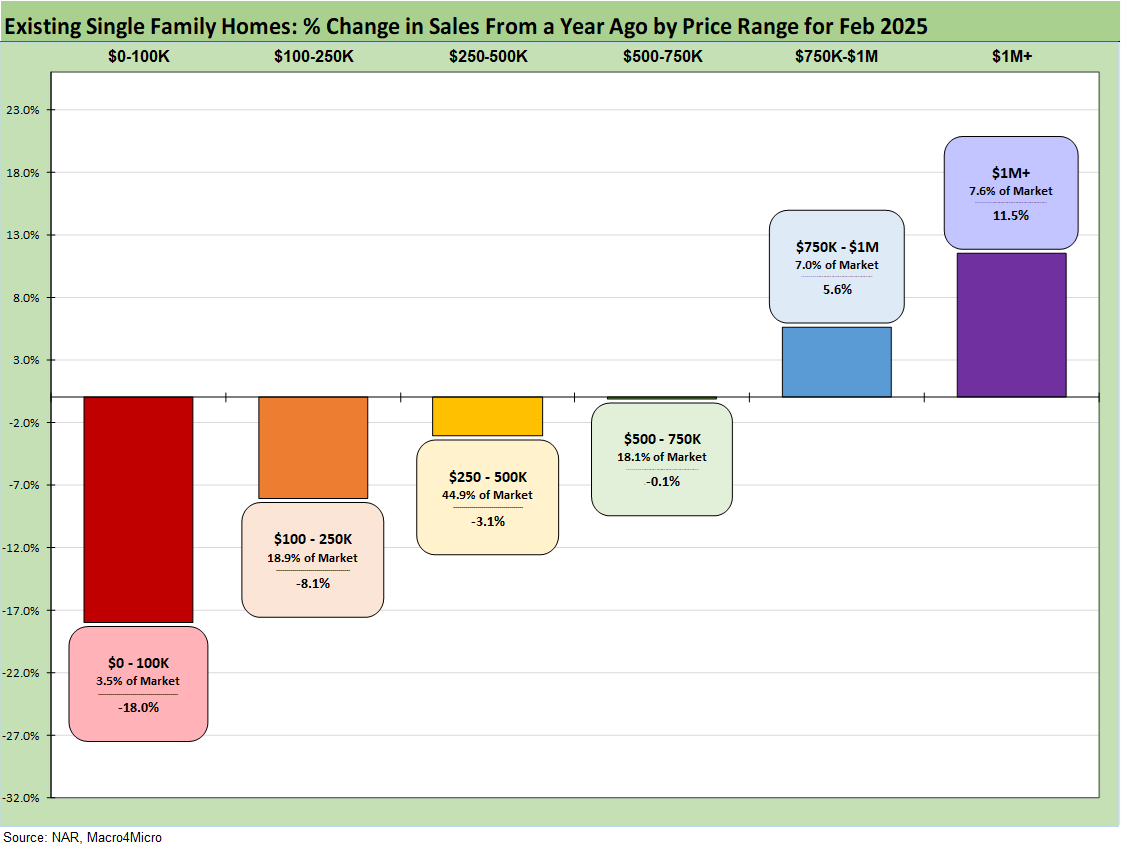
The above chart revisits the topical area addressed earlier on the existing home sales deltas by price tier. The largest tier is the $250K to $500K at almost 45% of sales volumes, and that was down by -3.1% in a setback from recent trends.
The challenge for the lower tier buyer is evident in the decline of -8.1% in the $100K to $250K tier that comprises almost 19% of volume while the $750K to $1M tier is 7% of the market and rose by much more muted +5.6% this month. We see the $1+ million market rise by over 11% this month in a sign of the times.
See also:
Fed Action: Very Little Good News for Macro 3-19-25
Industrial Production Feb 2025: Capacity Utilization 3-18-25
Retail Sales Feb 2025: Before the Storm 3-17-25
Footnotes & Flashbacks: Credit Markets 3-17-25
Footnotes & Flashbacks: State of Yields 3-16-25
Footnotes & Flashbacks: Asset Returns 3-16-25
Mini Market Lookback: Self-Inflicted Vol 3-15-25
Credit Spreads: Pain Arrives, Risk Repricing 3-13-25
Trade: Betty Ford Tariff Wing Open for Business 3-12-25
CPI Feb 2025: Relief Pitcher 3-12-25
JOLTS Jan 2025: Old News, New Risks in the Market 3-11-25
Credit Spreads Join the Party 3-10-25
Housing:
Housing Starts Feb 2025: Solid Sequentially, Slightly Soft YoY 3-18-25
New Homes Sales Jan 2024: Homebuilders Feeling Cyclical Signals? 2-26-25
Existing Home Sales Jan 2025: Prices High, Volumes Soft, Inventory Up 2-21-25
Housing Starts Jan 2025: Getting Eerie Out There 2-19-25
New Home Sales Dec 2024: Decent Finish, Strange Year 1-28-25
Existing Home Sales Dec 2024: Another “Worst Since” Milestone 1-24-25
Housing Starts Dec 2024: Good Numbers, Multifamily Ricochet 1-17-25
Homebuilders:
Toll Brothers 1Q25: Performing with a Net 2-20-25
Credit Crib Note: Lennar Corp (LEN) 1-30-25
D.R. Horton: #1 Homebuilder as a Sector Proxy 1-28-25
KB Home 4Q24: Strong Finish Despite Mortgage Rates 1-14-25
Toll Brothers: Rich Get Richer 12-12-24
PulteGroup 3Q24: Pushing through Rate Challenges 10-23-24
KB Home: Steady Growth, Slower Motion 9-26-24
Lennar: Bulletproof Credit Despite Margin Squeeze 9-23-24
Credit Crib Note: PulteGroup (PHM) 8-11-24
Credit Crib Note: D.R. Horton (DHI) 8-8-24
Homebuilders: Updating Equity Performance and Size Rankings 7-11-24
Credit Crib Note: KB Home 7-9-24
Lennar: Key Metrics Still Tell a Positive Macro Story 6-20-24
Credit Crib Note: NVR, Inc. 5-28-24
Toll Brothers: A Rising Tide Lifts Big Boats 5-23-24
Credit Crib Note: Taylor Morrison 5-20-24
PulteGroup: Strong Volumes, Stable Pricing 4-24-24
D.R. Horton: Ramping Up in 2024 Despite Mortgages 4-19-24
D.R. Horton: Credit Profile 4-4-23