
Employment Feb 2025: Circling Pattern, Lower Altitude
Feb payroll numbers as calm before the storm? The U-6 and total number employed (Household data) are flashing.


This all seems pretty stable right now…
The headline payroll level and unemployment rate are not a worry yet, but the declining numbers of total employed in the household survey (-588K sequentially) and a sharp rise in the U-6 to 8.0% from 7.5% raised some flags.
The 4.1% unemployment rate is derived from the Household data with 7.052 million (+203K MoM) unemployed % of 170.36 million in the civilian labor force (-385K MoM) with 163.3 million (-588K MoM) classified as employed.
As we will cover in a separate commentary that drills into the occupation-level data, the needle did not move much in the Establishment data for Manufacturing at +10K and +19K for Construction with +106K in Services and +11K in Government.
In the midst of all the DOGE noise, it is important to remember that State and Local payrolls are almost 7x the size of Federal payrolls within the 23.6 million total Government payroll ranks. The total State and Local is 8.5x the Federal count ex-Postal Service workers.
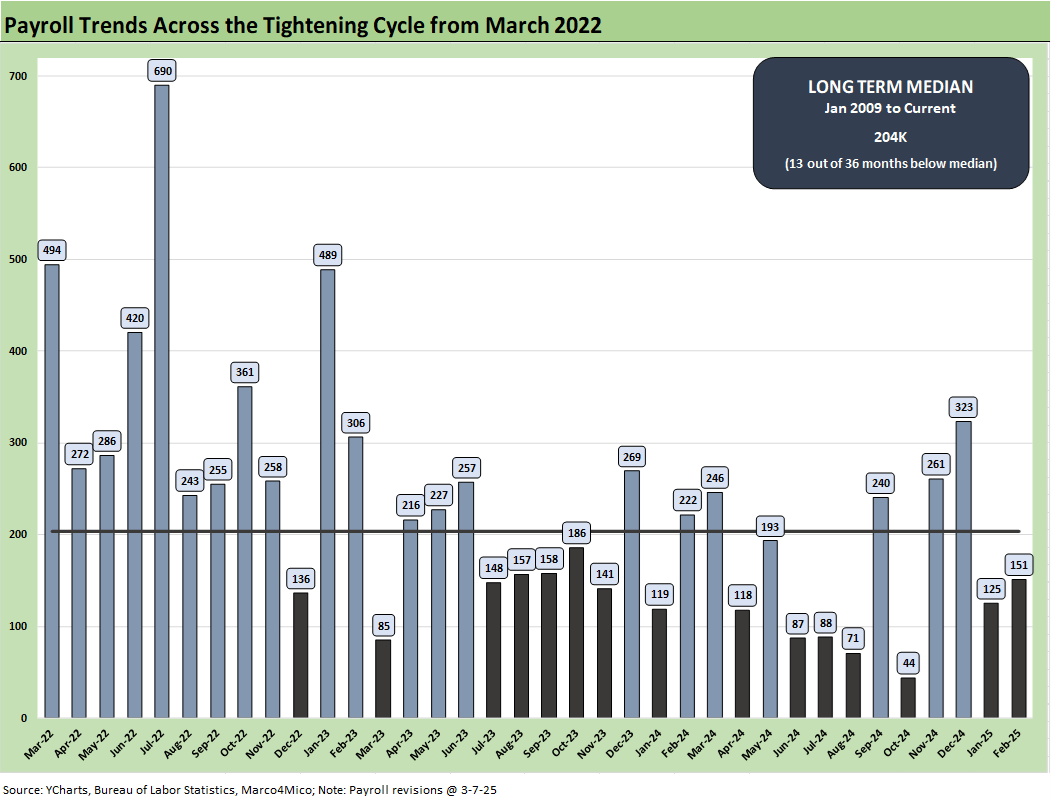
The above chart updates the running monthly job adds since the tightening cycle got underway and ZIRP ended back in March 2022. We see 7 of the trailing 12 months below the median job adds since Jan 2009 and 5 above that line. We see 6 of the past 9 below the line. In other words, the headline additions are not saying much yet, and the tariff game plan could be the swing factor that calls for more action on the headcount front.
The simple reality of tariff economics on supplier chains is that rising costs on imported products (tied to tariffs) can lead to either higher prices or taking action to mitigate costs from other expense lines (such as payrolls). Employers can delay expansion plans and pause capex until there is some level of certainty. That is what happened in many industries in 2018-2019 and prompted FOMC easing in 2019.
Listening to Commerce head Lutnick on CNBC yesterday talking about robotics to offset tariffs was probably not the best idea for political marketing. He caught himself and vectored to how high paying jobs would multiply to handle those robotics and automation trends that would be a big positive. That was a tough sell for obvious reasons (i.e., the history of automation and adverse fallout for manufacturing jobs). AI was already a worry in the Service sector. We probably will see the “offset” story line get debated a lot more from here.

We update the unemployment rate (U-3) vs. the monthly payroll adds above from Jan 2009. We isolate the worst months of the COVID dislocations in the box for better visuals in the other periods. The median monthly net change of +204K is above where we are now, and the median U-3 rate since Jan 2009 of 5.1% is higher. Overall, that is a mixed picture while offering a reminder that 4.1% will not be easy to sustain.

The above chart updates the time series for the U-3 unemployment rate and U-6 structural underemployment rate across the years from 1994. The current U-3 rate of +4.1% is up sequentially from 4.0% and up YoY from +3.9% last year on a SAAR basis.
As a reminder, the U-6 metric is defined with the numerator as “total unemployed + persons marginally attached to the labor force + total employed part time for economic reasons.” The denominator is “civilian labor force + workers marginally attached to the labor force.”
The U-6 rose sharply to 8.0% from 7.5%. That 8.0% is well above the 6% handles seen in the spring of 2023. The U-6 is also up from the 7.3% level of last year during Feb 2024. The 8.0% is below the median from 1994 of +9.4%.

This time series updates the U-6 minus U-3 differential as a measure of relative employment quality and to flag risks of major dislocations in large swaths of the economy (think oil patch in the late 1980s, tech bubble imploding 2001-2003, financial services and automotive in 2009). The current 3.9% is now almost on top of the long-term median of 4.0%.
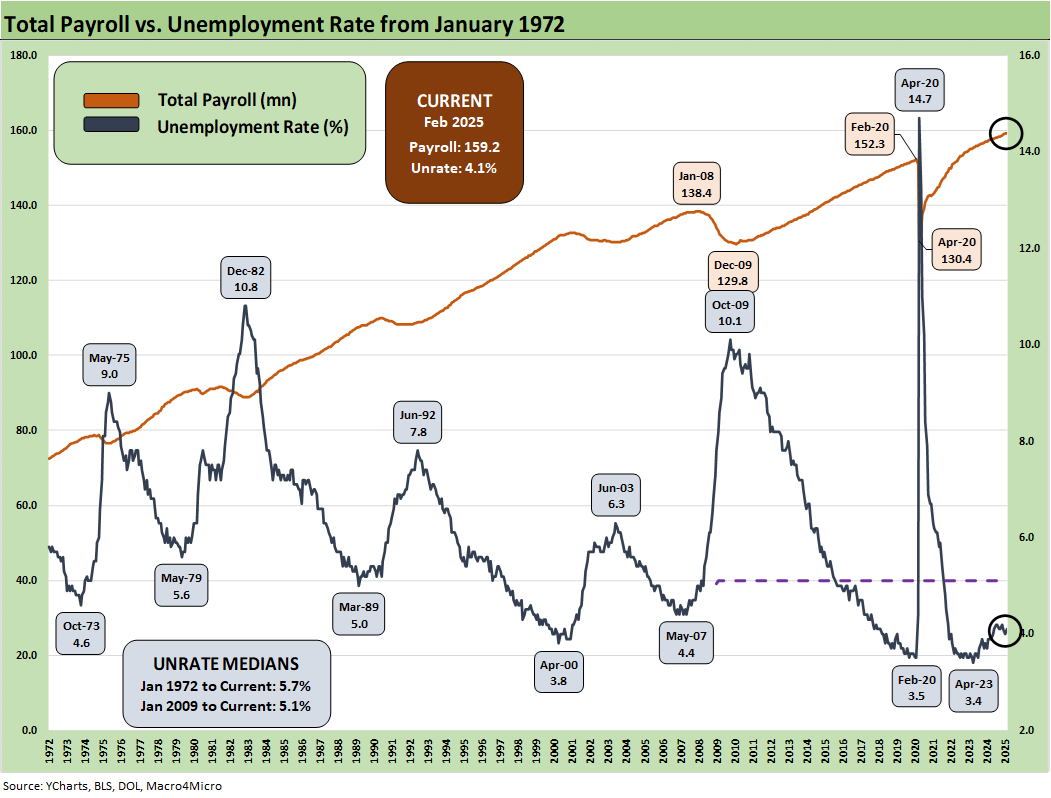
The above chart updates total payroll vs. the unemployment rate. More bodies with more paychecks is always by definition a good thing. The trick from here is how the consumer deploys that paycheck. As we saw in the recent income and outlays release, saving rates are climbing and spending is getting checked (see PCE Jan 2025: Prices in Check, Income and Outlays Diverge 2-28-25).

The CPI vs. Unemployment Rate time series will start getting more focus as stagflation debates get louder and the focus on upward pricing pressure from tariffs gets framed against potential layoffs and downsizings.
At 4.1% on the U-3 in Feb 2025, that frames up favorably vs. the long-term median of 5.7% while the Jan headline CPI of 3.0% is just under the long-term median of 3.1%. The 4.1% U-3 is in line with metrics that in the 1990s would have been called full employment.
As an aside, the JOLTS data comes next week in a departure from the usual sequencing of employment data. So, we did not include a comparison to recent JOLTS data in the above piece. We will update after JOLTS.
See also:
Tariffs: Enemies List 3-6-25
Gut Checking Trump GDP Record 3-5-25
Trump's “Greatest Economy in History”: Not Even Close 3-5-25
Asset Returns and UST Update: Pain Matters 3-5-25
Happy War on Allies Day 3-4-25
Footnotes & Flashbacks: Credit Markets 3-3-25
Footnotes & Flashbacks: Asset Returns 3-2-25
Footnotes & Flashbacks: State of Yields 3-2-25
Mini Market Lookback: Collision Courses ‘R’ Us 3-2-25
PCE Jan 2025: Prices in Check, Income and Outlays Diverge 2-28-25
Durable Goods Jan25: Waiting Game 2-27-25
GDP 4Q24 Second Estimate: PCE Inflation the Main Event 2-27-25
New Homes Sales Jan 2024: Homebuilders Feeling Cyclical Signals? 2-26-25
Existing Home Sales Jan 2025: Prices High, Volumes Soft, Inventory Up 2-21-25
AutoNation: Retail Resilient, Captive Finance Growth 2-21-25
Toll Brothers 1Q25: Performing with a Net 2-20-25
Housing Starts Jan 2025: Getting Eerie Out There 2-19-25
Herc Rentals: Swinging a Big Bat 2-18-25
UST Yields: Sept 2024 UST in Historical Context 2-17-25
Tariff links:
Auto Tariffs: Japan, South Korea, and Germany Exposure 2-25-25
Mini Market Lookback: Tariffs + Geopolitics + Human Nature = Risk 2-22-25
Reciprocal Tariffs: Weird Science 2-14-25
US-EU Trade: The Final Import/Export Mix 2024 2-11-25
Aluminum and Steel Tariffs: The Target is Canada 2-10-25
US-Mexico Trade: Import/Export Mix for 2024 2-10-25
Trade Exposure: US-Canada Import/Export Mix 2024 2-7-25
US Trade with the World: Import and Export Mix 2-6-25
The Trade Picture: Facts to Respect, Topics to Ponder 2-6-25
Tariffs: Questions to Ponder, Part 1 2-2-25
US-Canada: Tariffs Now More than a Negotiating Tactic 1-9-25
Trade: Oct 2024 Flows, Tariff Countdown 12-5-24
Mexico: Tariffs as the Economic Alamo 11-26-24
Tariff: Target Updates – Canada 11-26-24
Tariffs: The EU Meets the New World…Again…Maybe 10-29-24
Trump, Trade, and Tariffs: Northern Exposure, Canada Risk 10-25-24
Trump at Economic Club of Chicago: Thoughts on Autos 10-17-24