
US-EU Trade: The Final Import/Export Mix 2024
We update the final import/export rankings for US-EU trade as the target list proxy for tariffs and retaliation.


Pilgrim: “We need to tariff your maize. You are ripping us off.”
Wampanoag: We need to see some native ID. The deportation canoe is down by that big rock.
The tariffs on steel and aluminum revisit the EU trade tension of Trump 1.0 and the use of Section 232 tariffs (link to White House memo from today). The latest tariffs are again under the legal cover of National Security. The logic of claiming NATO partners and strategic allies as national security threats while demanding they spend 5% of their GDP on defense (preferably buying US weapons systems) offers irony along with Trump’s usual conceptual inconsistency.
The markets have tended to ignore a lot of the noise on the tariffs as senses get dulled by the nonstop distraction. The tariff effects are simplified by pondering “debit inventory, credit cash” and then watching the cost of sales line. The costs are paid by the buyer, and the cost needs to be eaten or passed on somewhere. That did not make the White House memo linked in the above bullet.
We see the reality of the disruption concerns tied to this latest move from major multiplier effect industries such as automotive and even more than a little concern over the economic effects. Even companies such as Alcoa, the #1 US player in the aluminum space with substantial operations in Canada, weighed in on the adverse effects on customers during the 4Q earnings call (see Aluminum and Steel Tariffs: The Target is Canada 2-10-25).
While the White House memo extolled the virtues of the 2018 tariff and trade aggression, they left out the part where 2018 had the worst performing top tier asset returns since the inception of bond indexes in the 1980s and with major stock benchmarks all negative. Then came the weak corporate investment and export trends that led to the 2019 FOMC easing (see Histories: Asset Return Journey from 2016 to 2023 1-21-24, HY Pain: A 2018 Lookback to Ponder 8-3-24). There is always a debate to have and advocacy by omissions is old fashioned Washington spin.

The above chart shows the steady rise of EU-US trade across the decades and the more rapid rise in EU imports. This trend presents the same trade-off in trade deficits vs. higher economic activity. We revisited those trade-offs in recent commentaries, and we highlight that it is important to ponder all of the multiplier effects that come once the imports cross the border (see Tariffs: Questions to Ponder, Part 1 2-2-25, The Trade Picture: Facts to Respect, Topics to Ponder 2-6-25).
The details on the import and export mix by product segment below speaks to a very high value-added import mix from the EU. That mix is dominated by pharmaceuticals, including many of the EU sellers owned by US entities. The top 5 buckets are impressive product groups with informed buyers. Pharma has always been a European strength.
The auto sector is synonymous with German success stories even with the periodic struggles of Volkswagen. The recent problems of Stellantis have brought them down a few notches, but they are in the US in scale or Chrysler may have ceased to exist. Germany is now a major player in the US transplant belt with BMW and Daimler and VW still the early mover in Tennessee with a major presence in Mexico as well.
EU finished goods and OEMs tend to attract supplier chain operations that don’t show up in the trade data for obvious reasons – but they are here. The same is true of US, Japanese and Korean suppliers who set up shop near such assembly plants. That all flows into local economic positives from infrastructure to construction to all freight and logistics demands (trucking, rail, warehouse, payrolls, etc.). Tax base growth (sales tax or otherwise) all the way down to the bar and grill all matter.
Multiplier effects N+1…
The strong base of inside-the-border economic activity is where the trade deficit fixation really falls apart. The fixation on the small haircut to GDP from trade deficits (around -3%) needs to give weight to material direct, secondary, and tertiary contributions to PCE, Gross Private Domestic Investment, and Government Consumption and Investment. B-Team economists sitting around pondering things like “The Green Bay Sweep” don’t have time to consider such critical economic variable with their partisan filters and narrow focus on marketing a policy.
Airbus has been an epic success and in the current cycle and certification process has kicked Boeing’s tail rudder in narrowbodies with the widebody battle still unfolding. Airbus is also now producing aircraft in the US with a warm embrace of red state political interests that could attract more supply chain investment as well. Airbus delivered its first A321 from Mobile Alabama back in 2016 and now also makes the A220 (formerly Bombardier C-Series).
As covered in our various trade commentaries across time, the EU was formed for a good reason, and the inability of the US to deal with one nation in bilateral coercion was one of the protective elements. If you want to target Germany or France, they have a shared interest in not being bullied. If you want to violate Denmark’s sovereign rights (Greenland), the group approach to trade comes into play. If you want to help Orban fortify his dictatorship, he is “All ears.” So, there are exceptions.

The above chart lays out a clear trend of a rising trade deficit between the US and EU. Worth highlighting is that Trump 1.0 had record trade deficits with the EU in 2018, 2019 and 2020. His citation of the wonders of his tariff plans and his “greatest economy in history” might be worth an overlay of those simple facts. On a “free trade and wonders of the private sector” note in the context of the EU, Trump also saw some record stock markets in those years (though 2018 was ugly). Explain those EU-US trade deficit correlations!?
Maybe there are a lot more items on the list of what makes markets do well or underperform? The streak of record stock markets that kept on coming were not mentioned in his memo – perhaps since we also saw 2 more record trade deficits with the EU in 2021 and 2024 when record stock markets were also reached.
The risky asset market in 2019 came with more than a little support from the Fed and bipartisan legislation in 2019-2020. On the tariff topic, the ability of so many US goods producers and service providers to optimize their supplier chains and purchasing options might have helped when some of the EU countries had lagging home economies.

The above chart serves as good food for thought on what tariffs could mean for the US buyers. Steel is in the top 20 and tends to be important to labor interests in the EU, so the EU will naturally respond and have their retaliation lists ready to go. As we cover for exports in the next section, the EU has plenty to aim at. We assume a few leaders are hearing “Qatar on line 1” for LNG business and “Saudis on line 2” for oil. Agriculture is always a tempting target for the EU since they are very protective of their farm interests and could slam some US ag product lines. The EU has a lot in the tool box overall.
The more sinister conspiracy theories come out with the backroom pondering that Trump wants a conflict with the EU so he can ditch NATO, seize Greenland, turn Ukraine into a death camp at the hands of Russia, and get back to being “besties” with Putin and have an ally in his authoritarian impulses. The potential to break the EU even in part would also allow bilateral talks and not a requirement to deal with the EU as a trade bloc.
We live in a very strange world right now filled with mis/disinformation where people can deny elections and pitch a forced relocation and ethnic cleansing program without broad condemnation from the GOP leaders (lapdogs?). It is naive these days to not consider the bizarre in economic outcomes. The discussion of a $150 billion increase in the defense budget might be low. The lack of detail on defense exports from the US under census classification rules is not a coincidence and the EU needs to spend much more. They would need to consider the reliability of the US on parts and services with recent behavior patterns.
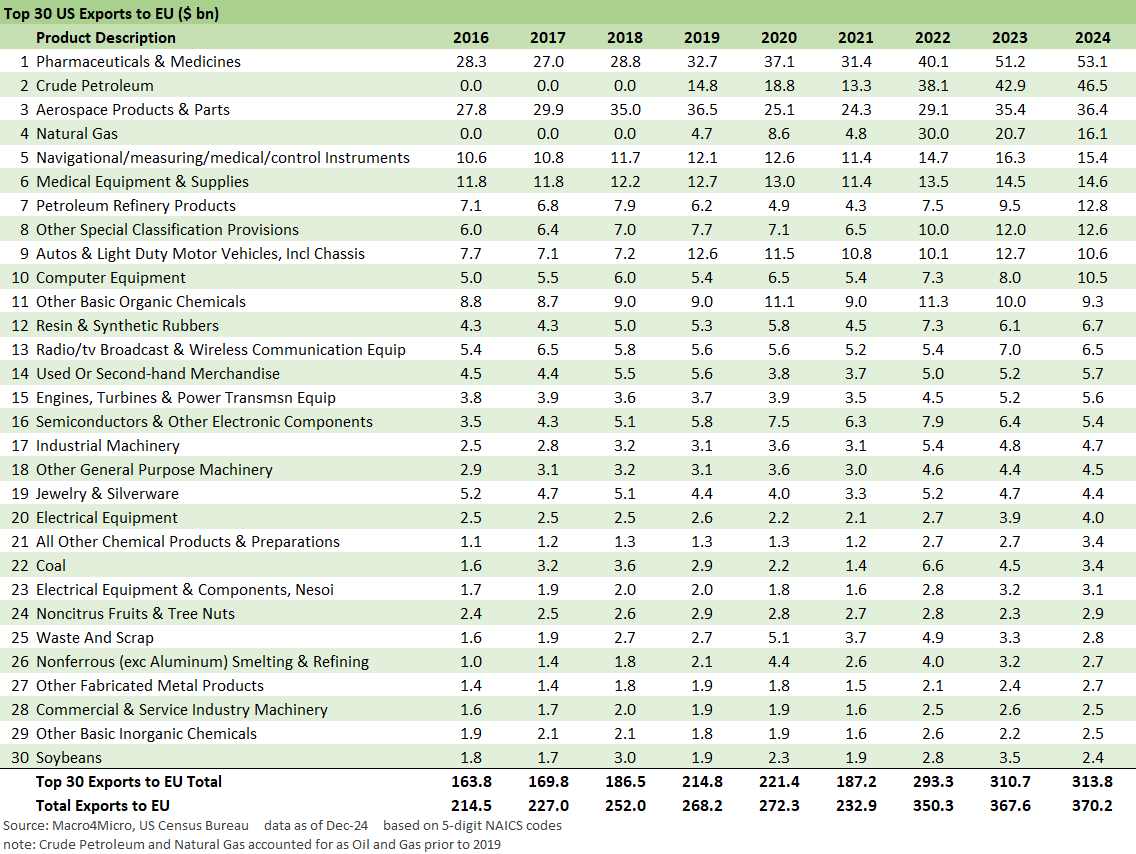
The above chart details the exports to the EU, and that list of items can be seen as the low hanging targets for retaliation by the EU. The last time they targeted products, the list mixed hard hitting and occasionally entertaining (kayaks and canoes? Must be a French and Indian War thing).
Within the top 10, we see a mix of high value added and commodity-like exports (crude oil, LNG, refined products). We see 3 of the top 7 under the energy headline. The EU can buy oil and LNG elsewhere easily enough, and Trump opens up an opportunity there that would undermine his “drill, drill, drill” ambitions. That is a very important group of line items for the EU to trade. In the end, the greatest swing state sensitivity would be agriculture. The not-so-blue wall states and purple states are generally in the top 10 ag states (CA is pure blue).
As we look at the scale of pharma imports and exports, the idea of pharma tariffs is an attack on human health, so those are usually off limits for all. Little would have escaped tariffs with a blanket tariff strategy of the sort espoused by Trump on the campaign trail or in the infamous 2017 House GOP tax bill that pitched a border adjustment tax (“BAT tax”) of 20% as part of a legislative tax pitch (Ryan/Brady) that was dead on arrival in the Senate. You cannot get more inflationary than a tariff without exemptions. The exemption process is also where corruption and influence peddling kicks into high gear. Pharma should be an exception given the direct tie-in with household inflation and health care.
See also:
Footnotes & Flashbacks: Credit Markets 2-10-25
Footnotes & Flashbacks: State of Yields 2-9-25
Footnotes & Flashbacks: Asset Returns 2-9-25
Mini Market Lookback: Simply Resistible! 2-8-25
Payroll Jan 2025: Into the Occupational Weeds 2-7-25
Payroll Jan 2025: Staying the Course, Supports FOMC Hold 2-7-25
JOLTS Dec 2024: Before the Tariff JOLT Strikes 2-4-25
Mini Market Lookback: Surreal Week, AI Worries about “A” 2-1-25
PCE: Inflation, Personal Income & Outlays 1-31-25
Employment Cost Index 4Q24: Labor Crossroad Dead Ahead 1-31-25
4Q24 GDP: Into the Investment Weeds 1-30-25
4Q24 GDP: Inventory Liquidation Rules 1-30-25
Credit Crib Note: Lennar Corp 1-30-25
D.R. Horton: #1 Homebuilder as a Sector Proxy 1-28-25
Durable Goods Dec 2024: Respectable ex-Transport Numbers 1-28-25
New Home Sales Dec 2024: Decent Finish, Strange Year 1-28-25
Tariff links:
Aluminum and Steel Tariffs: The Target is Canada 2-10-25
US-Mexico Trade: Import/Export Mix for 2024 2-10-25
Trade Exposure: US-Canada Import/Export Mix 2024 2-7-25
US Trade with the World: Import and Export Mix 2-6-25
The Trade Picture: Facts to Respect, Topics to Ponder 2-6-25
Tariffs: Questions to Ponder, Part 1 2-2-25
US-Canada: Tariffs Now More than a Negotiating Tactic 1-9-25
Trade: Oct 2024 Flows, Tariff Countdown 12-5-24
Mexico: Tariffs as the Economic Alamo 11-26-24
Tariff: Target Updates – Canada 11-26-24
Tariffs: The EU Meets the New World…Again…Maybe 10-29-24
Trump, Trade, and Tariffs: Northern Exposure, Canada Risk 10-25-24
Trump at Economic Club of Chicago: Thoughts on Autos 10-17-24
Facts Matter: China Syndrome on Trade 9-10-24
Trade Flows: More Clarity Needed to Handicap Major Trade Risks 6-12-24
Trade Flows 2023: Trade Partners, Imports/Exports, and Deficits in a Troubled World 2-10-24
Trade Flows: Deficits, Tariffs, and China Risk 10-11-23