
JOLTS Feb 2025: The Test Starts in 2Q25
The1-month lag in JOLTs does not bring much of a story, and this week’s payroll at least will have March numbers.


Bad moon rising for supplier chains and manufacturing. Payroll risks ahead?
The 1-month lag for Feb 2025 JOLTS does not leave room for excitement after a wild March and ahead of today’s Liberation Day in the first week of April, but some cyclical warning signs were in the JOLTS numbers regardless.
Total job openings were down by -194K from Jan 2025 or by -2.5% sequentially and down by -10.4% YoY. That means jobs have been getting filled along the way as we cover each month in the payroll report, but the real action from here comes with the question “How long will those openings stay open?” Tariffs will put many to the test.
Hires were down by -4.7% YoY even if flattish sequentially in Feb 2025 with private sector hires up by less than 1% vs Jan 2025 and Government Hires down. Private sector lines were split with around half lower or zero in hire numbers by industry line. The positive total number was led by “Professional and business services” carrying the day at +82K to move the headline private total hires increase to +46K while Government was -21K for a total for all sectors of +25K.
Layoffs and discharges were up by 116K in Feb or by 6.9% MoM while YoY Layoffs/Discharges were up by 6.5%.
Quits were down by -61K MoM, but YoY Quits were down -7.9%. We don’t play mind reader on motives for quitting or staying, but the usual angle when Quits decline is either people love their jobs or they are nervous about finding another one. Household anxiety would be consistent with consumer sector confidence and sentiment surveys.
We are a day late on our JOLTS update on the numbers released yesterday, but it did not look too interesting while we were juggling some other research. The 1-month lag on JOLTS from Feb 2025 might not be all that exciting with March volatile and Trump seeking to reinvent global trade with Liberation Day news later today. We get March payroll numbers on Friday. That said, the JOLTS numbers show clear signs of cyclical slowing but are not waving contraction flags by any stretch. It would take a lot more economic pain to get there.
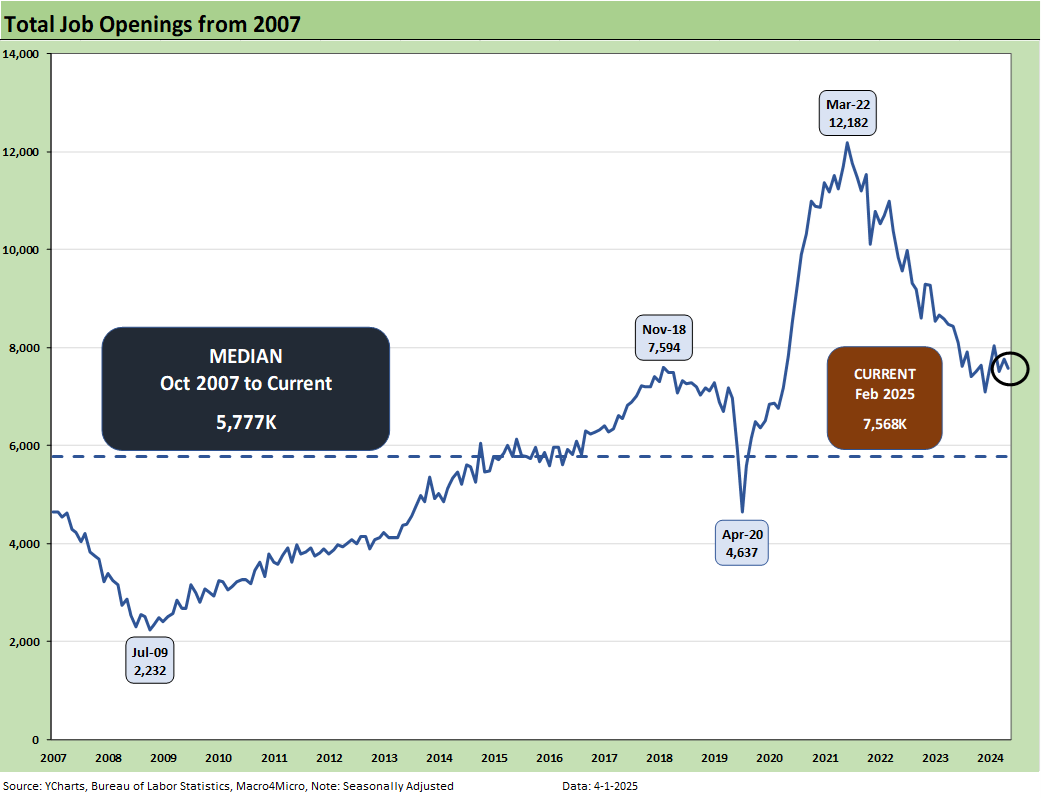
The job openings number for Feb 2025 declined modestly by -2.5% to 7.57 million as noted in the bullets above. That does not shake up expectations much since the dislocations are only just now arriving on the “unwelcome mat” as tariffs go into effect and starts the game clock on retaliation. All four regions were lower for job openings, and the YoY openings number was down -10.4% from the 8.44 million YoY.
The current job openings total is down around where Trump 1.0 peaked at 7.59 million in Nov 2018 and down from the peak openings number under Biden at 12.2 million in March 2022. From the March 2022 peak, inflation kept the numbers off balance, but many jobs have been filled across the timeline as we cover in the monthly payroll data. There have been no months with negative payroll numbers. We will revisit what was filled in the total payroll count for March with Friday’s payroll numbers. The real test will come as 2025 unfolds and growth rates come under siege. The ability to offset tariff costs are very likely to hit payrolls.
The worry around tariffs is that demand will decline on higher prices and anxiety around headcount costs. Some cost actions may be needed to offset the cost flow-through on tariffs. Payroll and headcount will be brought up in that conversation. After all, tariffs get paid by the buyer as a matter of fact (regardless of what Trump says since he continues to insist that the “seller pays”).
A major variable in inflation and payrolls will revolve around how the post-transaction supplier chain shares the costs under the new tariff regime. That sharing analysis runs from seller (price concessions to offset part of the tariff) to the buyer (eats some costs), along supplier chains (e.g. auto OEMs hitting suppliers), and to the final end market customer (inflation). Currency trends can also play a final role in the dollar price paid by a customer.
Cutting costs along the transaction trail can also mean less jobs and private sector retrenchment. No one on the White House team wants to say that with their outside voice. The absence of voices on the reality of private sector payroll cuts to improve efficiency and offset tariff costs is more than a little ironic as DOGE lays waste to headcount in Government and agency ranks. They say “waste fraud and abuse” to cover their ass. They will soon hear private sector explanations saying, “tariffs and economic ignorance in Washington.” If the private sector CEOs have not been cowed that is.
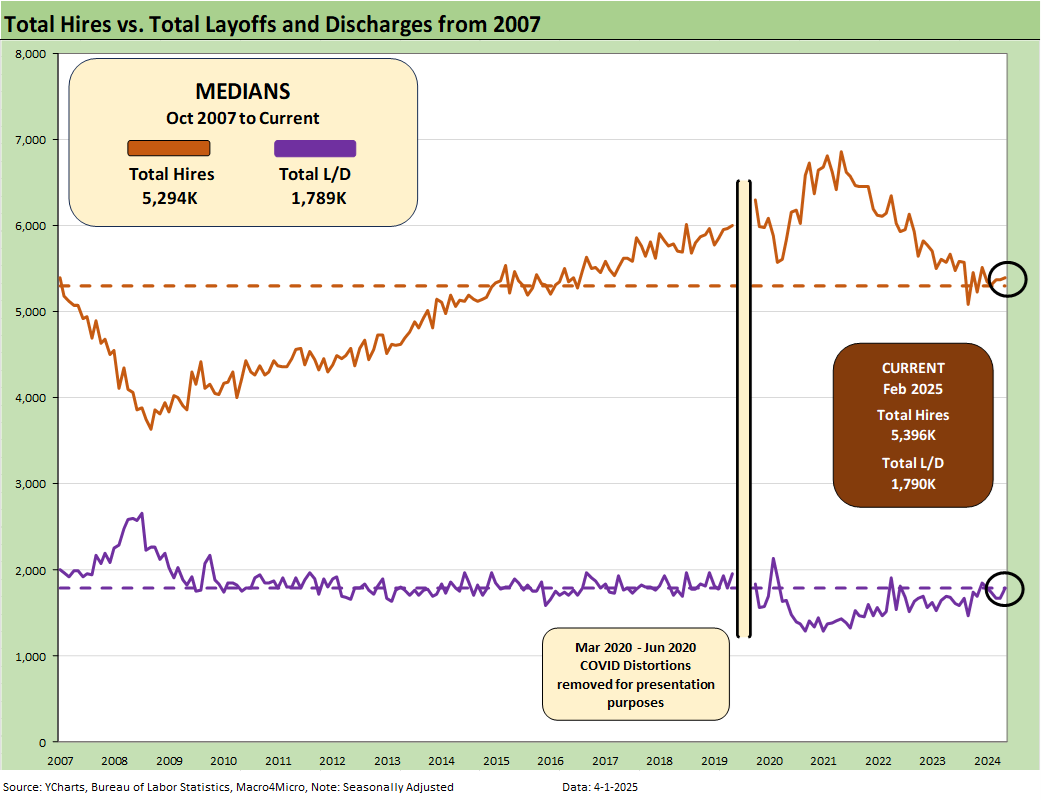
The above chart plots Hires vs. Layoff/Discharges on a SAAR basis. We remove the COVID numbers from this chart to support the visual value for “normal” periods. Those COVID impacts are detailed further below. As noted in the bullets at the top, Hires were up slightly sequentially and down YoY. Layoffs/Discharges were up sequentially and YoY.
Hires ticked up during the month by only 25K or by 0.5%, weighted toward the private sector. Hires were down in the Government sector across Federal, State, and Local. Professional and Business Services led the line items, but a wide range of industry groups were negative.
Layoffs and Discharges in total rose by 116K or by 6.9% sequentially to 1790K. Private sector layoffs and discharges rose by 96K or by 6.0% to 1692K. Government Layoffs are ticking higher and jumped by a multiple at the Federal level but still only by 22K total after a 4-fold increase for the month. Layoffs at the Federal level are usually extraordinarily low, but DOGE has changed the rules of the game, and those numbers will be climbing in coming months.
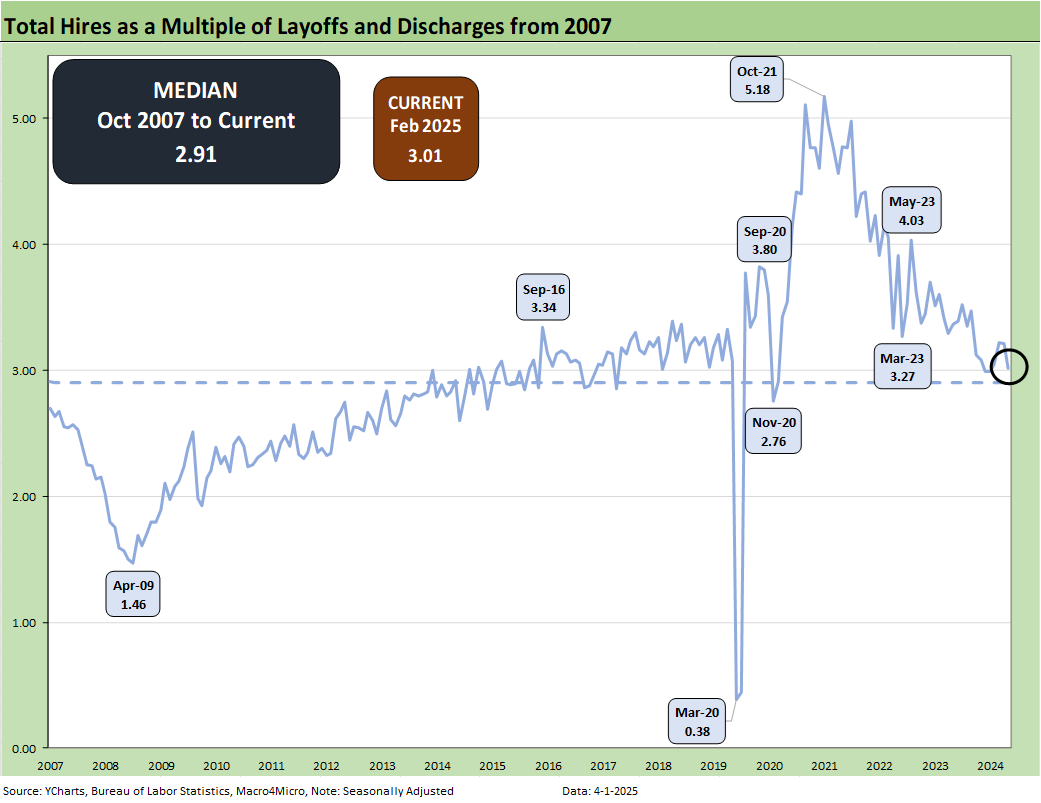
The above chart updates the ratio of Hires to Layoffs/Discharges. The relationship declined sequentially this month but is slightly above the long-term median presented from 2007. That post-2007 period includes the longest recession since the Great Depression and the COVID pandemic.
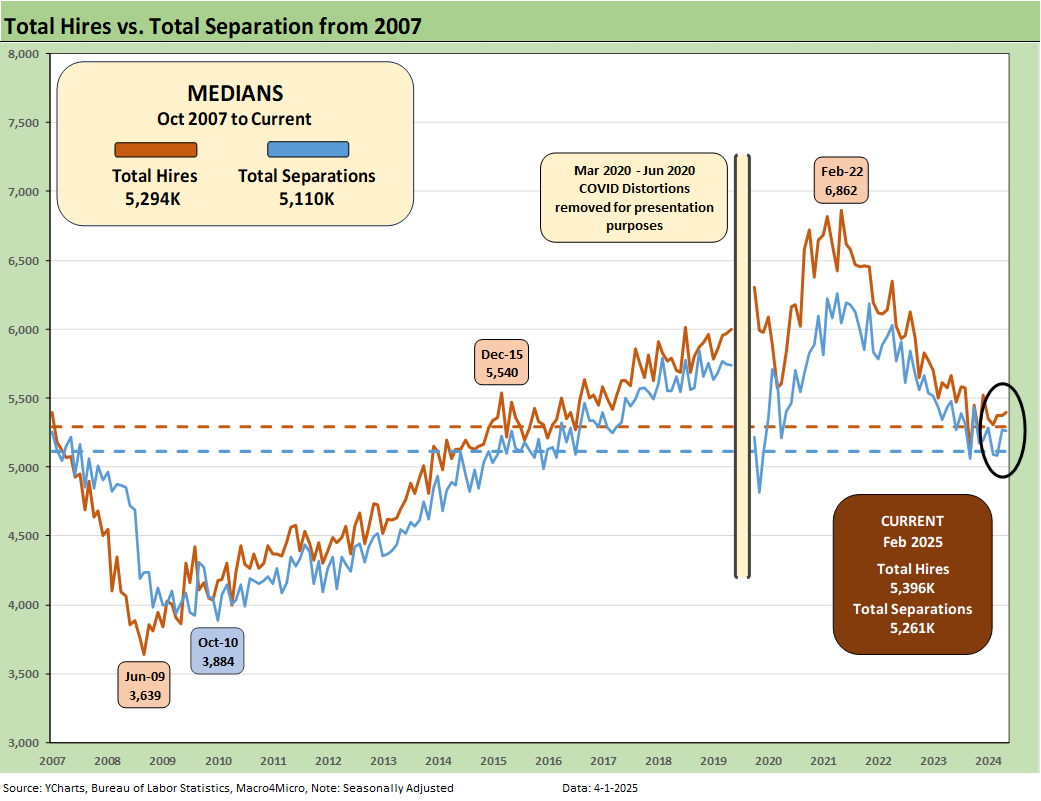
The above chart plots Hires vs. Total Separations on a SAAR basis. Separations include Quits, Layoffs/Discharges, and “Other Separations.” We remove the COVID numbers from this chart to support the visual value for “normal” periods. Those COVID impacts are detailed further below. Separations in total were down by -11K sequentially.
We typically do not find “Total Separations” very interesting as a multi-line net number. The most important moving parts are Hires and Layoffs/Discharges. “Other separations” could get more interesting in a world of mass deportation when people get “disappeared.” Did they “quit” by not showing up for work or did they get “othered.”
There is also the uncertainty of how the de facto labor force gets measured and how many are “off the books.” As the year goes on, those questions could be more important. “Other Separations “were down by -67K in February.
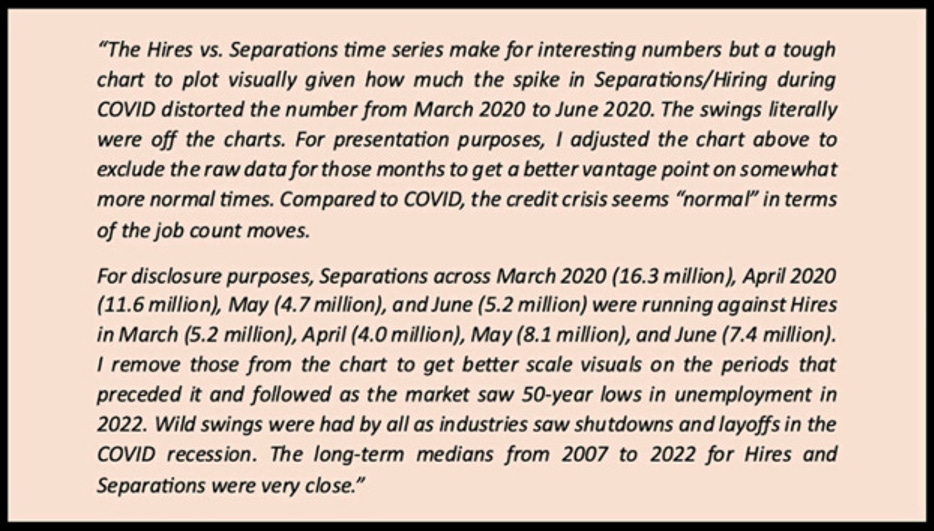
The above text box is our recurring recap of the COVID period. Almost 28 million Separations combined in March-April 2020 is a brutal reminder of that period. That hopefully will be the last time we ever see that. That is especially with RFK Jr at the helm and vaccination personnel being purged this past week.
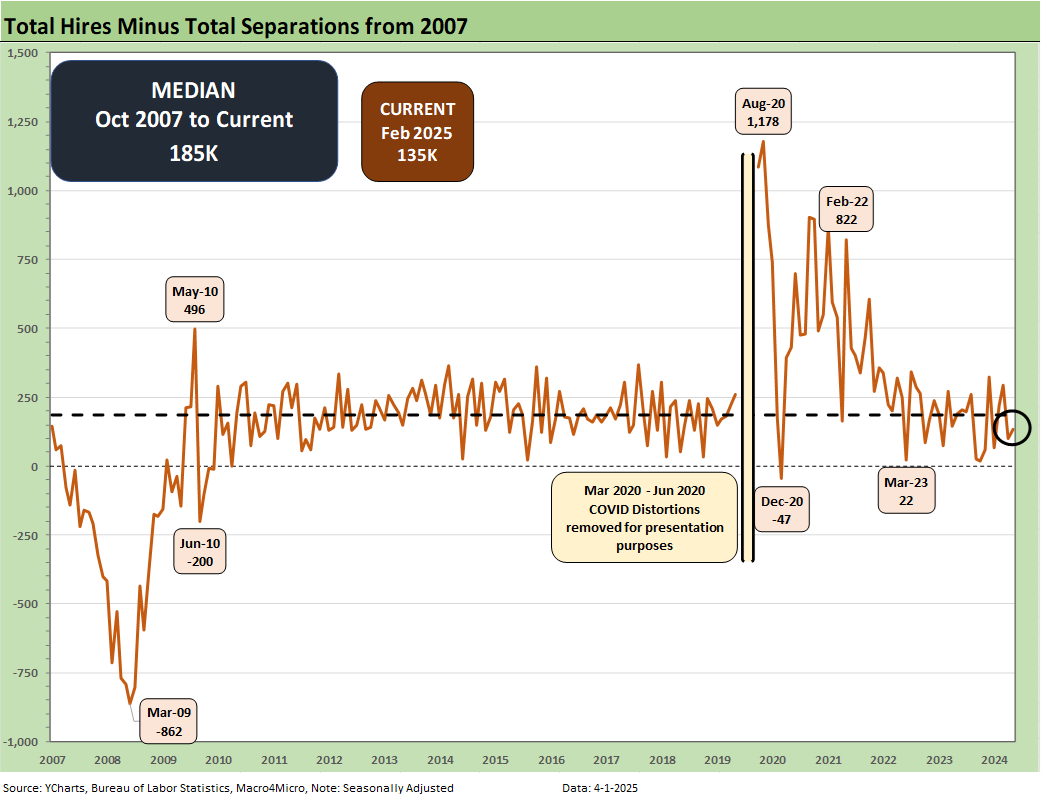
The Hires Minus Total Separations differential is plotted above. Hires moved slightly higher and total Separations moved lower. The net number thus moved higher sequentially but is below the long-term median.
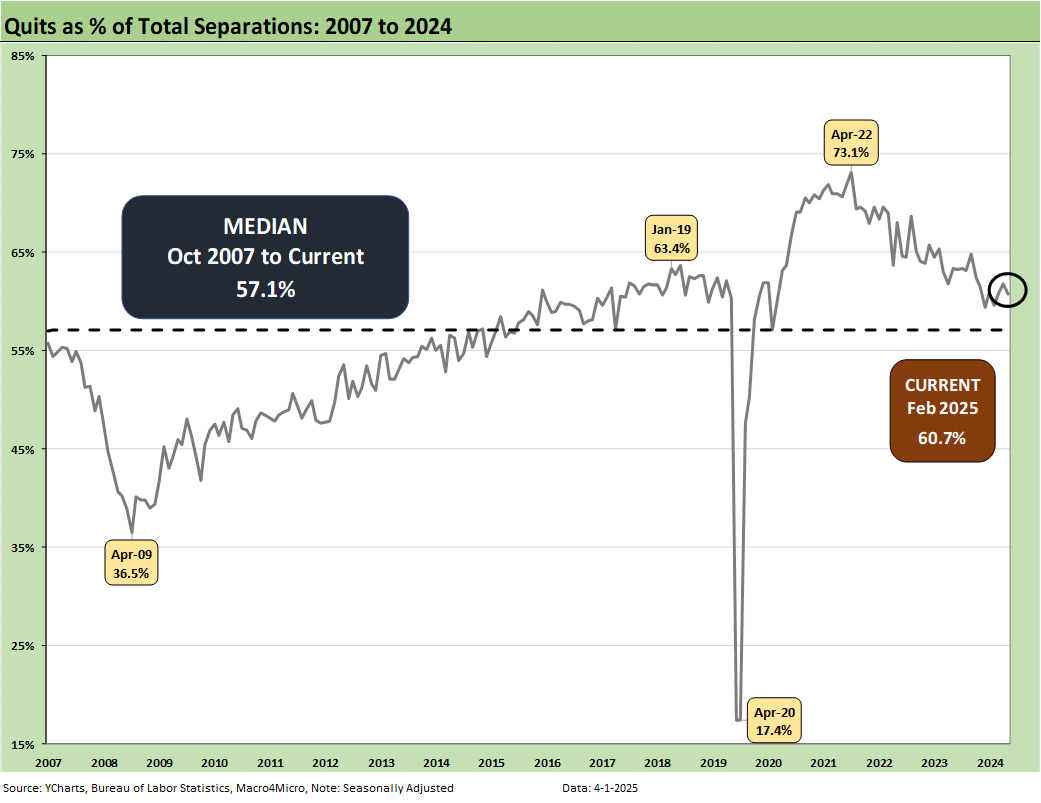
The time series for Total Quits as a % of Separations (SAAR basis) ticked slightly lower this month to 60.7% and is modestly above the long-term median. The classic “Quits Rate” is measured by Total Quits as a % Total Employment, and that metric was flat on the month as revised at 2.0%. The Quits rate has ticked lower YoY from 2.2% to 2.0%.