
JOLTS Jan 2025: Old News, New Risks in the Market
We look at Jan 2025 JOLTS, which were released today on a belated schedule for a world that seems long ago.


Will trade wars shift payroll odds?
The Job Openings tally came in modestly higher sequentially at +3.1%, but 6 weeks seems like a very long time ago given the emerging realities of tariffs and deportation, the tangible evidence of geopolitical ill will that could influence retaliation, and generally bad economic policy is seeing the securities market cast its vote.
Potential employers and corporate capex budgets might change their votes on prospects and even retrench as the full impact of policies is felt at a lag.
A lot has happened since January, and we already have Feb 2024 job numbers in hand after a delay in the release of JOLTS by the BLS (JOLTS usually released days ahead of payroll).
Trump inherited a Jan 2025 Job Openings number of 7.74 million in Jan 2025 that is higher than the highest from Trump 1.0 which was 7.59 million in Nov 2018. That peak in Trump 1.0 went steadily lower in 2019 (even before COVID) as tariffs, soft investment, and weak exports weighed on the economy and led to the Fed to ease in 2H19. Replay?
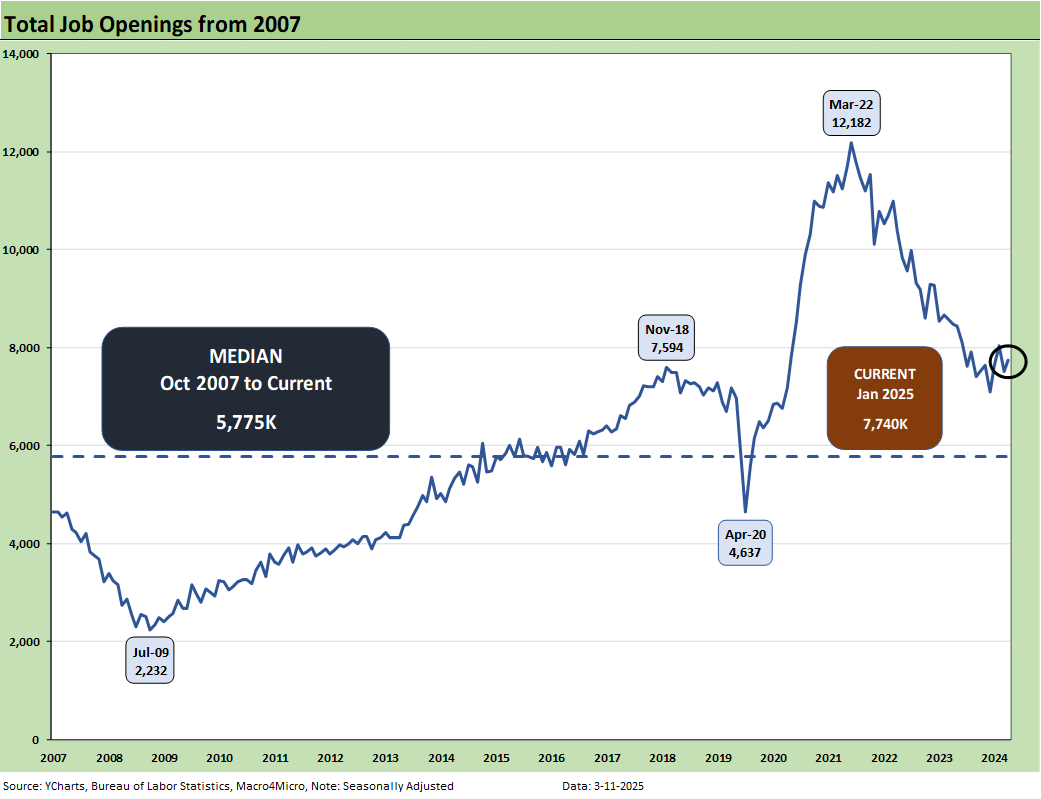
The JOLTS data for Jan 2025 is ancient history given all the has transpired the past 6 weeks, but the Nov 2018 print reminds us that economic growth in Trump 1.0 is not consistent with the Team Trump sales pitch. His recent speech revisited what he called the “greatest economy in history” (see Gut Checking Trump GDP Record 3-5-25, Trump's “Greatest Economy in History”: Not Even Close 3-5-25), but we are seeing some big questions in the markets now.
Trump’s peak Job Openings number in Trump 1.0 is highlighted above in Nov 2018 at 7.59 million. The 7.74 million number for Jan 2025 happened with 1/3 of the month under Trump based on inauguration. Just given the reality of the moment and all the post-election stock market enthusiasm, we can call January Trump’s month 100% and can say that Trump actually just had his best JOLTS month ever.
The sentiment is shifting quickly as the stock market has hammered home and the UST downshift is signaling. We will see soon enough what the next payroll looks like for March and how JOLTS frames up in the next few months. With Trump on the screen today announcing a doubling of steel and aluminum tariffs from Canada, more of the same retaliation lies ahead and economic pressures will be rising broadly.
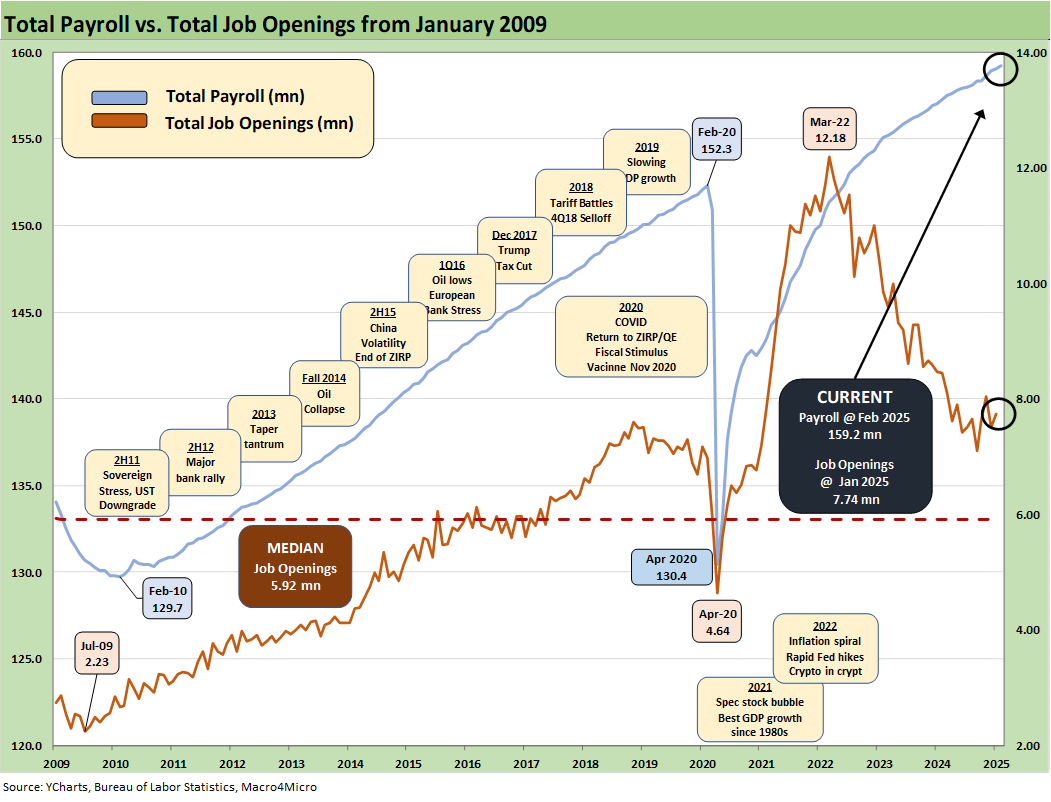
The above chart updates the total payroll number vs. Job Openings. We usually include this chart with the payroll numbers, but JOLTS came after payroll this month (see Payrolls Feb 2025: Into the Weeds 3-7-25, Employment Feb 2025: Circling Pattern, Lower Altitude 3-7-25). Extremely high payrolls remain a fact, and the question is how those jobs will hold up in the face of unprecedented tariffs slated to roll in across the spring with more to come.
To this point, Trump has in substance (not officially) terminated the USMCA as the new NAFTA he had negotiated. This makes his behavior all the more perplexing. The selection of his cabinet this time around has skipped the 13th amendment, so there is zero pushback.
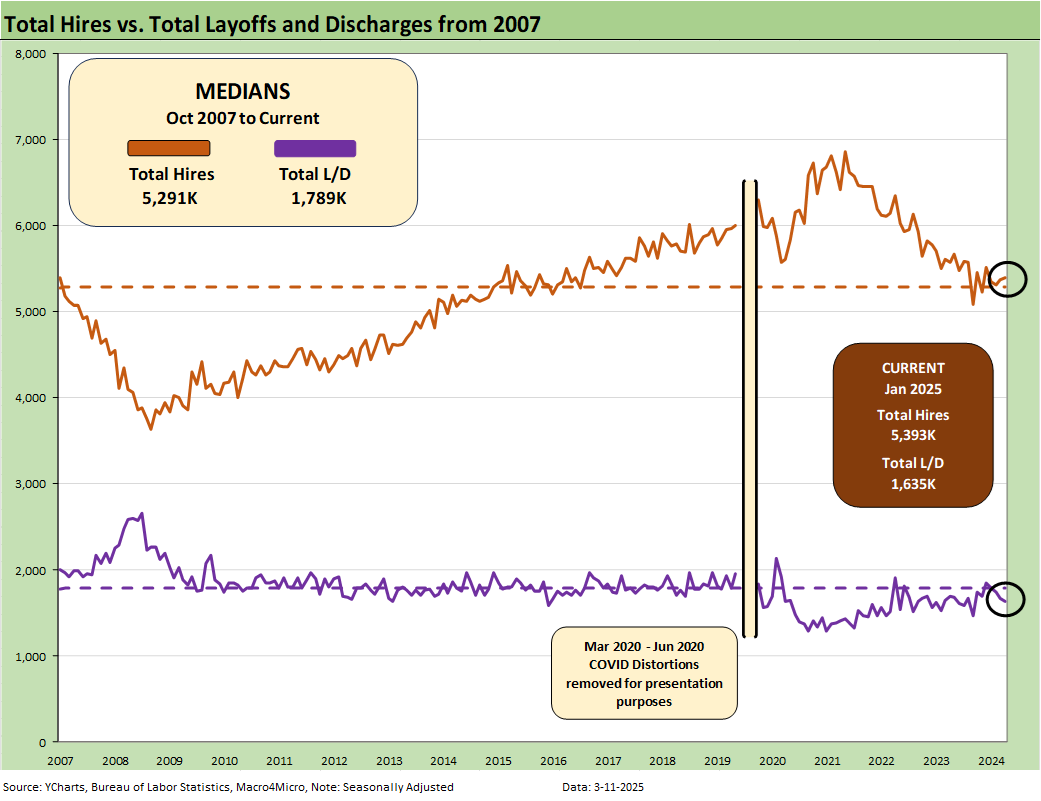
The above chart plots Hires vs. Layoff/Discharges on a SAAR basis. We remove the COVID numbers from this chart to support the visual value for “normal” periods. Those COVID impacts are detailed further below. Hires were essentially flat (up very slightly) during the month. Layoffs and Discharges ticked lower by -34K or by -2.0%
Government layoff/discharge numbers were down slightly. The Federal level weighed in at only -1K lower (hold that thought). The quality of these JOLTS numbers will get gut checked in 1Q25 on the layoff and discharge side of the equation. We assume Feb and March Federal layoffs/discharges will spike. State and Local were down by -19K in Jan 2025, which is a sharp decline of 21% off a small base of 90K in Dec 2024.
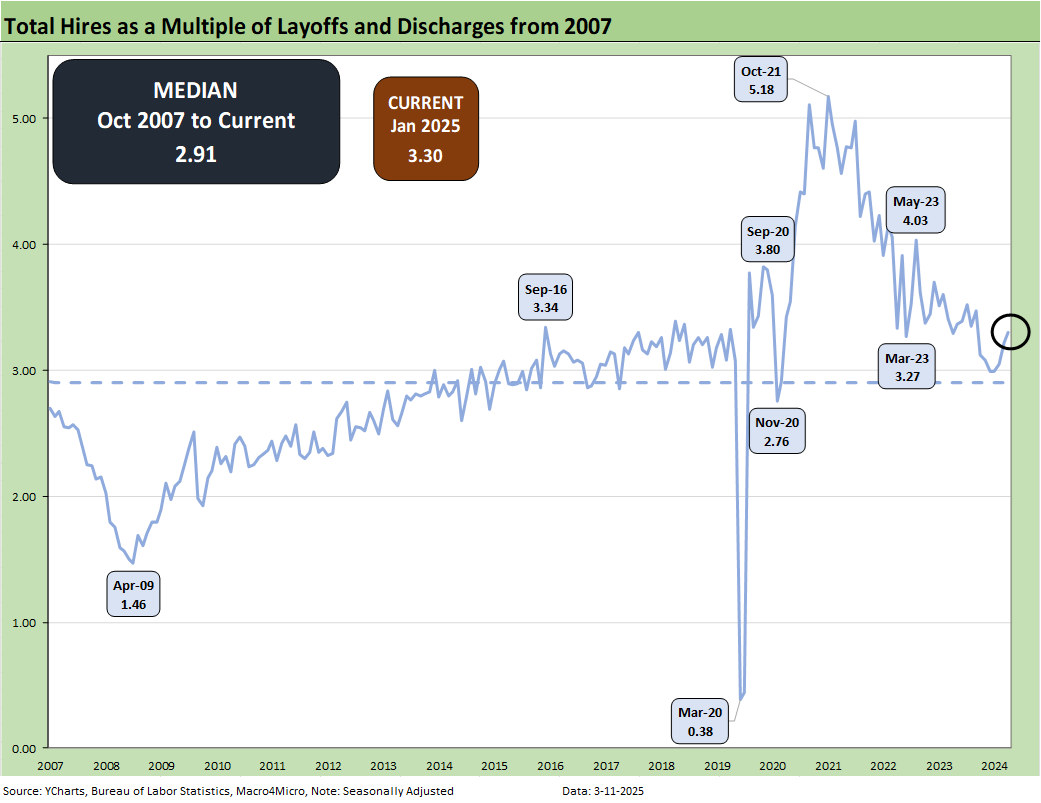
The above chart updates the ratio of Hires to Layoffs/Discharges. The relationship improved this month and is modestly above the long-term median presented from 2007. That post-2007 period includes the longest recession since the Great Depression and the COVID pandemic.
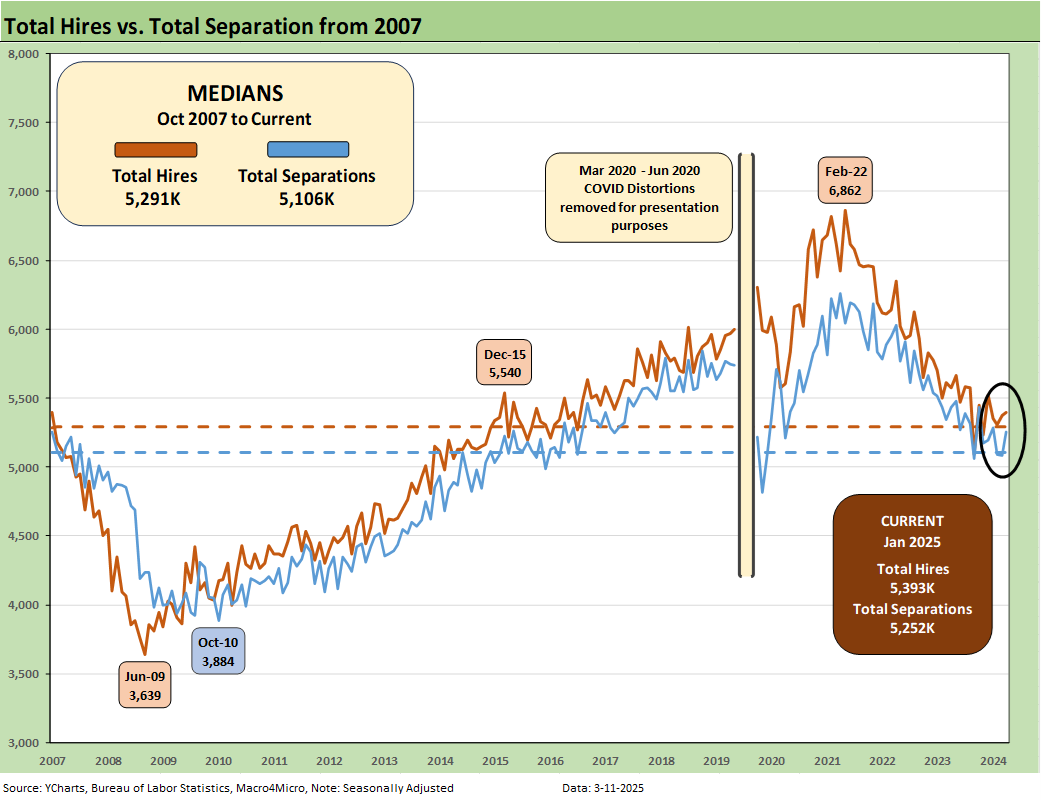
The above chart updates the time series for Hires vs. Total Separations. The “Separations” bucket includes Layoffs/Discharges, Quits and “Other Separations.” We will remain intrigued to see how the BLS handles the deportation numbers that in theory would fall under “Other Separations” or “Layoffs/Discharges.” We see “Other Separations” rise to 350K in Jan 2025 or by just over 10% vs. Dec 2024.
We imagine there would be some hesitancy of employers to cite the exit of undocumented workers in a deportation action. Capturing the labor supply-demand imbalances that are unfolding in some industries and regions might be hard to capture.
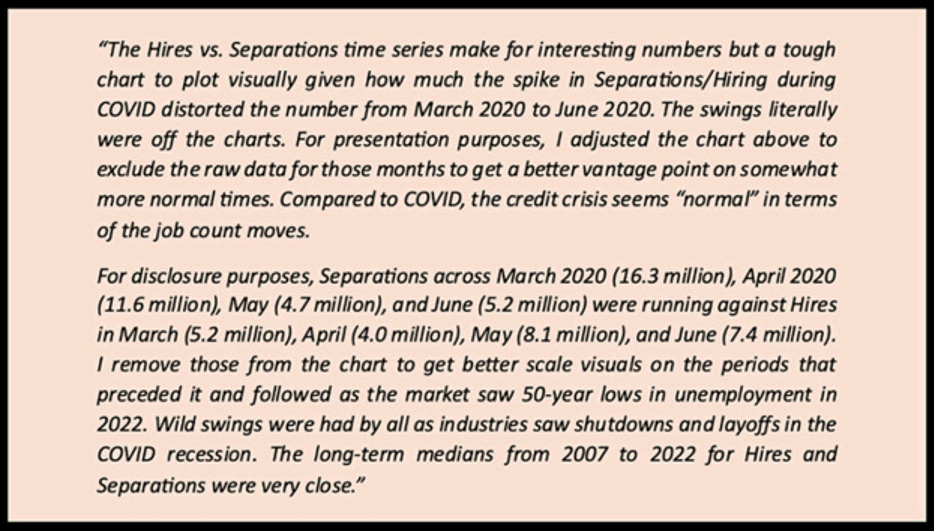
The above text box is our recurring recap of the COVID period. Almost 28 million Separations combined in March-April 2020 was a brutal reminder of that period. That hopefully will be the last time we ever see that.
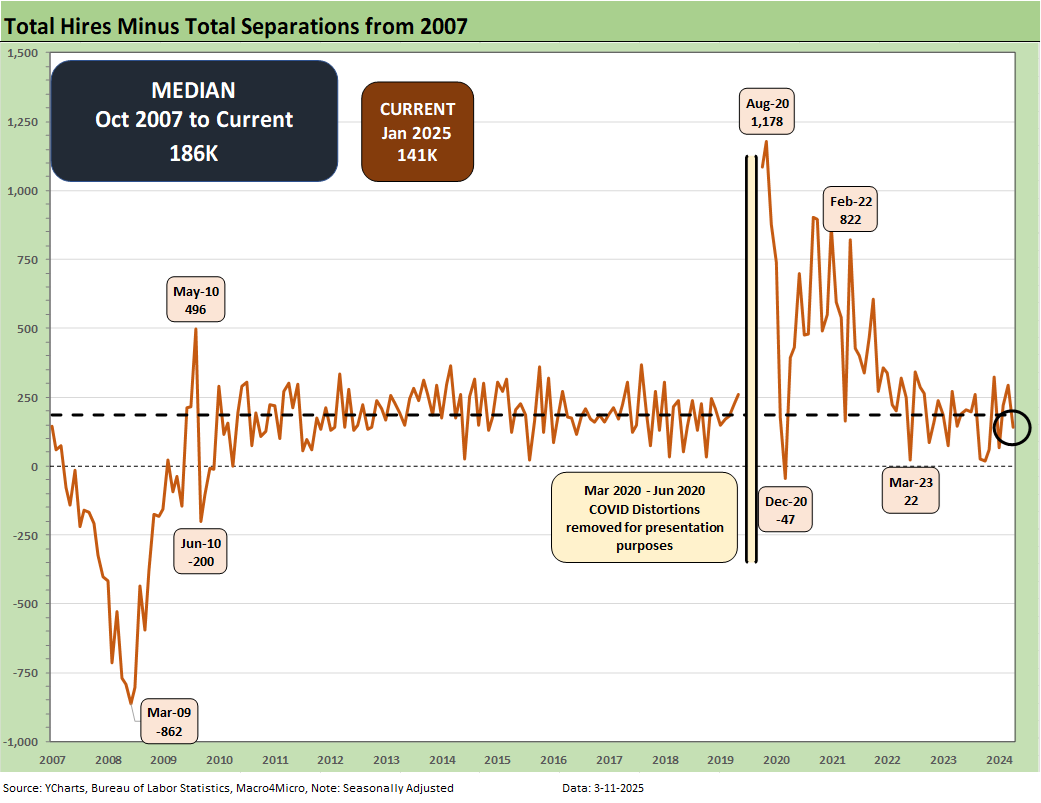
The Hires Minus Total Separations differential is plotted above. That number moved lower sequentially and is below the long-term median.
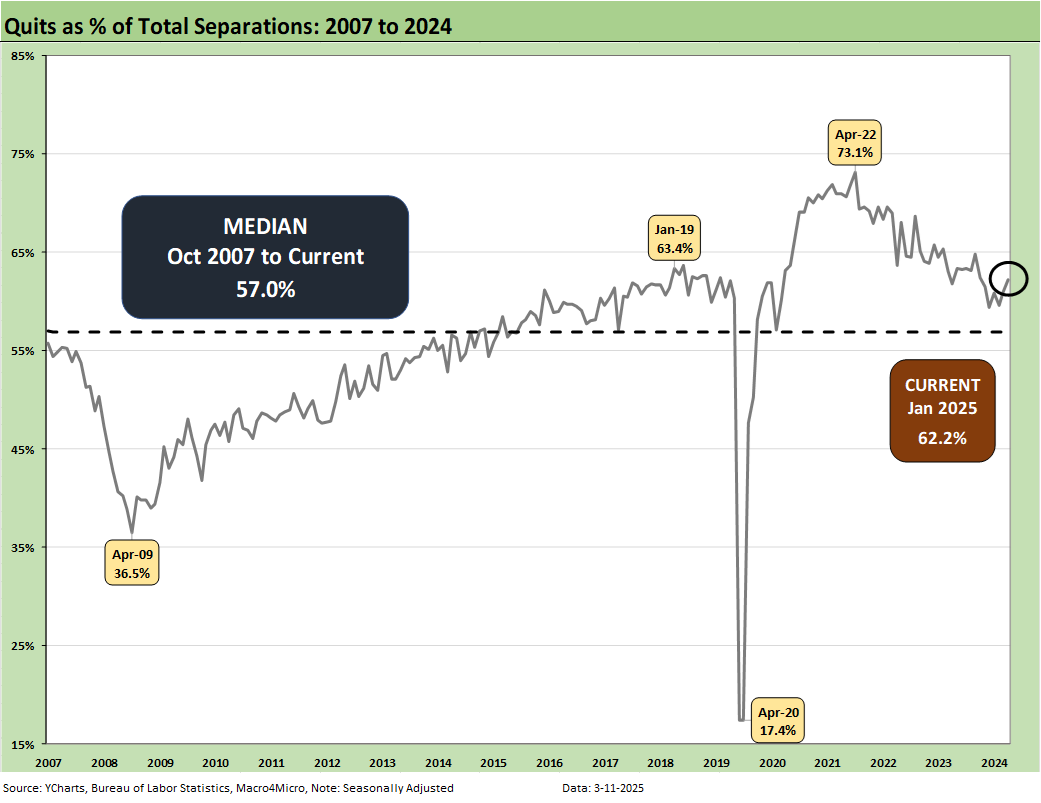
The time series for Total Quits as a % of Separations (SAAR basis) ticked slightly higher this month to 62.2% and is modestly above the long-term median. The classic “Quits Rate” is measured by Total Quits as a % Total Employment, and that metric moved higher on the month to 2.1% from a revised 1.9% in Dec. The Quits rate is flat YoY at 2.1% vs. Jan 2024.
See also:
Auto Suppliers: Trade Groups have a View, Does Washington Even Ask? 3-11-25
Credit Spreads Join the Party 3-10-25
Footnotes & Flashbacks: Credit Markets 3-10-25
Footnotes & Flashbacks: State of Yields 3-9-25
Footnotes & Flashbacks: Asset Returns 3-9-25
Mini Market Lookback: Tariffs Dominate, Geopolitics Agitate 3-8-25
Payrolls Feb 2025: Into the Weeds 3-7-25
Employment Feb 2025: Circling Pattern, Lower Altitude 3-7-25
Tariffs: Enemies List 3-6-25
Gut Checking Trump GDP Record 3-5-25
Trump's “Greatest Economy in History”: Not Even Close 3-5-25
Asset Returns and UST Update: Pain Matters 3-5-25
Happy War on Allies Day 3-4-25
Mini Market Lookback: Collision Courses ‘R’ Us 3-2-25
PCE Jan 2025: Prices in Check, Income and Outlays Diverge 2-28-25
Durable Goods Jan25: Waiting Game 2-27-25
GDP 4Q24 Second Estimate: PCE Inflation the Main Event 2-27-25
New Homes Sales Jan 2024: Homebuilders Feeling Cyclical Signals? 2-26-25
Existing Home Sales Jan 2025: Prices High, Volumes Soft, Inventory Up 2-21-25
AutoNation: Retail Resilient, Captive Finance Growth 2-21-25
Toll Brothers 1Q25: Performing with a Net 2-20-25
Housing Starts Jan 2025: Getting Eerie Out There 2-19-25
Herc Rentals: Swinging a Big Bat 2-18-25