
Payrolls Feb 2025: Into the Weeds
We look under the hood at the industry variances below the headline +151K nonfarm payroll adds. February passes the absence of bad news test.


Consumer appetite fading?
Total nonfarm payroll increased +151K in February, signaling continued labor market expansion albeit at a moderating pace typical of later stages of a cycle. This data is still ‘too early’ to parse when policy and headline uncertainty is playing out in dramatic fashion.
The leaders in this report were Healthcare (+63K), Financial Activities (+21K), and Construction (+19K). Financial Activities have been a relatively bright spot in the past few months with real estate and insurance demand driving growth.
One spot of concern in this report comes from Food and Beverage linked services cumulatively detracting 42.5K jobs (-27.5K in “Food services and drinking places” + another -15.0K in Food and Beverage Retailers”). The reduction in such consumer-driven services payrolls is not a strong signal about consumer demand but it is another data point that adds to some mounting anxiety about consumer health or propensity to spend.

The above chart covers the month-to-month changes for major industry line items in the headline report. February numbers continue the recent trend of moderating headline growth to a level below the long-term median. We see this as a report representative of the continued concerns ahead of upcoming adjustments tied to the chaos of policy changes and tariff implementation. We await the final output of and constantly changing tariff decisions, and those outcomes with drive the supply and the demand side. Any changes to cost structures driven by tariffs flow into a recalibration of payrolls as well. With payrolls already moderating, the path to sustained resilience of the labor market would benefit more from policy finesse and not the current sledgehammer approach.
The top industries this month have no major surprises with financial activities, but a new entry into the Top 3 is tied to a combination of real estate and insurance. Both have been in steady growth mode, and we see the entrance into the top 3 more about moderation elsewhere than particularly strong growth. This release also sees stronger demand for both Construction and Durable Goods manufacturing this month, providing some positive signal around broader economic activity. Those can change quickly on policy decisions in the near term.
On the left-hand side of the chart, weakness in the Food and Beverage Services and Retailers underpinned the softness in Leisure and Hospitality and Retail Trade. Though one could point to shifts in customer service due to technology contributing to the weakness, declines in Leisure and Hospitality could signal flagging consumer demand. For now, we place it in the bucket of “areas of concern” that in the bigger picture of consumer health and demand.
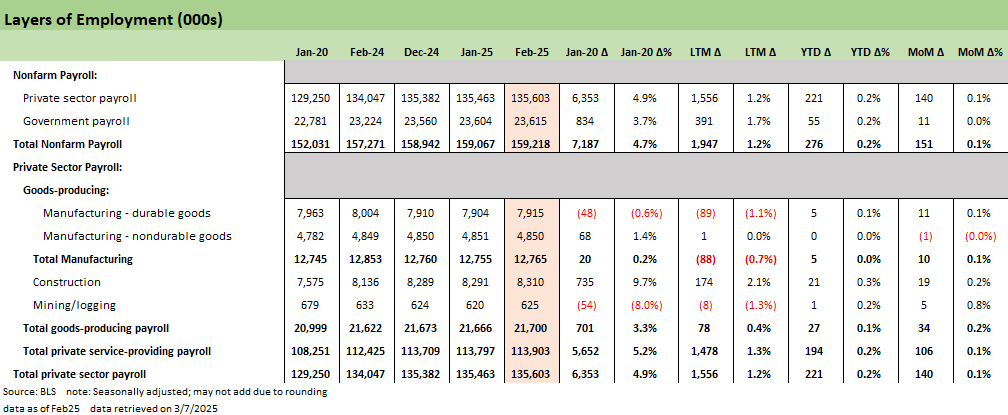
The next series of charts including the one above provides some key time horizons for different industry groups, providing more granular information for the headline number. This one covers the broadest groupings with the added context of goods-producing details.
A notable feature of this report is the relative strength and stability of goods-producing industries. The 34K adds underpinned by strong construction and transportation growth contributed almost 25% of the private sector adds from a base that accounts just over 16% of private sector jobs. The relative growth is driven by the less volatile nature of Manufacturing relative to Services, but at least the signal appears to lend a more stable interpretation to an unimpressive additions number this morning. Tariff policy is a major wildcard in planning, and structural drags in durables in the form of increasing costs still will face the cyclical influence of demand in domestic manufacturing.
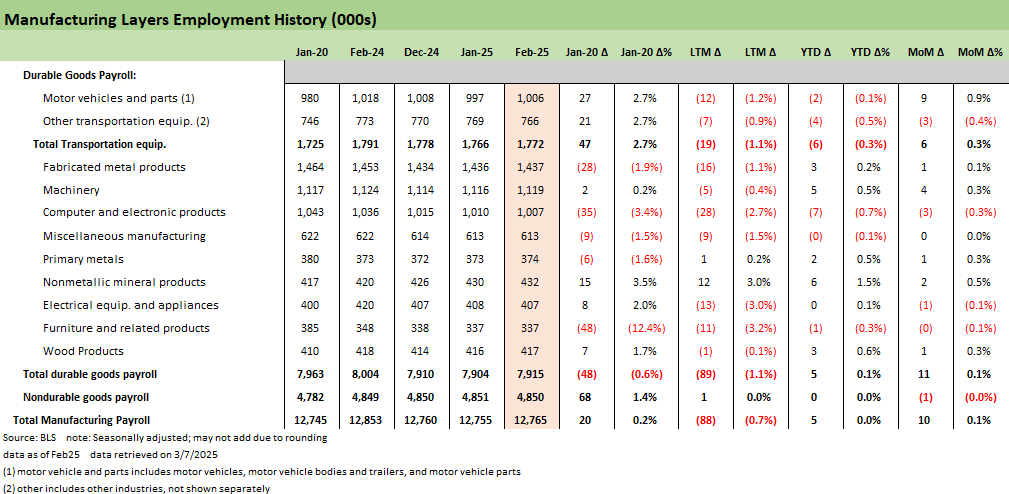
The above chart details those manufacturing layers where we look across the LTM and post-COVID periods to see the challenges faced by the hopes for a US manufacturing renaissance. Only two industries above are positive LTM (Primary metals, Nonmetallic mineral products) as the long-term trends continue to evidence the declines in US domestic durables manufacturing payrolls. Post-COVID trends show 6 positive and 5 contracting lines with both transport equipment lines at a respectable 2.7% growth from Jan 2020.
The good news on the month is that things are positive with Motor Vehicles and Parts bouncing back from a down month. The dampening effect of contraction in January still leaves Transport Equipment in the red YTD and the overall manufacturing number relatively flat. The largest drag on this year is Computer and Electronic Products, where a post-COVID decline continues to weigh on the broader manufacturing sector.

We separate out the Nondurable Manufacturing lines above. These cover several declining industries and looking across the post-COVID period is telling as to which industries are relegated to the secular wayside. Textile and printing activities are among the big secular losers.
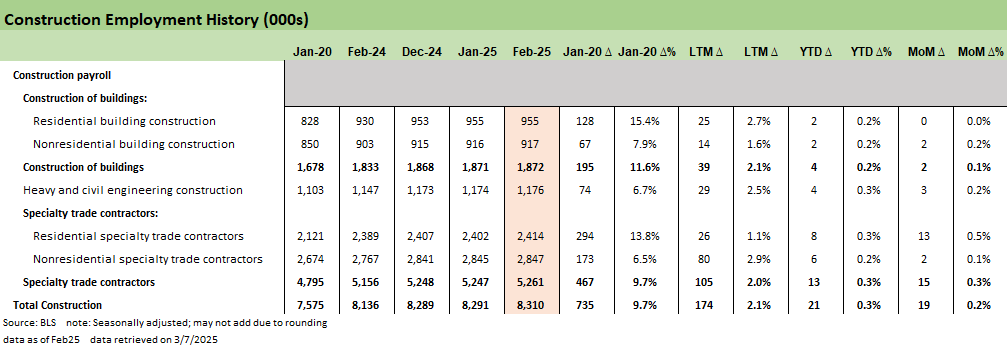
This chart covers the strong month for construction payroll adds that maintains the strong, steady growth in the LTM period and beyond. The need for more construction as projects continues is indicative of the positive economics and investment still seen as accretive for various operators. This month sees the largest gains for Residential Specialty Trade Contractors (+13K). Though the existing home sales picture is starting to look weaker, that does open up for avenues for more renovation and other contract work as homeowners are thinking about staying put for longer.

Service sector trends as shown above have had one major constant in the last year and that is the incredible demand in Healthcare and Social Assistance. This month was no different as there were +63K further payroll additions, making up most of the Service gains this month. Transport and warehousing also marked a strong month within services and off to a strong year as the area that has seen the most post-COVID growth.
We have already discussed the lackluster month for Leisure and Hospitality and Retail Trade where both show poor results in food and beverage related items. The other weak spot for Services this month is the -9K contraction for Professional and technical services. We see this accounted for in computer systems design and related services area that remains relatively flat from March 2022 levels. That is an area undergoing disruption from the current developments in AI related technologies.
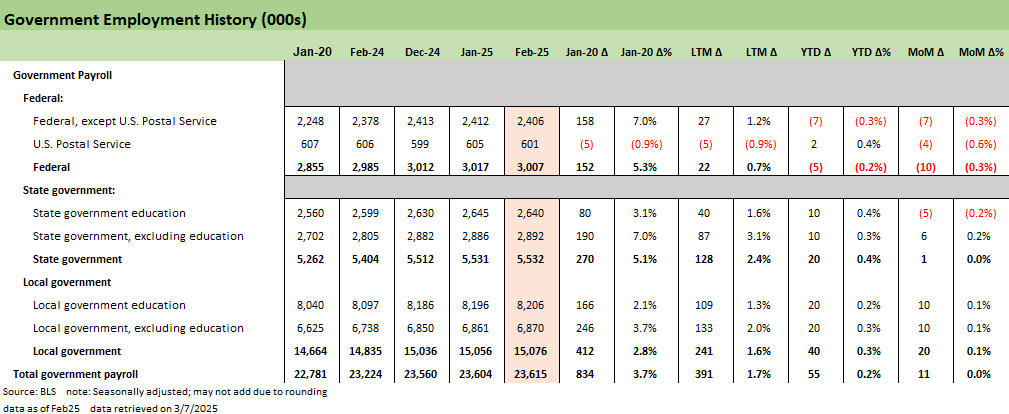
The last chart in the group is the Government employment lines, where we note the Federal employment line under fervent targeting by DOGE represents just over 10% of the Government payroll. We do not understate the importance of these departments and offices being well-functioning and staffed. However, in the broader picture of the headline numbers, the market will be quick to isolate these and discount them in their assessment of the signal derived from the month-to-month payroll variances upcoming. A positive this month despite the reductions in Federal payroll (-10K) is driven by Local Government hiring (+20K) that highlights ongoing need for support staff even as Government excess and inefficiency is a news cycle staple.
The overall numbers today point to a moderating but stable enough labor market with positive goods-producing and manufacturing signals contrasting with slightly weaker food and beverage demand.
The main question on the investor’s mind is how the Fed will read the current state of the economy and the impact that tariff policy will have with consumers set to face further price challenges and inflation ahead. The tariff topic we cover in detail on other commentaries. The risk-reward symmetry of what is being proposed (real or otherwise) is skewed to the negative side for payrolls in 2025.
See also:
Employment Feb 2025: Circling Pattern, Lower Altitude 3-7-2
Tariffs: Enemies List 3-6-25
Gut Checking Trump GDP Record 3-5-25
Trump's “Greatest Economy in History”: Not Even Close 3-5-25
Asset Returns and UST Update: Pain Matters 3-5-25
Happy War on Allies Day 3-4-25
Footnotes & Flashbacks: Credit Markets 3-3-25
Footnotes & Flashbacks: Asset Returns 3-2-25
Footnotes & Flashbacks: State of Yields 3-2-25
Mini Market Lookback: Collision Courses ‘R’ Us 3-2-25
PCE Jan 2025: Prices in Check, Income and Outlays Diverge 2-28-25
Durable Goods Jan25: Waiting Game 2-27-25
GDP 4Q24 Second Estimate: PCE Inflation the Main Event 2-27-25
New Homes Sales Jan 2024: Homebuilders Feeling Cyclical Signals? 2-26-25
Existing Home Sales Jan 2025: Prices High, Volumes Soft, Inventory Up 2-21-25
AutoNation: Retail Resilient, Captive Finance Growth 2-21-25
Toll Brothers 1Q25: Performing with a Net 2-20-25
Housing Starts Jan 2025: Getting Eerie Out There 2-19-25
Herc Rentals: Swinging a Big Bat 2-18-25
UST Yields: Sept 2024 UST in Historical Context 2-17-25
Tariff links:
Auto Tariffs: Japan, South Korea, and Germany Exposure 2-25-25
Mini Market Lookback: Tariffs + Geopolitics + Human Nature = Risk 2-22-25
Reciprocal Tariffs: Weird Science 2-14-25
US-EU Trade: The Final Import/Export Mix 2024 2-11-25
Aluminum and Steel Tariffs: The Target is Canada 2-10-25
US-Mexico Trade: Import/Export Mix for 2024 2-10-25
Trade Exposure: US-Canada Import/Export Mix 2024 2-7-25
US Trade with the World: Import and Export Mix 2-6-25
The Trade Picture: Facts to Respect, Topics to Ponder 2-6-25
Tariffs: Questions to Ponder, Part 1 2-2-25
US-Canada: Tariffs Now More than a Negotiating Tactic 1-9-25
Trade: Oct 2024 Flows, Tariff Countdown 12-5-24
Mexico: Tariffs as the Economic Alamo 11-26-24
Tariff: Target Updates – Canada 11-26-24
Tariffs: The EU Meets the New World…Again…Maybe 10-29-24
Trump, Trade, and Tariffs: Northern Exposure, Canada Risk 10-25-24
Trump at Economic Club of Chicago: Thoughts on Autos 10-17-24
Facts Matter: China Syndrome on Trade 9-10-24