
Mini Market Lookback: Self-Inflicted Vol
A crazy week of tariff tit-for-tat threats drove a more bearish view of trade war risk with equities bashed but the UST stable.


Tariff boxers touch gloves.
Equities were pummeled on the week despite Friday’s rally. The S&P 500 went into correction mode in just over 2 weeks with all the major equity benchmarks in the red for the week and 9 of 11 S&P 500 sectors negative (ex-Utilities, Energy).
Credit markets finally caved with spreads spiking from June 2007 OAS levels but only to spreads still in the zone of those seen in the June 2014 an Oct 2018 credit spread lows. HY OAS could rise by over +125 bps and still be below the long-term median, so the risk-reward symmetry is shaky (see Credit Spreads: Pain Arrives, Risk Repricing 3-13-25, Credit Spreads Join the Party 3-10-25).
Our collection of 32 benchmarks and ETFs show negative numbers exceeding positive for 1-week, 1-month and 3-months.
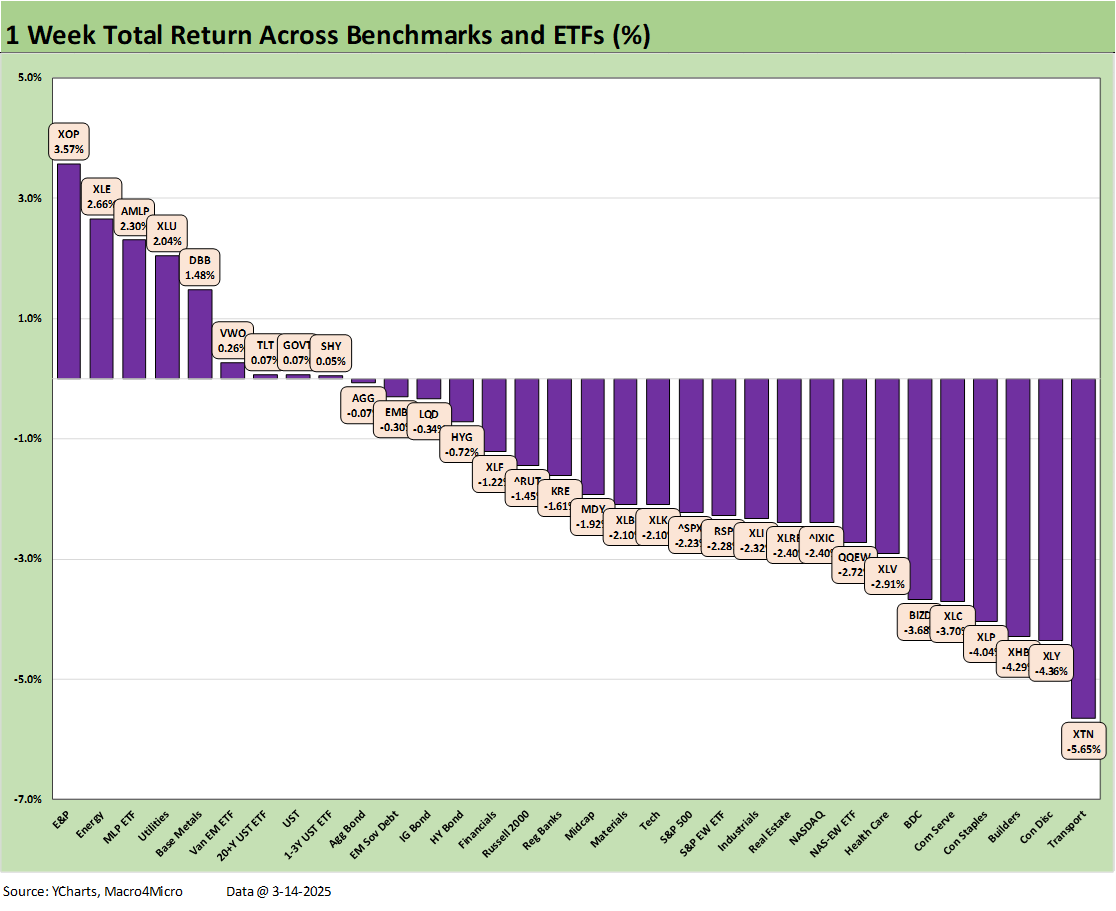
The 1-week returns for our 32 benchmarks and ETFs show a score of 9-23 as equities were broadly pounded. Energy had a good week at #1 with the E&P ETF (XOP), the broad Energy ETF (XLE) at #2, and the high-dividend Midstream Energy ETF (AMLP) at #3. Utilities (XLU) is a defensive sector in the income stock group with a modest “growth kicker” on rising power needs, and XLU came in at #4 followed by the Base Metals ETF (DBB) with EM Equities (VWO) steady and rounding out the Top 5.
We then see the bond ETFs fill in the rest of the positive returns in the top quartile and just across the line into the second quartile. The long duration UST (TLT), UST ETF (GOVT) and Short UST 1-3Y ETF (SHY) were positive and then we see slight negatives on the remaining 4 bond ETFs with AGG, LQD, EMB and HYG.
The bottom tier shows Transport (XTN) in dead last as airlines took a beating on earnings warnings from the major carriers. Keeping the consumer worry theme going, we see Consumer Discretionary (XLY) seeing TSLA hammered again and more warnings from Retail with Amazon slightly negative. Homebuilders (XHB) remain mired in the bottom tier at 3 off the bottom.

The above chart updates the returns for tech bellwethers the past week with the line items in descending order of returns for the week. The result is straightforward with 6 of the Mag 7 in the red with all line items posting negative returns for the 1-month and 3-months time horizons. We look at the longer time horizons in more detail in the Footnotes publication on asset returns to be posted later this weekend.
Looking back over 6-months, only Broadcom and Meta are in double digits. Tesla was battered at -29.8% for 1-month and -42.7% for 3-months and even dropped back to single digits positive returns for 6-months.

The above frames the UST deltas for the week. The minimal moves mark a departure from the bearish or bullish moves seen routinely over the past few months. It was a very noisy week in equities that did not bring much of a response in UST after some earlier rallies we saw off cyclical fears. One theory is that the stagflation theme lurks more than before and mitigates the typical “flight to quality” trade.
Interestingly, the Friday news in the U Mich consumer sentiment was brutal in the area of inflation expectations with the 1-year inflation expectation up to 4.9% from 4.3% last month. That is obviously a big move and is up 2 full points from March 2024. The 5-year expectations moved up to 3.9% from 3.5%. That 3.9% in turn is up from 2.8% in March 2024.
The inflation expectation metrics are more important than the decline in the headline sentiment metrics, but that headline sentiment metric was no picnic as it hit a 28-month low. The index was down 22% from Dec 2024. The “expected” index was down by almost 10 points sequentially.
On the consumer topic, the sharp revisions from the airlines this past week offer more data points on the growing unease across an expanding base of discretionary consumer activities. That flows into leisure and travel broadly, and the bad volume news in air travel flowed into such subsectors as car rental and hotel/lodging. We get Retail Sales released this coming week. That will be interesting after this consumer news but next month will be more telling as more tariff noise flows in.

The above chart updates the YTD UST deltas that still show a bull flattener into March.
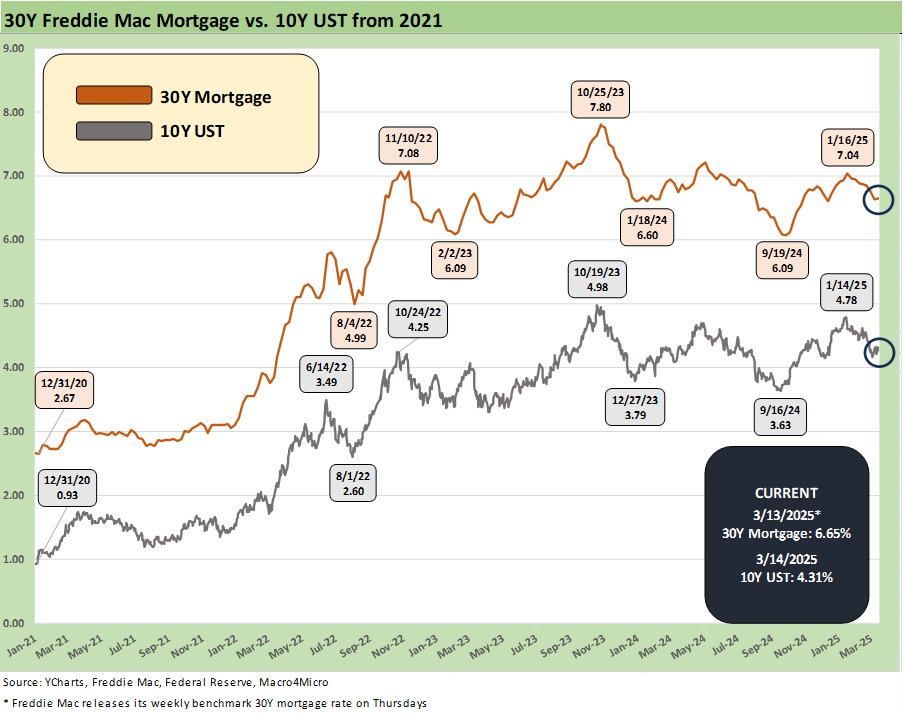
The above chart updates the running Freddie Mac 30Y mortgage benchmark against the 10Y UST. Very little action this week, and it was more notable for not moving given the screaming headlines and tariff battles starting to form.

We update the HY OAS, which rallied on Friday by -15 bps but still cleared the week at +28 bps wider to +325 bps from +297 bps and the trailing 1-month period (not MTD) by +60 bps. That is +66 bps above the Jan 2025 lows and +65 off the Nov 2024 lows.
As we discuss in our Footnotes – Credit Markets publication (see Footnotes & Flashbacks: Credit Markets 3-10-25, to be updated on Monday), the +300 bps HY OAS line is rarely crossed and the current +325 bps is right in the zone of the June 2014 and Oct 2018 lows in HY OAS. Even after the recent widening, HY OAS is tight in historical context. It is well inside the +462 bps long-term median.
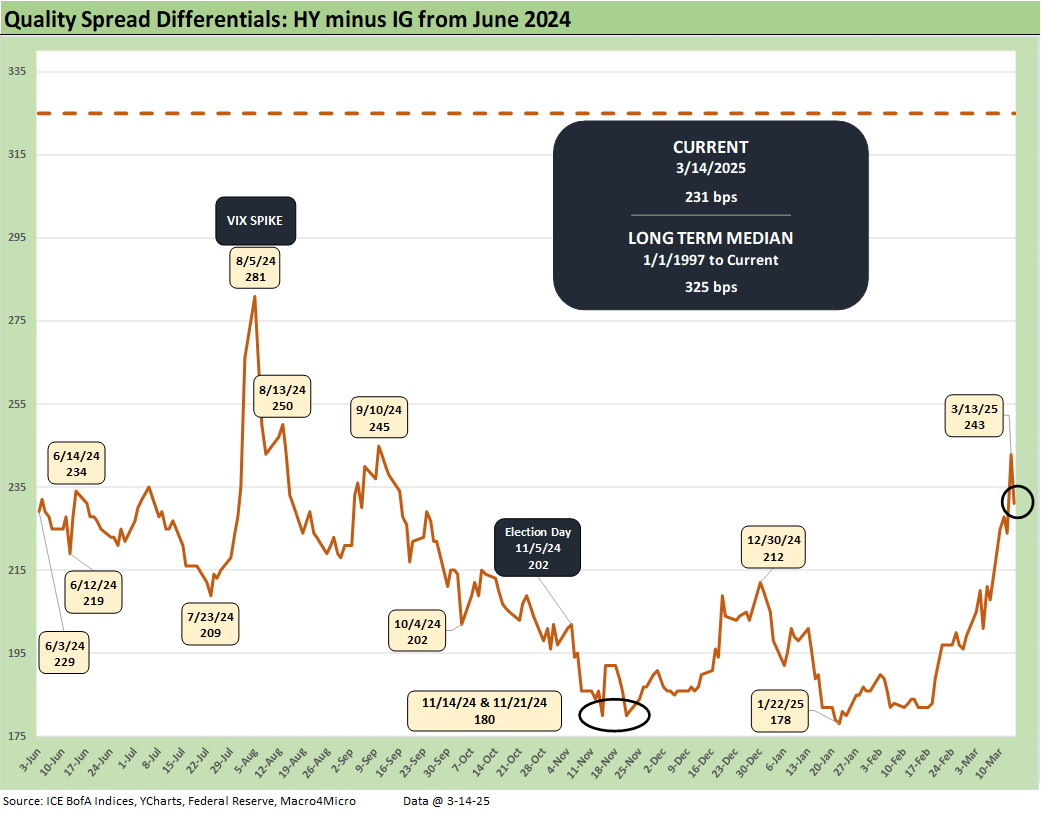
The “HY OAS minus IG OAS” quality spread differential moved from +208 bps to +231 bps. That also is still well inside the long-term median of +325 bps. That certainly leaves a lot of room for quality spread decompression even if just to get back to the median.
The tariff threat, growth worries, and stagflation debates could include the idea that Putin’s pole position as Trump ally could bring a lot of oil back into the markets and undermine upstream oil and gas credits. That last scenario is not far-fetched the way Trump has pivoted on Ukraine.

The “BB OAS minus BBB OAS” quality spread differential moved from +77 bps to +88 bps and also is still well inside the long-term median.
See also:
Credit Spreads: Pain Arrives, Risk Repricing 3-13-25
Trade: Betty Ford Tariff Wing Open for Business 3-12-25
CPI Feb 2025: Relief Pitcher 3-12-25
JOLTS Jan 2025: Old News, New Risks in the Market 3-11-25
Credit Spreads Join the Party 3-10-25
Footnotes & Flashbacks: Credit Markets 3-10-25
Footnotes & Flashbacks: State of Yields 3-9-25
Footnotes & Flashbacks: Asset Returns 3-9-25
Mini Market Lookback: Tariffs Dominate, Geopolitics Agitate 3-8-25
Payrolls Feb 2025: Into the Weeds 3-7-25
Employment Feb 2025: Circling Pattern, Lower Altitude 3-7-25