
KB Home 1Q25: The Consumer Theme Piles On
KBH trend reinforces the homebuilder fade on revenues with volumes weaker, total ASPs higher, and gross margins narrower.


Today we saw the release of the Census data on new home sales, and the positive MoM and YoY numbers offered some unusual recent good news with positive variances (we will address in a separate commentary). That release showed sequential declines in the West on a number of factors, but wildfire disruptions naturally played a role including delays from utility services and problems getting projects and properties to the finish line.
The weak KBH numbers after the bell last night on performance and revised guidance sent shares spiraling down to around -8% in the aftermarket, but KBH equity has recovered to only being down -5.0% as we go to print.
While weak numbers in Southern California relative to guidance were part of the problem, KBH joined the homebuilder equity beatdown with another Feb fiscal quarter reporting as seen at Lennar with weaker guidance and downbeat numbers. We looked at the bumpy ride for homebuilder equities in the Lennar update, and KBH was more in the middle of the pack looking back across recent time horizons (see Lennar: Cash Flow and Balance Sheet > Gross Margins 3-24-25).
The core fundamental underpinning for the major builders is favorable demographics and that element of the demand picture is intact. That said, the consumer sector is clearly crossing into a much more mixed picture with the overused term “uncertainty” weighing on outlooks. We get fresh PCE numbers and a consumer sentiment update later this week.

The above table offers a more comprehensive view of KHB 1Q25 numbers, and we follow this table with some that narrow in on housing margins and deliveries and ASPs by region.
KBH missed guidance for 1Q25 and revised the FY 2025 downward. The higher end of the revenue target from the 4Q24 release was moved down by $500 million. Meanwhile, the 1Q25 period saw net orders (units) down by over -16% YoY. KBH stock took an immediate hit in the aftermarket and was down by over 7% right after the earnings call.
The immediate reaction was a miss in 1Q25 and in FY 2025 downward revision in revenues and margins. KBH also cited a need to respond in 1Q25 with price cuts and incentives that further shaved margins. The good news was those actions got results in absorption rates and 2Q25 would benefit from some of the delivery delays arriving in 2Q25.

The above table breaks out the decline in revenues and gross profits. The 20.3% for 1Q25 eased lower YoY but is not far from the 21% handles of FY 2024 and FY 2023 with higher land costs and incentive costs putting some pressure on gross margins since the FY 2022 peak year posted 24.3%. Current margins are above 2019 and 2020. The gross margin squeeze is evident in revised 2025 midrange guidance to a 19%.
Volume has been the main struggle in KBH results and that has pulled down guidance with the former lower end of home sales revenue guidance ($7 bn) now the upper end. The revisions in 1Q25 guidance numbers saw $500 million shaved off the top end of the range, which is a decline of 6.7% from the 4Q24 upper end.
The gross margin in 1Q25 of 20.2% felt the effects of price actions and higher incentives as the quarter unfolded as demand lagged expectations. The incentives worked and pace picked up, but that volume came at a cost with gross margins below those seen in 2021 to 2024. During Q&A, KBH indicated that they had lowered base prices in “roughly half the communities” or around an average price of 3% of ASP.
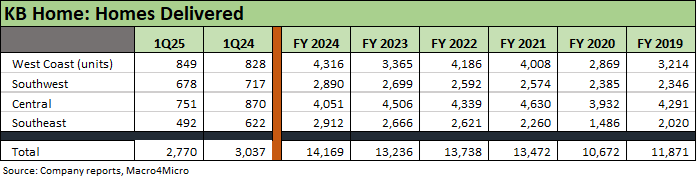
Deliveries were down by -8.8% in 1Q25 YoY. We see declines in deliveries in 3 of the 4 geographic regions with the Southeast market down materially after hitting highs in FY 2024. That comes after 3 of 4 regions in FY 2024 showed higher volumes.
The overall sales pace fell short of the mark, but the community count was in line with expectations. The blunt explanation on the call was that “demand was softer than expected” as the spring selling season got underway. The number that KBH put on the deliveries miss was 225 homes. That translates into just over 8% of the actual deliveries for 1Q25.
Some of the volume miss in 1Q25 can be tied to 150 fewer deliveries on delays linked to the wildfires. They cited such factors as “utility hookups” in the fire-related issues. Obviously, the Southern California market had a lot going on.
The decline in net orders for 1Q25 was worse in the mix of metrics with a -16.6% decline YoY on orders (units) and just under -15% by order value.

The above table shows higher total ASP in 1Q25 at $500.7K, up from $480.1K in 1Q24. KBH posted higher ASPs in 3 of 4 geographic segments with only the Southeast lower. As always, the West region was the priciest at $708.7K with Central the lowest at $367K.

The uptick in leverage and total debt and cash balance decline is tied to heavy investment in land as well as weaker-than-expected earnings and some buyback activity. We see net debt % cap rise to 27.1% from 21.2% at 4Q24, but leverage is still below the level of 2019 to 2022.
KBH highlighted that the company spent $920 million on land acquisition and development in 1Q25 and flagged that the Feb 2025 quarter would be the “high watermark in our land spend for this year.” KBH cited two large parcels in Las Vegas. While some of the moves are part of seasonal trends on the way into the peak spring selling season, the inventory line rose by $415 million from the Nov 2024 quarter to the Feb 2025 quarter.
The asset coverage metrics are strong in recent context and better than 2023 and prior years posted above with inventory coverage of total debt at 3.32x. “Cash + inventory” has declined slightly from 4Q24, is flat to 4Q23, and better than the prior years. The recent balance sheet move is not a major worry for credit quality but is likely to stall the timing of an upside move in the ratings from the high BB tier composite into a cusp IG name.
The cumulative impact of mortgage rates, consumer sentiment shifts, and wildfire disruption impacts in Southern California (primary, secondary, tertiary) will take some time for the industry to get past. The expected threats to material costs and supplies from tariffs (notably lumber, aluminum, steel, and potentially anything imported from offshore) are still a moving target (even by the day with this White House).
Housing:
Existing Homes Sales Feb 2025: Limping into Spring 3-20-25
Housing Starts Feb 2025: Solid Sequentially, Slightly Soft YoY 3-18-25
New Homes Sales Jan 2024: Homebuilders Feeling Cyclical Signals? 2-26-25
Existing Home Sales Jan 2025: Prices High, Volumes Soft, Inventory Up 2-21-25
Housing Starts Jan 2025: Getting Eerie Out There 2-19-25
New Home Sales Dec 2024: Decent Finish, Strange Year 1-28-25
Existing Home Sales Dec 2024: Another “Worst Since” Milestone 1-24-25
Housing Starts Dec 2024: Good Numbers, Multifamily Ricochet 1-17-25
Homebuilders:
Lennar: Cash Flow and Balance Sheet > Gross Margins 3-24-25
Toll Brothers 1Q25: Performing with a Net 2-20-25
Credit Crib Note: Lennar Corp (LEN) 1-30-25
D.R. Horton: #1 Homebuilder as a Sector Proxy 1-28-25
KB Home 4Q24: Strong Finish Despite Mortgage Rates 1-14-25
Toll Brothers: Rich Get Richer 12-12-24
PulteGroup 3Q24: Pushing through Rate Challenges 10-23-24
KB Home: Steady Growth, Slower Motion 9-26-24
Lennar: Bulletproof Credit Despite Margin Squeeze 9-23-24
Credit Crib Note: PulteGroup (PHM) 8-11-24
Credit Crib Note: D.R. Horton (DHI) 8-8-24
Homebuilders: Updating Equity Performance and Size Rankings 7-11-24
Credit Crib Note: KB Home 7-9-24
Lennar: Key Metrics Still Tell a Positive Macro Story 6-20-24
Credit Crib Note: NVR, Inc. 5-28-24
Toll Brothers: A Rising Tide Lifts Big Boats 5-23-24
Credit Crib Note: Taylor Morrison 5-20-24
PulteGroup: Strong Volumes, Stable Pricing 4-24-24
D.R. Horton: Ramping Up in 2024 Despite Mortgages 4-19-24
D.R. Horton: Credit Profile 4-4-23