
Lennar: Cash Flow and Balance Sheet > Gross Margins
Lennar 1Q25: Working capital management and cash flow priorities undermine margins but keep the free cash flow machine going.


As one of the aggressive innovators and risk takers over the years, Lennar always marched to its own beat, and the willingness to trade off margin for pace and even flow production is a deviation from the industry norm. That showed up in the weaker gross margin performance and rattled LEN equity.
With a bond maturity in May, the credit quality of Lennar is anchored by free cash flow and a balance sheet that boasts a cash balance slightly higher than total homebuilding debt. The hefty asset coverage is lower than it was before the Millrose Properties spin-off (MRP ticker NYSE) but is still very healthy.
The MRP spinoff deal shipped over $5.5 bn in land/inventory and $1 bn in cash to the new entity. Millrose will function essentially as a means of controlling even more finished lots on a derisked basis matched up against a level-production strategy. MRP will be a REIT beginning with its first taxable year ending December 31, 2025 (see Credit Crib Note: Lennar Corp (LEN) 1-30-25).
Lennar continues its sustained strategy of becoming an asset-light homebuilder with low exposure to land and related development costs. While a different strategy was used by NVR over the decades, the similarities to NVR in working capital and risk management and the historically industry-leading ROEs at NVR offers some other empirical support for the idea.
The reality is that street equity players and many institutional investors place a heavy weight on gross margin trends, but the impressive free cash flow strategy has its merits for equity in the form of another $703 million in buybacks in 1Q25. The credit quality of LEN remains anchored by the free cash flow and net debt levels that are still very impressive despite the distribution of assets to MRP.

The above chart plots the running cumulative returns on the two leading builders, D.R. Horton (DHI) and Lennar Corp (LEN). While they have different strategies, both track very closely across the COVID crisis and the sharp rebound in housing, the inflation spike, and then the tightening cycle. Both LEN and DHI materially outperformed the S&P 500 over that time horizon and notably through the fall of 2024 as the major builders pushed through 7% and even 8% mortgage rates.
The recent dive in homebuilder equities signal increased worries over the cumulative damage to consumer sector confidence despite the ability of the major builders to offer incentives such as mortgage buydowns and fee relief. The affordability problem is still very much a factor in the lower price tiers and for entry level and first-time buyers who get squeezed at the margin on mortgages. We have picked over these topics in the housing and single name work (see links at bottom).

The above table lines up homebuilder returns in descending order of the 1-year returns. The pain of the last 6 months shows no builders in positive return territory with the magnitude of the sell-off since Sept leaving no single name in positive territory for even 1-year. We also see no single names positive for 3 months.
We would highlight that among the Top 10 builders, Lennar stock has been the worst performer over the 1-year time horizon with only LGI Homes, Beazer and Hovnanian doing worse. That has not deterred LEN from its mission and strategy, and they just keep on buying back stock with free cash flow. Their longer-term game plan makes sense to us, and the MRP structure could be a highly efficient strategy as it gets underway into its “recycled capital” process. LEN just needs to convince more investors.
In a price x volume business, LEN has been doing very well in volume as we detail in the following tables but has seen prices move lower on a combination of mix (region, product tiers). The $408K average selling price is a long way from the $480K of FY 2022 and even the $446K of FY 2023. The strategy of pricing to the market has its effects on margins as we detail below. The costs of incentives have also been a factor.
LEN was somewhat dismissive of tariffs and deportation fallout on its earnings call, but we will see how that plays out as the year moves into the waves of tariff battles and deportation risks faced by subcontractors. They did mention working closely with their trade partners on planning, and that should signal some supplier battles to have the supplier eat more of the tariff fallout in costs.
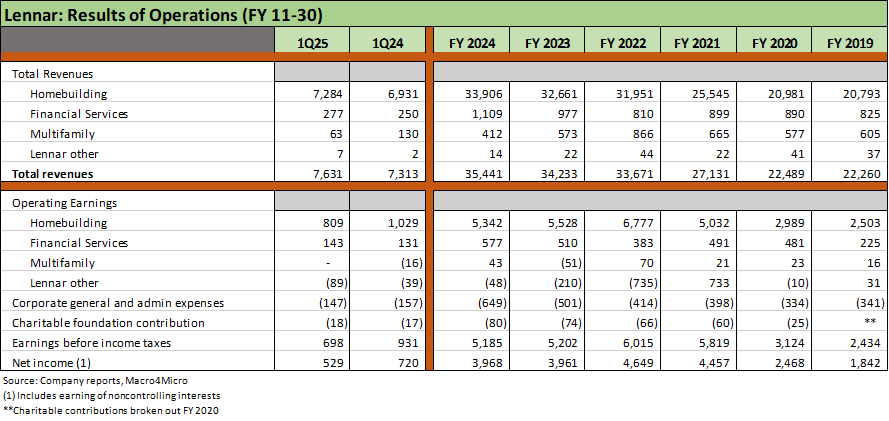
Margins have been compressing from the FY 2022 peak with Homebuilding operating margins down to 15.1% in FY 2024 vs. 21.2% in FY 2022 peak. Gross margins on home sales were flat at 22.3% in FY 2024 vs. 23.3% in FY 2023 and well below the 2022 peak of 27.5%. Gross margins compressed to 18.7% in 1Q25, down from 21.8% in 1Q24 after 22.1% in 4Q24. The pattern is clear in margin compression, and tariffs and supplier chain costs are likely to keep pressure on margins. That said, favorable trends in turning over inventory and working capital management are maintaining a healthy sales pace and strong cash flow.

The volume and geographic mix details are laid out in the above table. We kept the 2019-2024 segments consistent, but LEN has a habit of realigning the state mix. The “Texas” segment was rebadged as “South Central” in 1Q25 and joined by Arkansas, Kansas, Missouri, and Oklahoma. The legacy Central segment is now comprised of 10 other states. The Rausch Coleman Homes acquisition is part of an expansion seen in numerous low-price regions that is also serving to pull down the overall ASP.
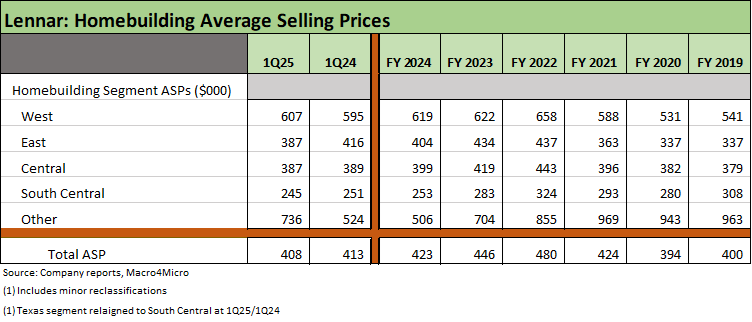
The above table updates the average selling price (ASP) by segment and in total. We highlight the differential between South Central at $245K and the West at $607K. Texas and what is now South Central have grown dramatically across this past cycle.

No matter how you slice it, Lennar has a very strong and highly liquid balance sheet. That said, it is no longer sitting on a cash balance net of debt in the $2 bn and $3 bn handle range. That was never going to last. Similarly, the 9.0x ratio of cash + inventory to total homebuilder debt seen in FY 2024 offered alternatives to Lennar in their strategic approach to accelerate the transition of their business model to asset-light and more streamlined working capital management.
Total homebuilding debt of $2.2 bn at 1Q25 is offset by $2.3 bn in cash for a net cash balance of around $72 mn after the Millrose Properties spin-off in 1Q25. Total homebuilder debt % capitalization of under 9% reinforces the healthy leverage story. Book value of equity at $22.7 bn is below the market value of over $30 bn.
The Millrose Properties transaction was in process across 2024, and there is no escaping the fact that asset protection is lower after such a distribution. Owned inventory of $10.15 bn is 4.6x total HB debt after the $6.5 bn in “land + cash” used to capitalize Millrose. That is still very strong coverage.
Housing:
Existing Homes Sales Feb 2025: Limping into Spring 3-20-25
Housing Starts Feb 2025: Solid Sequentially, Slightly Soft YoY 3-18-25
New Homes Sales Jan 2024: Homebuilders Feeling Cyclical Signals? 2-26-25
Existing Home Sales Jan 2025: Prices High, Volumes Soft, Inventory Up 2-21-25
Housing Starts Jan 2025: Getting Eerie Out There 2-19-25
New Home Sales Dec 2024: Decent Finish, Strange Year 1-28-25
Existing Home Sales Dec 2024: Another “Worst Since” Milestone 1-24-25
Housing Starts Dec 2024: Good Numbers, Multifamily Ricochet 1-17-25
Homebuilders:
Toll Brothers 1Q25: Performing with a Net 2-20-25
Credit Crib Note: Lennar Corp (LEN) 1-30-25
D.R. Horton: #1 Homebuilder as a Sector Proxy 1-28-25
KB Home 4Q24: Strong Finish Despite Mortgage Rates 1-14-25
Toll Brothers: Rich Get Richer 12-12-24
PulteGroup 3Q24: Pushing through Rate Challenges 10-23-24
KB Home: Steady Growth, Slower Motion 9-26-24
Lennar: Bulletproof Credit Despite Margin Squeeze 9-23-24
Credit Crib Note: PulteGroup (PHM) 8-11-24
Credit Crib Note: D.R. Horton (DHI) 8-8-24
Homebuilders: Updating Equity Performance and Size Rankings 7-11-24
Credit Crib Note: KB Home 7-9-24
Lennar: Key Metrics Still Tell a Positive Macro Story 6-20-24
Credit Crib Note: NVR, Inc. 5-28-24
Toll Brothers: A Rising Tide Lifts Big Boats 5-23-24
Credit Crib Note: Taylor Morrison 5-20-24
PulteGroup: Strong Volumes, Stable Pricing 4-24-24
D.R. Horton: Ramping Up in 2024 Despite Mortgages 4-19-24
D.R. Horton: Credit Profile 4-4-23