
Footnotes & Flashbacks: Asset Returns 3-30-25
Countdown to “Liberation Day” and more tariffs and retaliation risk undermined returns last week. More reality is dead ahead.

Countdown to “Liberation Day.” But what exactly are we liberating?
The week saw more dismal consumer indicators in consumer sentiment/confidence and materially higher inflation expectations from households. With JOLTs and payroll teed up for this week, we are still not at the point of tariff fallout but the search for signs will be headline material.
The trailing metrics in the PCE, Income, and Outlays release showed more trailing resilience than one would see for recession flags. Consumption rolls on, PCE inflation ran warmer with Core PCE ticking higher, and inflation remains well above target (see PCE Feb 2025: Inflation, Income, Outlays 3-28-25).
The final 4Q24 GDP numbers this past week reminded the market what a solid consumer sector looks like with +4.0% PCE growth. We saw higher annual 2024 GDP growth numbers than seen in 3 of 4 years in Trump 1.0, in turn heightening the risk for the recent material downward revisions in US GDP growth with full tariff impact not even here yet (see 4Q24 GDP: The Final Cut 3-27-25).

The above chart makes a statement. We used it in our “Lookback” posted yesterday (see Mini Market Lookback: The Next Trade Battle Fast Approaches 3-29-25) but thought it worth a second viewing. It plots YTD benchmarks for the US, Europe, and Canada. The reality of tariffs will only get “more real” with the YTD numbers showing the US in last place framed vs. 2 of the 3 largest trade partners targeted for high tariffs. “Liberation Day” and full retaliation actions have not even hit yet, and the tariffs are only rolling into place for autos this coming week.
Life will get very interesting from here with new tariffs, then retaliation, and then the “retaliation to the retaliation” that will just make matters worse. The gut check for political leaders across trade partners is whether to unconditionally surrender and have domestic political tides turn against you for cowardice or to fight back and send the message that such actions are not risk free and are not a frictionless wheel. Gutlessness is rewarded in US politics these days, but we suspect Canada, Mexico, and especially the EU will be very different.
Away from the pure tradition and precedent of retaliation against tariffs is the calculus of how to eliminate “permanent tariffs” at some point in US election cycles. After all, tariffs start in Congress, and Trump has abused the legislation’s intent (especially national security). The dilemma for the White House is the need to say “permanent” to encourage capex and reshoring vs. the risk of what saying “permanent” to trade partners might encourage (i.e. retaliation and political costs for Trump and the GOP). For trade partners, leaders (ex-Orban) are likely to conclude that it is better to fight now and retaliate. Many have signaled as much. Otherwise, they surrender to a sole decision maker carrying a razor thin majority in the House and Senate and a White House that took less than 50% of the popular votes.
To this point, the sloppy policy execution broadly is weighing on consumers. Trade partners can turbocharge the perception of bad White House policy execution by fighting back. The old school lesson is “make the bully pay a price.” In theory, you can’t have a fight without getting hit. Trump may not have learned that as a draft-dodging silver spoon rich boy. EU history says appeasement is a bad idea and Canada was right alongside them fighting. China simply does not back down (think Korean War), so this is a situation fraught with economic peril.

The above table updates the running returns on the high level debt and equity benchmarks we watch. For the trailing 1-month period, all the debt lines (even UST) and all the equity lines are negative with large caps, small caps, growth, and value all in the red.
In credit, we see HY and IG both weak on spread widening. The fact that the UST has not been a useful risk mitigator and return offset this past week and past month ties into the concerns around stagflation and tariff fallout on prices.
We have commented enough on the tariff issues (see links at the bottom), and the debate on price impact is no longer much of a debate for objective parties. There is no frictionless wheel or ability to deny transaction impacts. They will play out in the real economy and get reflected in the earnings of companies and in the high-level macro reactions and economic releases.
Denying elections as a strategy had the advantage of being “just words” and opinion manipulation. The tariff “price denial” is not an opinion over time. It will be about facts that get played out in the aisles, in the showrooms, and on digital retail platforms. It will show up in your bank account, credit cards, and lighter pockets. For many, it will show up in not having a job to go to. You can run, but you can’t hide.
The rolling return visual
In the next section, we get into the details of the 32 ETFs and benchmarks for a mix of the trailing periods. Below we offer a condensed 4-chart view for an easy visual on how the mix of positive vs. negative returns shape up. This is a useful exercise we do each week looking for signals across industry groups and asset classes.
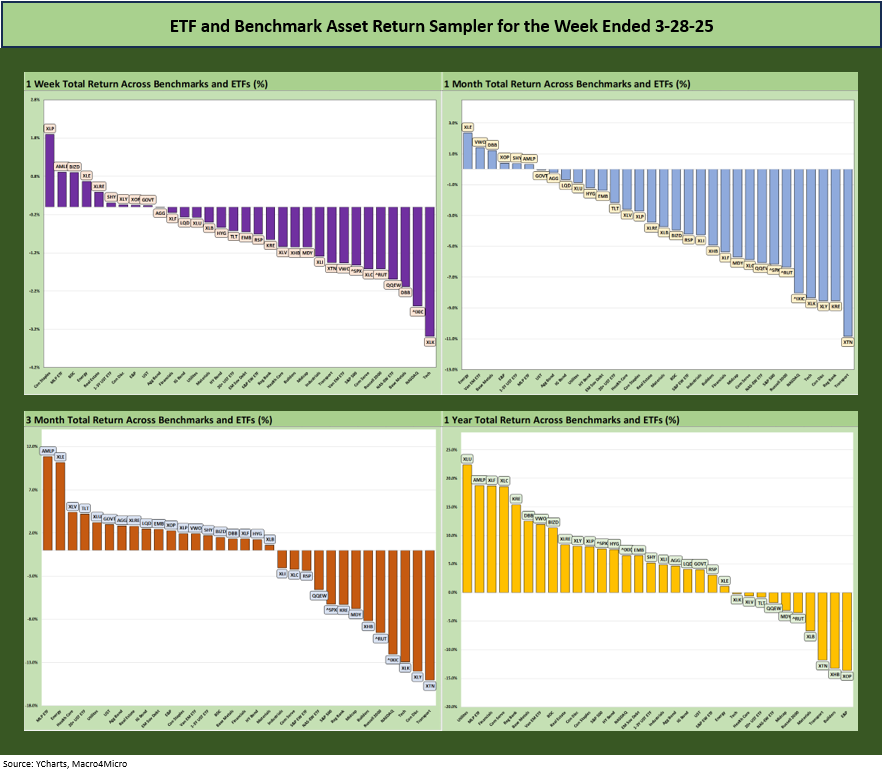
Relative to recent history, we are now starting to see a less favorable overall picture as an ugly 1Q25 starts to eat into the trailing 1-year period which not long ago was 32-0 and mostly posting numbers such as 31-1 and 30-2. That is now whittled down to 22-10 with the entire bottom quartile now in the red.
The Magnificent 7 heavy ETFs…
Some of the benchmarks and industry ETFs we include have issuer concentration elements that leave them wagged by a few names. When looking across some of the bellwether industry and subsector ETFs in the rankings, it is good to keep in mind which narrow ETFs (vs. broad market benchmarks) get wagged more by the “Magnificent 7” including Consumer Discretionary (XLY) with Amazon and Tesla, Tech (XLK) with Microsoft, Apple, and NVIDIA, and Communications Services (XLC) with Alphabet and Meta.

We already looked at the tech bellwether table in Mini Market Lookback: The Next Trade Battle Fast Approaches (3-29-25). We see 6 of the Mag 7 in the red with only Tesla posting a big rebound week off its recent beatdown that still shows 1-month at -10% and 3-months at -39%.
The story above is hard to sugarcoat with one positive line for 1-week, all negative for 1-month, all-negative for 3 months and only 3 positive for 6 months.
Looking back 1-year, we see only 2 in negative range and zero in negative range over 2 years, and only 1 in negative range (Tesla) over 3 years.

We looked at the 1-week set of numbers already in Mini Market Lookback: The Next Trade Battle Fast Approaches (3-29-25). The 9-23 score might even be better than was expected after all the tariff and consumer sentiment/confidence news. Coming off the final 4Q24 GDP numbers with its +4.0% PCE growth (68% of GDP), the trailing story is heading into a danger zone once the price pain starts flowing in.
The auto trade literature is ballparking $5K increases or a 10% area increase in the average prices for cars, and that is only if OEMs and the supplier and dealer chain eat some of the costs. Those numbers will move around a bit as supply and demand dynamics play out (e.g. lower imports from everywhere). Replacement cycles are also influenced by the macro backdrop and the willingness of OEMs to support incentives (which are a marketing cost). Financing costs remain high also.
The PCE release for Feb 2025 actually had more than a few constructive lines in the outlays mix that show the consumer still very much breathing. The recent consumer sentiment smackdown is a real fear and showing up in guidance revisions. That +4.0% PCE line is more likely to be a memory than a current reality as the trade chaos unfolds.

The 1-month timeline weighed in at 6-26 in an abysmal performance across the asset mix. Energy-related sectors comprised 3 of the 6 with the broad Energy ETF (XLE) at #1, E&P (XOP) at #4, and the income-heavy Midstream ETF (AMLP) at #6. EM Equities (VWO) and Base Metals (DBB) were in the top 3 with short UST 1-3Y ETF (SHY) rounding out the positive returns.
Sitting on the bottom is the Transport ETF (XTN) as cyclical and tariff pressures on freight and logistics get weighed and material weakness in airlines came after a wave of earnings warnings for 1Q25 earnings. Regional Banks (KRE) have been beaten up after a post-election rally while we see the tech weakness in the lowest tier with the Tech ETF (XLK) and NASDAQ in the bottom 5.
Consumer Discretionary (XLY) is feeling the bad consumer headlines while also facing high exposure to Tesla and Amazon. The S&P 500 and Russell 2000 are both in the bottom quartile, and that makes a negative statement on valuation as well as the breadth of weakness.

The 19-13 score for 3 months includes all 7 bond ETFs in positive range including 3 in the top quartile with the long duration UST (TLT) at #4 and UST ETF (GOVT) at #6 with the Aggregate bond index (AGG) at #7. The bull flattener YTD has helped high quality fixed income broadly against an ugly backdrop.
Excluding the 7 bond ETFs, we see a 12-13 score with the 4 broad benchmarks (NASDAQ, S&P 500, Russell 2000, Midcaps) all negative. We see 3 of the 4 broad benchmarks in the bottom quartile with the S&P 500 just across the line in the bottom of the third quartile.
The top quartile shows Income-heavy Midstream at #1 with +10.8% just ahead of the broad Energy ETF at #2 and a 10% handle return. Lower risk sectors such as Health Care (XLV) and Utilities (XLU) are in the top quartile with Real Estate (XLRE) riding the lower rates as an income stock sector.
Sitting on the bottom is Transport (XTN) yet again with Consumer Discretionary (XLY) and the Tech ETF (XLK) with the NASDAQ slightly ahead of tech. The Russell 2000 rounds out the bottom 5 with a negative statement on that US-centric benchmark.

As discussed earlier, the shape of the trailing 1-year score keeps shifting in an adverse direction as a very bad 1Q25 period pushes out the 1Q24 returns following 2 years of stellar stock returns. E&P (XOP), Homebuilders (XHB), the Transport ETF (XTN), the cyclical Materials index (XLB), and small cap Russell 2000 comprise the bottom 5 with Midcaps just ahead of the small caps. The long duration UST ETF (TLT) still sits in the bottom quartile but higher up in the bottom tier.
See also:
Mini Market Lookback: The Next Trade Battle Fast Approaches 3-29-25
PCE Feb 2025: Inflation, Income, Outlays 3-28-25
Auto Tariffs: Questions to Ponder 3-28-25
4Q24 GDP: The Final Cut 3-27-25
Durable Goods February 2025: Preventive Medicine? 3-26-25
New Homes Sales Feb 2025: Consumer Mood Meets Policy Roulette 3-25-25
KB Home 1Q25: The Consumer Theme Piles On 3-25-25
Lennar: Cash Flow and Balance Sheet > Gross Margins 3-24-25
Footnotes & Flashbacks: Credit Markets 3-24-25
Footnotes & Flashbacks: State of Yields 3-23-25
Footnotes & Flashbacks: Asset Returns 3-23-25
Mini Market Lookback: Fed Gut Check, Tariff Reflux 3-22-25
Existing Homes Sales Feb 2025: Limping into Spring 3-20-25
Fed Action: Very Little Good News for Macro 3-19-25
Industrial Production Feb 2025: Capacity Utilization 3-18-25
Housing Starts Feb 2025: Solid Sequentially, Slightly Soft YoY 3-18-25
Retail Sales Feb 2025: Before the Storm 3-17-25
Mini Market Lookback: Self-Inflicted Vol 3-15-25
Credit Spreads: Pain Arrives, Risk Repricing 3-13-25
CPI Feb 2025: Relief Pitcher 3-12-25
JOLTS Jan 2025: Old News, New Risks in the Market 3-11-25
Credit Spreads Join the Party 3-10-25
Mini Market Lookback: Tariffs Dominate, Geopolitics Agitate 3-8-25
Payrolls Feb 2025: Into the Weeds 3-7-25
Employment Feb 2025: Circling Pattern, Lower Altitude 3-7-25
Gut Checking Trump GDP Record 3-5-25
Trump's “Greatest Economy in History”: Not Even Close 3-5-25
Asset Returns and UST Update: Pain Matters 3-5-25
Mini Market Lookback: Collision Courses ‘R’ Us 3-2-25
Tariff and Trade links:
Auto Tariffs: Questions to Ponder 3-28-25
Fed Gut Check, Tariff Reflux 3-22-25
Tariffs: Strange Week, Tactics Not the Point 3-15-25
Trade: Betty Ford Tariff Wing Open for Business 3-13-25
CPI Feb 2025: Relief Pitcher 3-12-25
Auto Suppliers: Trade Groups have a View, Does Washington Even Ask? 3-11-25
Tariffs: Enemies List 3-6-25
Happy War on Allies Day 3-4-25
Auto Tariffs: Japan, South Korea, and Germany Exposure 2-25-25
Mini Market Lookback: Tariffs + Geopolitics + Human Nature = Risk 2-22-25
Reciprocal Tariffs: Weird Science 2-14-25
US-EU Trade: The Final Import/Export Mix 2024 2-11-25
Aluminum and Steel Tariffs: The Target is Canada 2-10-25
US-Mexico Trade: Import/Export Mix for 2024 2-10-25
Trade Exposure: US-Canada Import/Export Mix 2024 2-7-25
US Trade with the World: Import and Export Mix 2-6-25
The Trade Picture: Facts to Respect, Topics to Ponder 2-6-25
Tariffs: Questions to Ponder, Part 1 2-2-25
US-Canada: Tariffs Now More than a Negotiating Tactic 1-9-25
Trade: Oct 2024 Flows, Tariff Countdown 12-5-24
Mexico: Tariffs as the Economic Alamo 11-26-24
Tariff: Target Updates – Canada 11-26-24
Tariffs: The EU Meets the New World…Again…Maybe 10-29-24
Trump, Trade, and Tariffs: Northern Exposure, Canada Risk 10-25-24
Trump at Economic Club of Chicago: Thoughts on Autos 10-17-24
Facts Matter: China Syndrome on Trade 9-10-24
Tariffs: Questions that Won’t Get Asked by Debate Moderators 9-10-24
The Debate: The China Deficits and Who Pays the Tariff? 6-29-24
Trade Flows: More Clarity Needed to Handicap Major Trade Risks 6-12-24
Trade Flows: Deficits, Tariffs, and China Risk 10-11-23