
The Trade Picture: Facts to Respect, Topics to Ponder
We run through the US-World trade stats for 2024 and flag a few material concepts to go with some facts that get ignored.


The multiplier effects matter across the economy and are ignored by Trump.
We look at the final trade and import-export numbers for 2024 and give some context to the import and export balances and deficits with major trade partners.
As a sample exercise on how conceptually vapid it is to focus on the goods deficit alone, we look at a typical example of a simple import and its multiplier effects.
Record trade deficits have come as the largest economy in the world keeps growing and hits highs when demand is strong just as it has in past cycles.
There are always trade-offs between trade deficits and other GDP lines (notably consumption and investment) as well as with financial assets (i.e. stock markets, currencies) when bad policy seeks to curb imports for the wrong reason.

The above chart plots the running import and export line for trade between the US and “the world.” The good news for those who like global prosperity and US prosperity is that both lines show steady growth in total activity. Perhaps the single biggest miss by Trump and some of his allies is that the total economic activity does not stand still at the border.
Once that import item from the “Goods” checklist appears (that some US buyer has ordered but that Trump considers a rip-off) a lot more economic impacts unfold. What happens next cuts across freight, storage, assembly plants, finance, insurance, retail revenues, real estate and construction projects, materials for national defense, power generation, etc. Many jobs are associated with those events and contact points along the journey to the end market customer.
The fact that Trump never discusses those other economic impacts or multiplier effects (as his sycophantic policy gurus bobble-nod to whatever he says) is a sign of fundamental ignorance or dishonesty. In an optimistic mood, one can assume ignorance, but it is likely a combination of the two.
The theoretical journey of an automotive engine “rip-off”
Picture a technology-intensive value-added German or Japanese engine delivered to the US for use in an auto assembly plant. That item at the border adds to the trade deficit. Someone makes money (or has a job) to get that engine from the ship to the rail. Some port just made some money. Some tax base in that same state and in that local entity somewhere just went higher. The logistics companies make some revenue. Social security ticked up as did Medicare on someone’s paycheck. Some bank just made some money on financing that inventory for the buyer or in letters of credit. So far, those parties are not feeling “ripped off.” The buyer ordered it. The buyer is on the path to receiving it.
The freight and logistics players and “smart” warehouse operators are happy. They made some money. So are the builders who built that facility (look at warehouse employment level trends in recent years) to deal with higher volumes in the chart above (imports and exports). Those folks who were hired can buy a second car since that family is working two jobs. Then the insurance company “rips them off” on auto insurance. So that insurance agent is happy (too happy!) and makes some money. Then he buys a new German or Japanese car, so even more engines come in.
After the drop-off at the port where the “rip off” gets recorded…
The railroad operator makes some money moving the engine to its destination to the auto transplant manufacturing facility in a right-to-work state. Then some employed people and related logistics service providers at the other end of the line ring the cash register and use their newly enlarged payroll to handle the growing volume. They also have their hands full handling all of the “intra-border” business directed to the assembly plants and some of the suppliers who have put some operations in the area of the assembly plant.
But wait a minute…
The assembly plant was built there in the first place with a view that the Japanese or German or South Korean auto/truck maker could expand and leverage its global supplier chain – whether from the home country or from the US and/or Mexico. Since they built the plant, the multiplier effects across civil infrastructure, residential community counts, apartment rentals, brokers, etc., had a role. The area’s supporting services from food and retail to utilities and health care etc. see more demand, more volume, and maybe more hiring. Lather, rinse, repeat.
Health insurance providers are having a field day as are auto insurers at that end of the rail line as well. The local auto dealer is making money. So are residential real estate services with more people buying homes, renting, and expanding the local tax base. So, the state and local government payrolls rise and more people have jobs.
The single family houses have to get built as do the multifamily homes. That all adds up to a supplier chain and homebuilder and subcontractor field day. That residential need flows into more materials, appliances, financing revenues (mortgages, dealer finance, credit cards, small business loans, etc.). The local banks or regional banks get new customers.
More durables are needed for construction and the activity (pickup trucks and construction equipment). More immigrants get hired for many jobs (and they will soon be deported). The local United Rentals branch needs to open up a new one and is raising capex for 2025. Subcontractors in homebuilding need to hire more people and order more equipment and supplies. Again, the tax base and voter count are rising. Maybe that state gets another seat in Congress with the next census.
You get the idea. The multiplier effect and that rip-off at the border played over time and time again will leave the US well ahead. As we detailed in our recent comment on tariffs (see Tariffs: Questions to Ponder, Part 1 2-2-25), that small haircut on GDP from trade deficits flows into the Personal Consumption Expenditures line, the Gross Private Domestic Investment line, and the Government Consumption and Investment line (dominated by state and local). It also flows into one of Trump’s favorite lines, which is the stock market.
If Trump can whittle down the 3% haircut on GDP tied to a trade gap to 2%, he might want to crank up the Village People and do his special White Man Waltz. However, the cost of getting there will be greater across the 103% of PCE (68%), GPDI (18%), and Government (17%). That is without even considering what happens to the stock market and lasting damage to major employers and industry groups.
The companies decide how to optimize the supplier chains – not the selling country. That multiplier effect runs across all aspects of the economy. The dynamics are simple enough (and I left out a lot). One problem with Trump is that he makes decisions in advance without consideration of the facts. He does not apply a range of concepts and he ignores secondary and tertiary effects. He asks “How can I foster enmity, maximize discord and repeat myself over and over without fielding tough questions.” All the while, the bobble heads nod and nod.

The above chart plots the running goods trade deficit across the years. We have addressed those in earlier commentaries, so we won’t replay the history (see links at bottom). Away from the global trade revolution that kicked into gear with the WTO and rise of China (very much driven by major US buyers and direct investment from US companies), we see a few stock market booms that ran alongside record budget deficits after 2000. Clinton had balanced the budget by working with a bipartisan Congress. That soaring budget deficit after 2000 was a function of wars, spending, and tax cuts.
The timeline above shows 2 record highs in the trade deficit during Trump 1.0 and 3 record highs under Biden. We also saw 5 record highs under Bush and 6 record highs under Clinton, which was the most successful high growth market along the timeline. There were no record highs in trade deficits under Obama since the world and the US struggled after the systemic crisis. Obama’s economic metrics were the worst of the pack and thus no record trade deficits (see Top 10 Fun Facts on Past Presidents and their Economies 1-20-25).
Clinton’s economic performance crushed Trump (and everyone else) with 8 years of solid growth across the two terms with no annual contractions (see Presidential GDP Dance Off: Clinton vs. Trump 7-27-24). Trump promised 4% GDP growth but only had a single 3.0% annual GDP growth rate (that 3.0% was rounded up). Kevin Hassett is still trying to sell Trump 1.0 as a 3% growth experience again this past week. It was a 2% experience (see The Politics of Objective GDP Numbers: “Flex Facts” on Growth 10-30-24).
Based on Clinton and Biden (the only ones since the 60s to end their terms with no recession at any point), maybe we could use more record trade deficits. High consumption by the largest economy in the world reflects strength.
If Trump wants a good housing market and higher growth, he should have zero tariffs on Canadian lumber and tax credits for builders who make affordable homes and help train candidates in homebuilding to solve the skilled labor shortage. They will also need lumber to rebuild LA. That labor need is especially the case with Trump’s deportation program likely to gut the subcontractor ranks.

The above chart updates the top 15 trade partners for the full year 2024. We line them up in descending order of total trade (imports + exports). So far, Trump has picked a fight with 41% of US total trade. If he picks a fight with the EU whether by tariffs or violating Denmark’s sovereignty (Greenland), then the trade war in theory would be with partners comprising over 59% of trade (EU = 18.3% of trade). Seems like a bad idea.
We would expect the reaction from the EU (if needed) will be proportionate (it’s a European bureaucracy thing). The retaliation could also be creatively harsh (attacking services and tech has been discussed).
One theory is that an EU battle gives Trump another excuse to throw Ukraine under the Russian tank and withdraw the US from Nato. Then he gets in bed full time with Putin. When Trump threatens Putin with tariffs, the trade release underscores why that borders on funny since US imports from Russia for FY 2024 only added up to $3bn. Putin keeps that much in his bedside drawer.
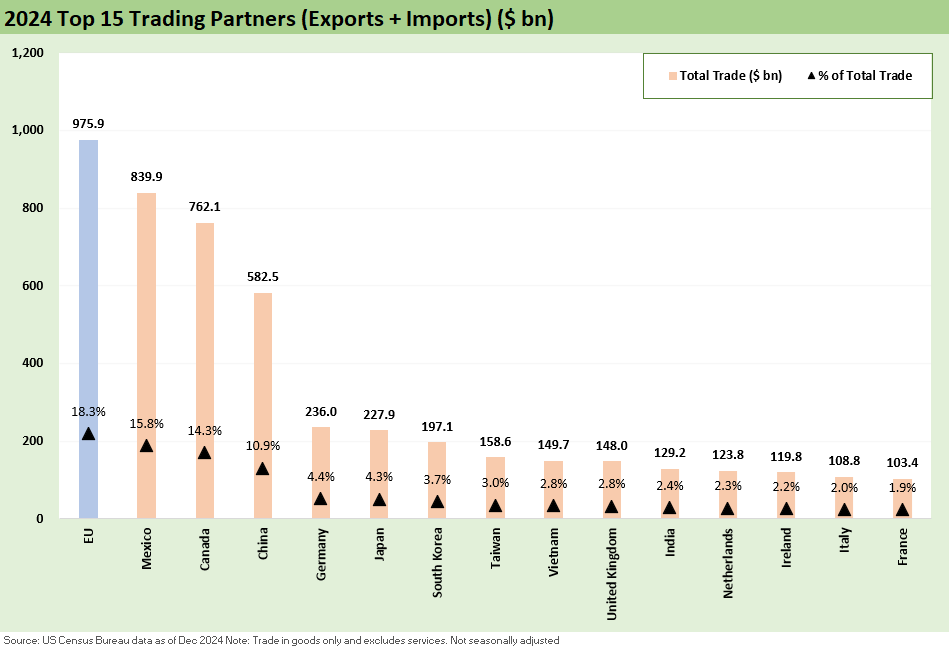
The above chart details the top 15 trade partners. That is a lot of billions. The risk of Trump violating trade deals with Japan and South Korea is always a risk also. After all, he has already violated his own USMCA deal.

The above chart shows where the total trade deltas are in the mix of top trade partners. The mix of import vs. export deltas to drive those changes has to be factored in, but Mexico is right on top and the EU second. Taiwan is a major swing. A large base of those imports from Mexico are owned by US companies. That is not Claudia Sheinbaum or AMLO making the decision.

The above chart details the leading import totals by trade partner. The EU could be up next in the trade battle. Vietnam is one that jumps out in recent years. Now that Trump has recovered from bone spurs, he might focus on Vietnam as well (from a safe distance). Vietnam has been accused of Chinese transshipments. That may be a false accusation, but that will not stop the protectionists from saying it.

The export list shows Canada at #1, and the export mix is high quality and high value-added (see Trump, Trade, and Tariffs: Northern Exposure, Canada Risk 10-25-24). Canada is also a low-cost source of aluminum. The US tariffs back in Trump 1.0 were in part tied to the interests and political clout of one high-cost aluminum operator in Kentucky. Low-cost aluminum requires low-cost electric power. Canada is a huge provider of natural resources and energy. They buy a massive array of products from the US.
Tariff links:
Tariffs: Questions to Ponder, Part 1 2-2-25
US-Canada: Tariffs Now More than a Negotiating Tactic 1-9-25
Trade: Oct 2024 Flows, Tariff Countdown 12-5-24
Mexico: Tariffs as the Economic Alamo 11-26-24
Tariff: Target Updates – Canada 11-26-24
Tariffs: The EU Meets the New World…Again…Maybe 10-29-24
Trump, Trade, and Tariffs: Northern Exposure, Canada Risk 10-25-24
Trump at Economic Club of Chicago: Thoughts on Autos 10-17-24
Facts Matter: China Syndrome on Trade 9-10-24
Trade Flows: More Clarity Needed to Handicap Major Trade Risks 6-12-24
Trade Flows 2023: Trade Partners, Imports/Exports, and Deficits in a Troubled World 2-10-24
Trade Flows: Deficits, Tariffs, and China Risk 10-11-23