
Footnotes & Flashbacks: State of Yields 4-6-25
A flight to quality and recession anxiety started new debates on tariff price impact and timing.


The economics gods are pissed.
The UST curve just saw rates rally for all the wrong reasons, but the overwhelming consensus of those who are allowed to speak (without shilling) in policy positions know prices will be higher, costs will be higher, supplier chains will be disrupted, and mitigating cost actions will push payrolls lower as the transaction level impacts flow into the company-level financials (see Reciprocal Tariffs: Weird Science Blows up the Lab 4-2-25, Reciprocal Tariff Math: Hocus Pocus 4-3-25).
The UST curve is back to more inverted from 3M to 10Y and the UST moves now face the added uncertainty of balancing recession handicapping with inevitable tariff-driven price increases. This is the first real stagflation vs. growth juggling act for the markets since Volcker (UST Moves 1978-1982: The Inflation and Stagflation Years 10-18-23).
The sell-off this past week was immediate, brutal, and justified given the incoherence and simplistic, low-rigor nature of the reciprocal tariff analysis, which was virtually nonexistent (see Mini Market Lookback: A Week for the History Books 4-5-25, Footnotes & Flashbacks: Asset Returns 4-6-25).
The shoddy work and inconsistent themes on “negotiations” vs. “permanent” not only looks bad but also sow doubt that potential offshoring/reshoring projects are too risky to pursue with unstable and untrustworthy policy setters. US global trade has now devolved into the flavor of a slippery NY real estate deal. It is hard to relocate OEMs and supply chains with multi-year projects against such a backdrop.
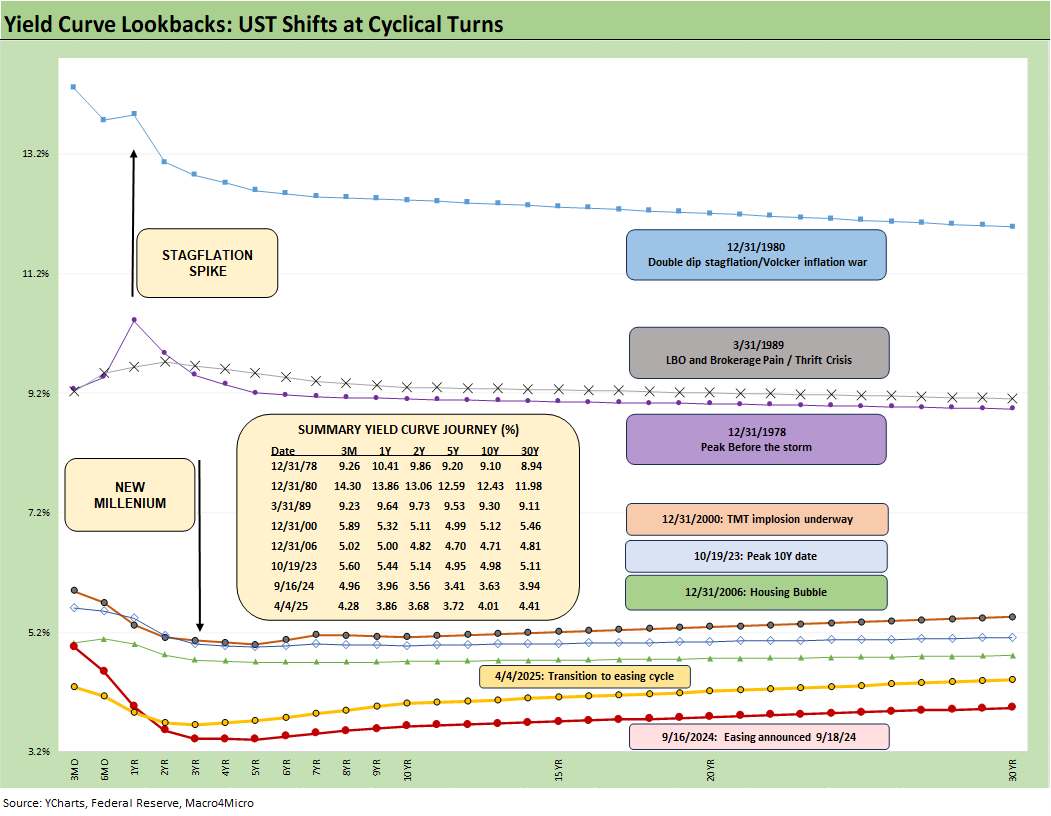
The above chart plots some key cyclical transition periods from the Carter inversion of 1978 across the Volcker years, the credit cycle peak in 1989, the TMT cycle in 2000, and the housing bubble in 2006. We then jump beyond the crisis period and the ZIRP years with the QE and normalization distortions to the Oct 2023 UST peak date on the 10Y UST.
The most important takeaway is how extraordinarily low UST rates are at this point in time. They just dipped again this week on the tariff reactions while remaining above the recent Sept 2024 lows.
As we see in the UST delta charts further below, the UST is back to more inverted from 3M to 5Y and 3M to 10Y as the FOMC handicapping begins anew. The swing in handicapping to 5 or 6 cuts in 2025 may be just panic reactions, but the price stability and full employment mandate comes first for the Fed and not the whims and wishes of Trump. It will be 5 or 6 cuts if the tariffs have the expected impacts on economic growth and payroll and if inflation remains muted. That is the best outcome under this reckless tariff regime.
History is not very supportive of the risk reward symmetry that could unfold if we faced another bout of stagflation not seen since 1980-1981. That was a drastically different backdrop of fundamental cyclical weakness and wholesale restructuring of American industry, but the inflation war came first in priority – not easing to keep Presidents happy.
This market stands out with its own set of dynamics including spiraling sovereign systemic debt leverage and funding needs much worse than anything from the past and facing a tariff strategy that dwarfs anything since Smoot-Hawley (and that one did not end so well).
What Trump launched this week went way beyond expectations and was essentially a sure thing for higher prices, slower growth and higher unemployment. The next FOMC dot plot should be a treat (see Fed Action: Very Little Good News for Macro 3-19-25).
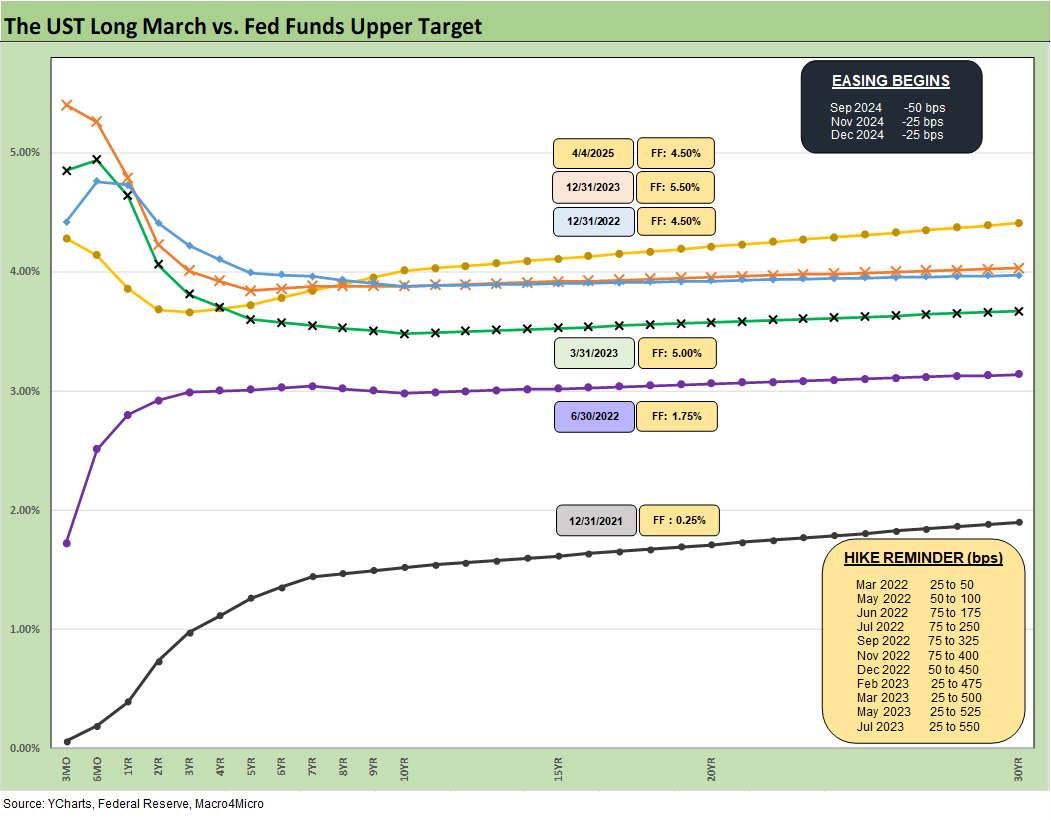
The above chart replays the weekly chart detailing the migration of the UST curve from 12-31-21 with memory boxes showing the tightening dates/magnitude and more recently the easing. The UST curve still shows bear steepening pattern from the Sept 2024 lows, but fear is creeping into the shapeshifting now and taking the UST deltas to lower rates.
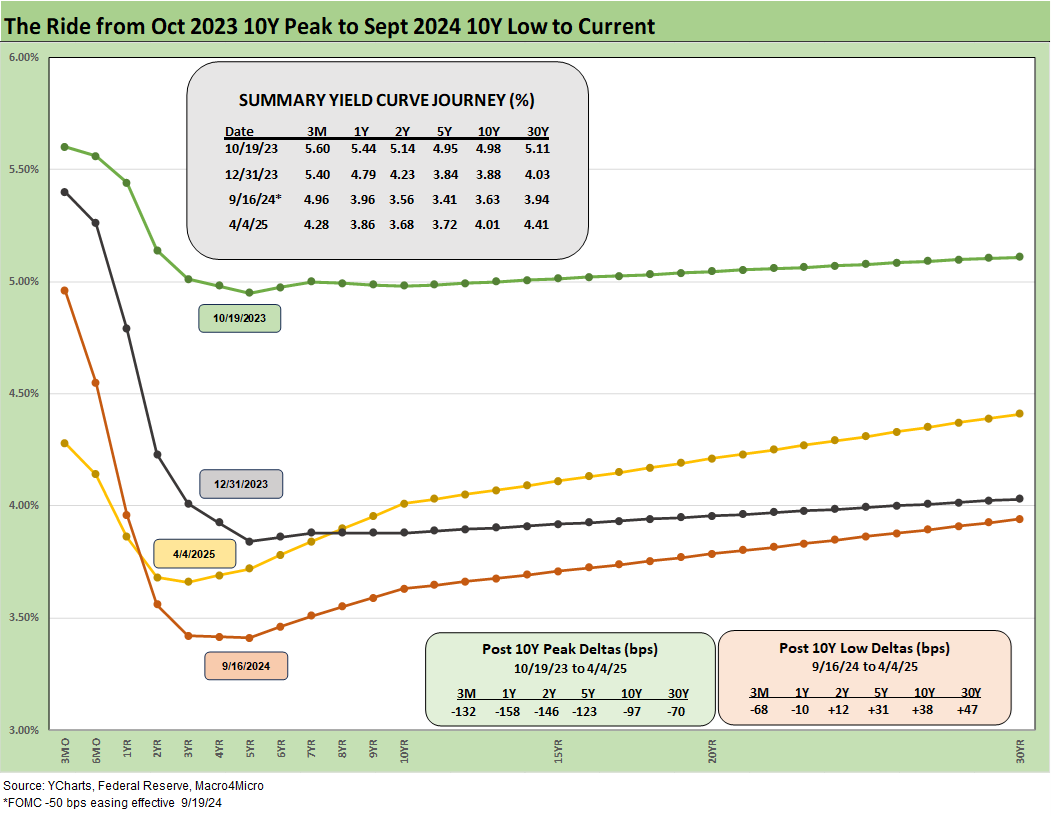
The above chart captures the sharp moves from the peak UST curve of 10-19-23 down into the major rally of Nov-Dec 2023 and then eventually into the lows of Sept 2024. The Sept 2024 lows only came after a bear steepener hit the curve through the summer of 2024. We then moved back into bear steepener mode until the tariffs hit the fan this week that sent 2Y to 30Y lower.
Forecasting the UST curve has not been easy with the start of 2024 calling for repeated cuts (many predictions of 5-6 cuts) and a downward shift. We got 4 of those cuts later in 2024 but the protracted flattening called for by the end of 2024 was not in place by then. YTD 2025 had seen modest bull flattening (after some initial weakness) from where 2025 started as we cover below in the UST delta charts. The bull flattening is now back to a steeper inversion from 3M to 5Y and 3M to 10Y as detailed below.
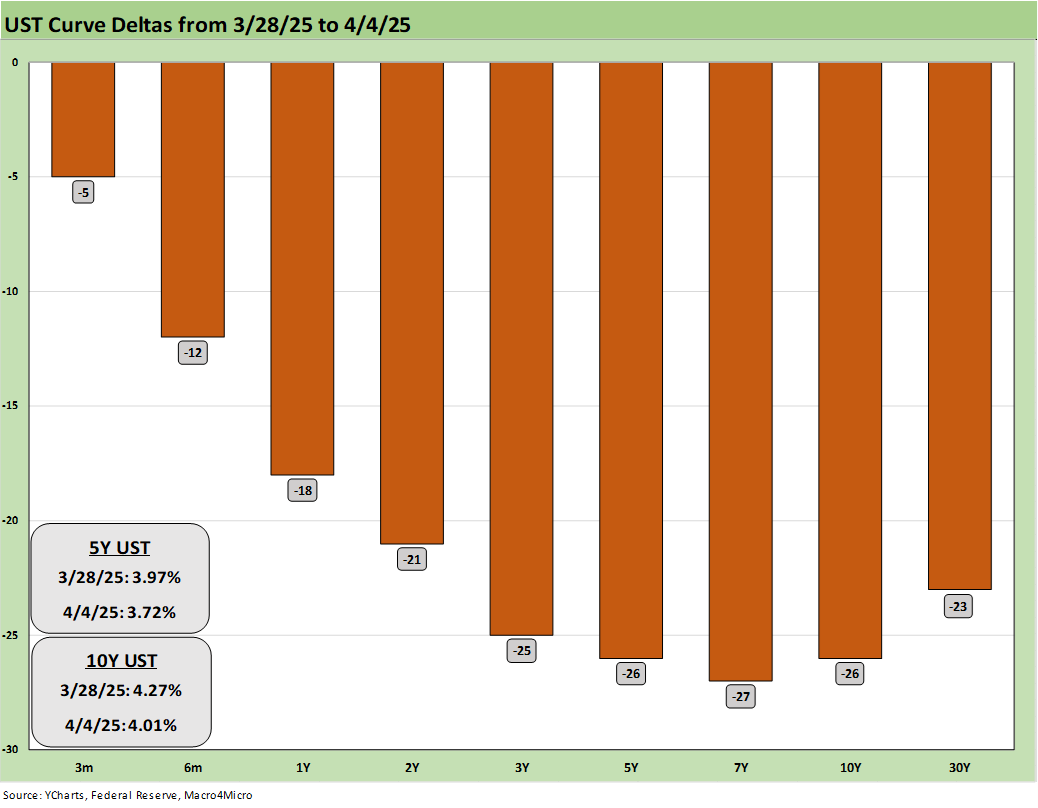
The UST rally this week saw the UST move shift lower with 3Y to 10Y fairly uniform in a range of -25 bps to -27 bps, but the 2Y only at -21 bps. Pressure from the White House on Powell could get ugly since Trump will need a new distraction to turn eyes away from his intergalactic tariff screwup.
We expect Powell and the FOMC to stay the course with their mandate on price stability and employment. There will be lag time in orders, deliveries, tariff collections and cost and pricing actions that will flow into the summer. By then, price flow-through across the CPI and PCE lines will be getting scrutinized to death. We get a fresh CPI number this week on Thursday. Maybe there will be some hints of early price hikes that went through in anticipation of tariffs. Companies often raise prices before the orders are booked when tariff clocks are ticking. That is more likely later in the April and May timeframe.
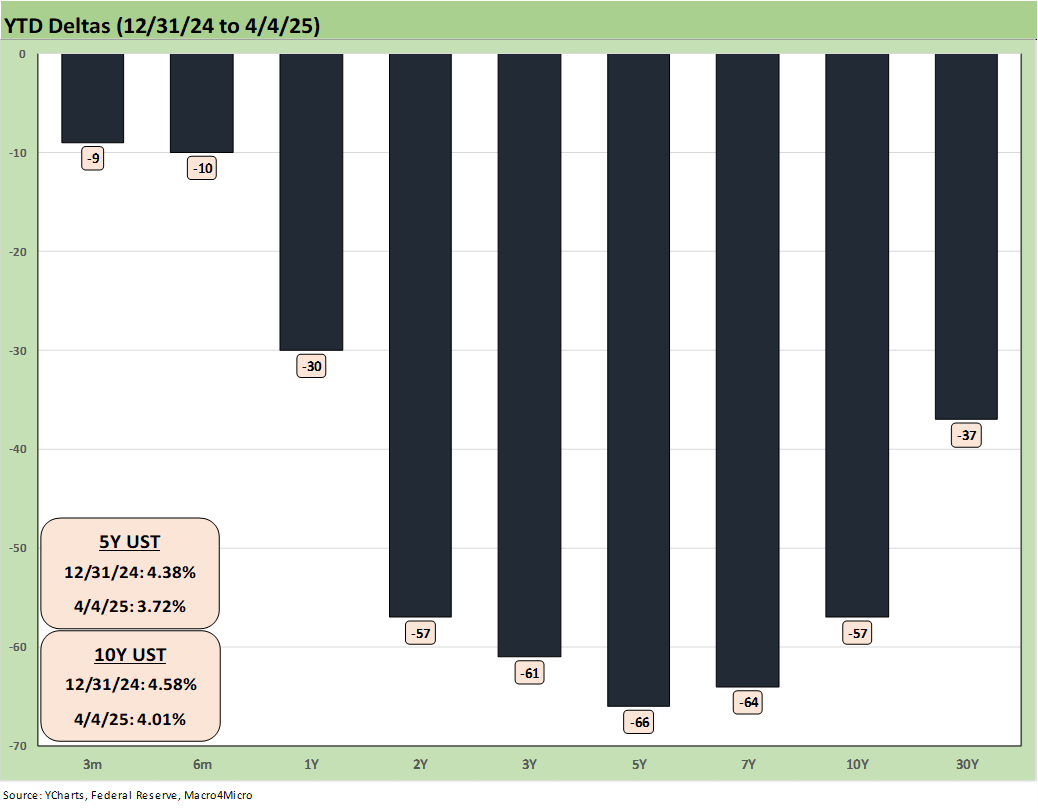
The above UST YTD deltas underscore the big swing lower 1Y to 30Y with the biggest move in 2Y to 10Y. The market is knocking on the door to a return back to 3% handles on 10Y UST, but history is unkind to stagflation monetary policy that moves to ease too early and does not fight the inflation threats.
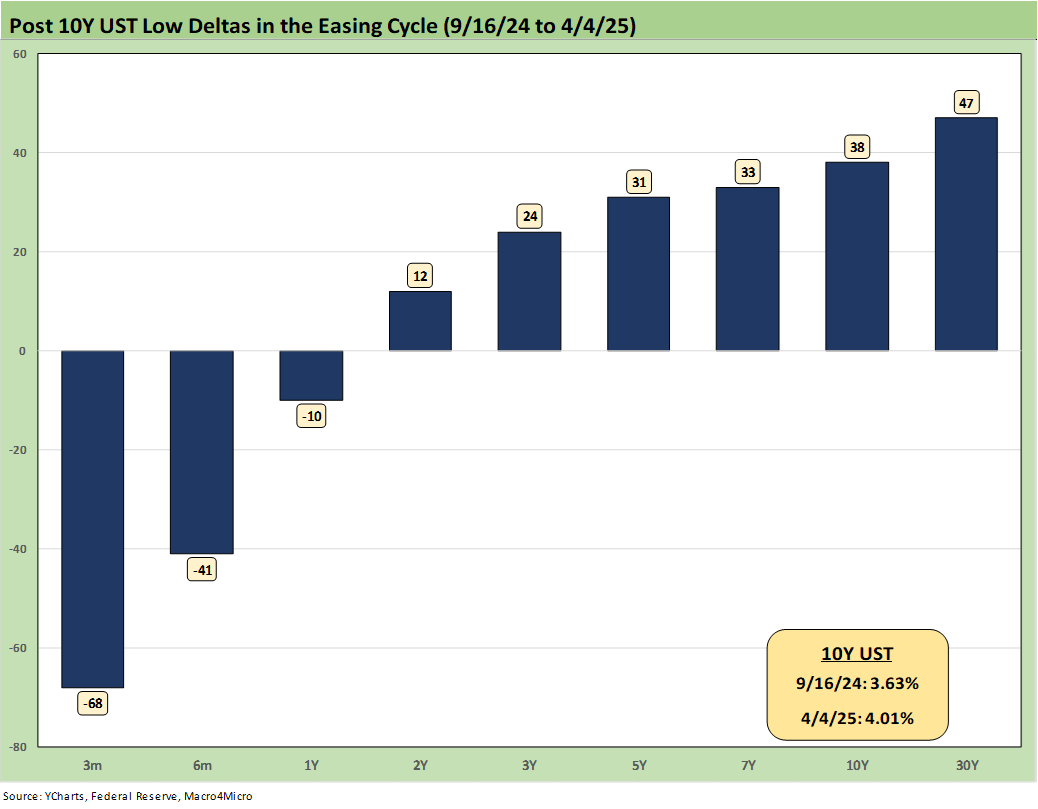
The above UST deltas update the moves from the Sept 2024 lows. We still have a ways to go out past 2Y to get closer to flat.
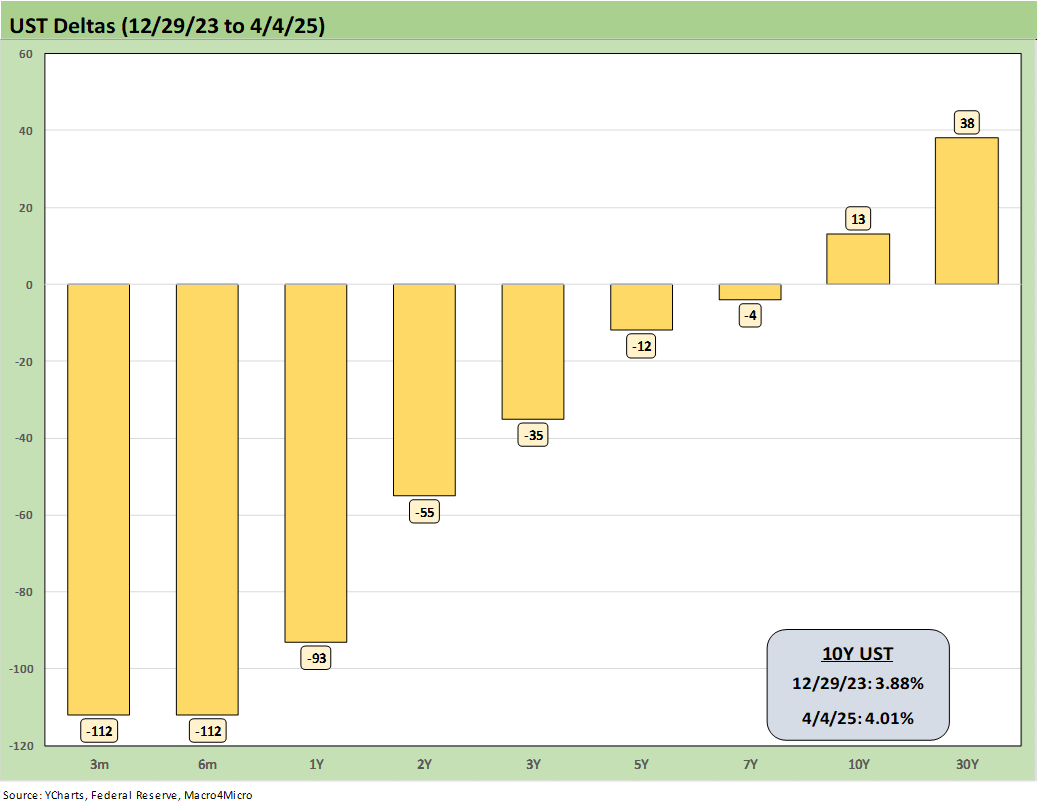
The UST deltas since the end of 2023 shows a mixed bull steepener with the 10Y and 30Y UST still higher but the easing actions and recent rallies are very much in evidence on the front end and middle. The massive Nov-Dec 2023 rally set the market up for a good 2024 in risk. This rally has a very different underlying collection of self-inflicted negative drivers - rallying for bad reasons with stocks tanking and spreads spiking.
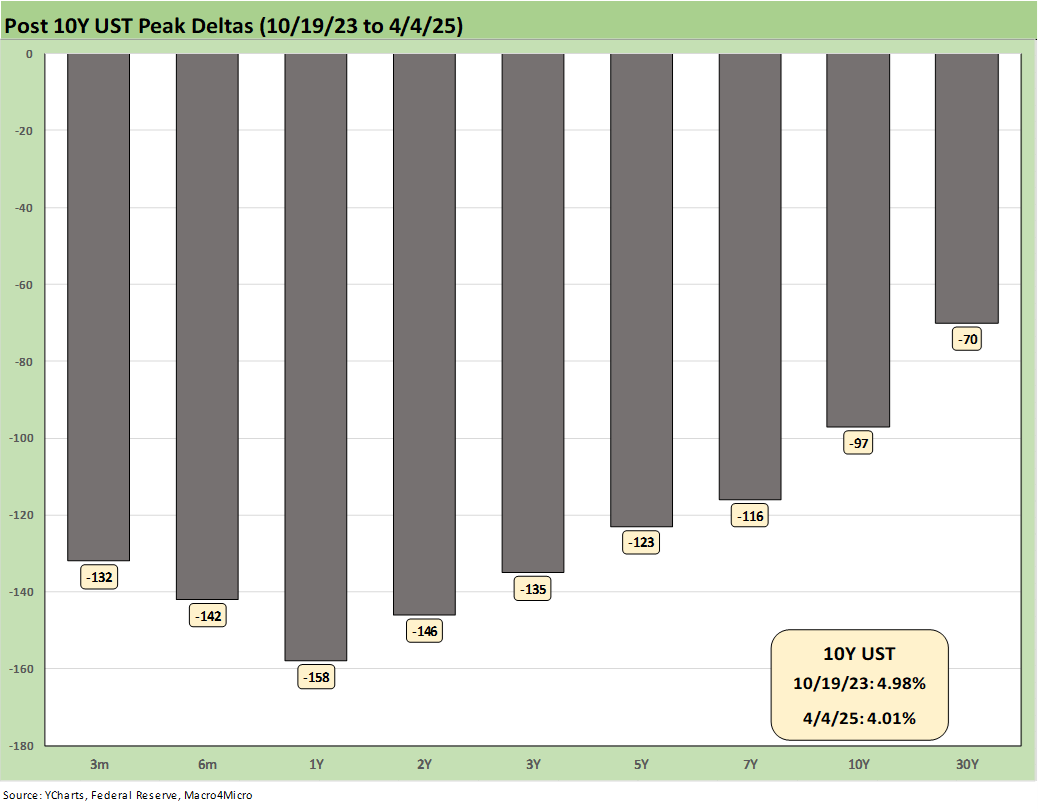
The above UST deltas update the downshift from the post-UST peak. As the crow flies, that is still a very healthy bull steepening. People will scream for help from the Fed on the front end, but a side effect of the Trump Tariffs is that his actions will make that harder to do. Trump has put “stag” in the inflation equation.
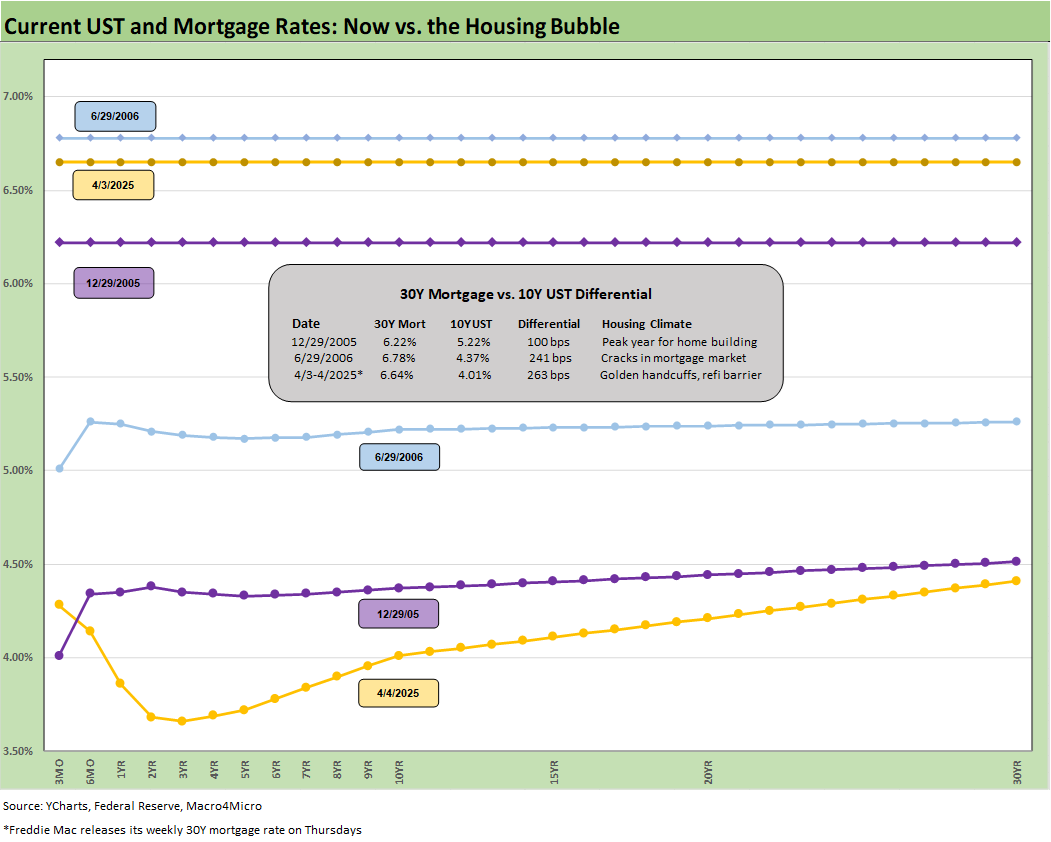
The above chart updates the UST curve for this past Friday and Freddie Mac 30Y Mortgage benchmark rate (noon Thursday release). We include two useful historical periods including the peak homebuilder year end of 2005 and mid-2006 when RMBS quality concerns were catching headlines as the housing bubble was peaking. We post UST curves for each period in the chart.
We recently added a column detailing the differential between the Freddie Mac 30Y and the 10Y UST. We saw that differential move higher this week to +263 bps. The year 2005 makes a statement on what the mortgage market was like in 2005 in terms of originating “anything” and selling to “anyone” to bundle it and resell it to “anyone else.”
We are seeing mortgage rates very slowly coming down again to the mid-6% area with this past week at 6.64% (-1 bps from the prior week). There was very little movement on Friday looking at other benchmarks. Mortgage spreads remain a headwind vs. earlier periods even if mortgages are down from the sharp rise (up to 7%) seen after the Sept 2024 lows.
The materially lower UST curve and 10Y UST now vs. 2006 still sees current mortgage rates closer to but slightly below mid-2006. Dec 2005’s Freddie Mac 30Y rate at 6.22% is well below current mortgage rates despite a slightly higher 10Y UST in Dec 2005 vs. the past Friday close. Back in Dec 2005, the Freddie 30Y at 6.22% was only 100 bps above the 10Y UST.
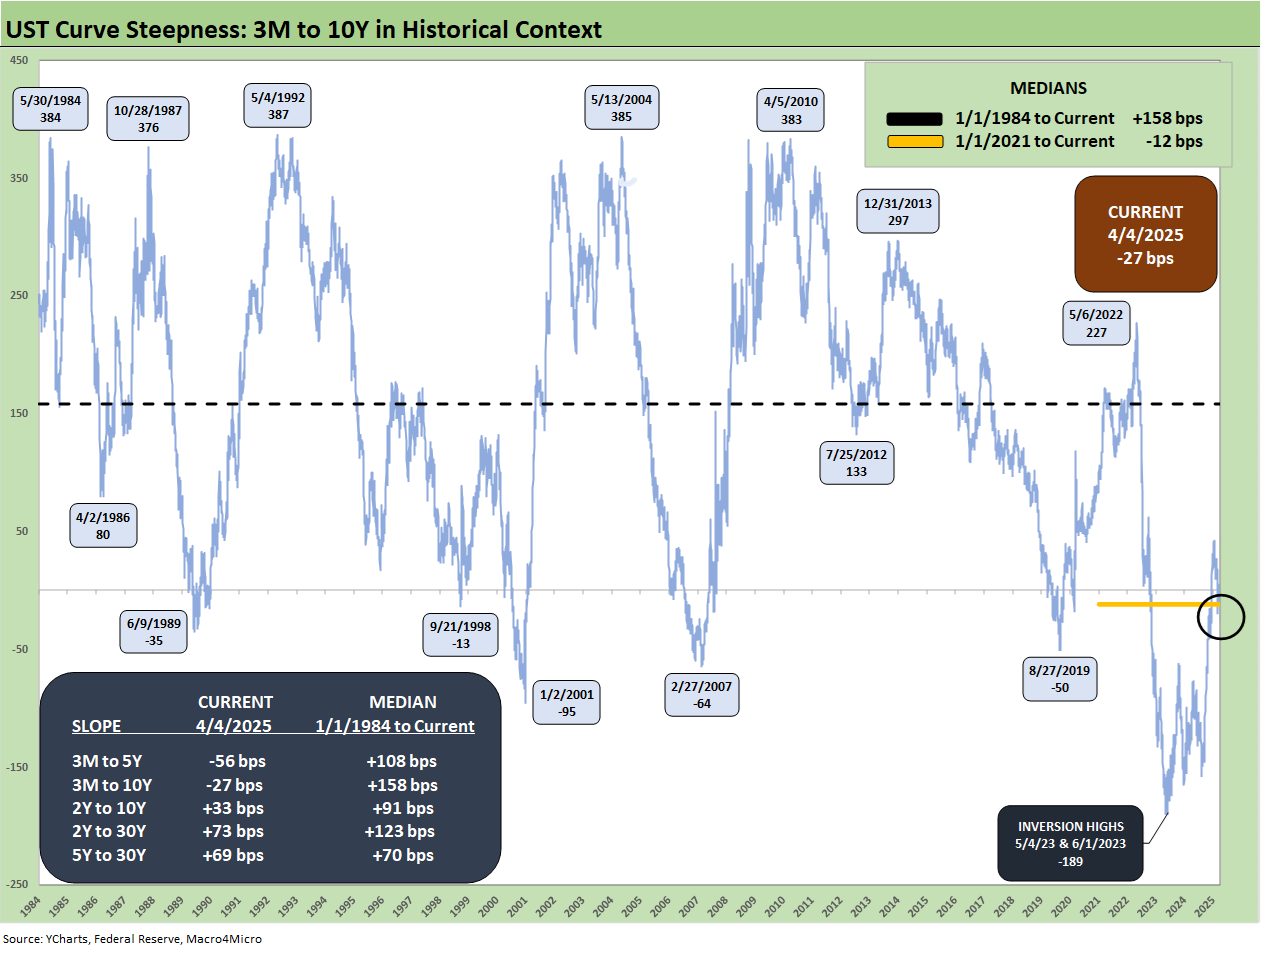
The above chart updates the 3M to 10Y UST slope since 1984. We are in a steeper inversion mode again at -27 bps vs. last week’s -6 bps and the long-term median of +158 bps.
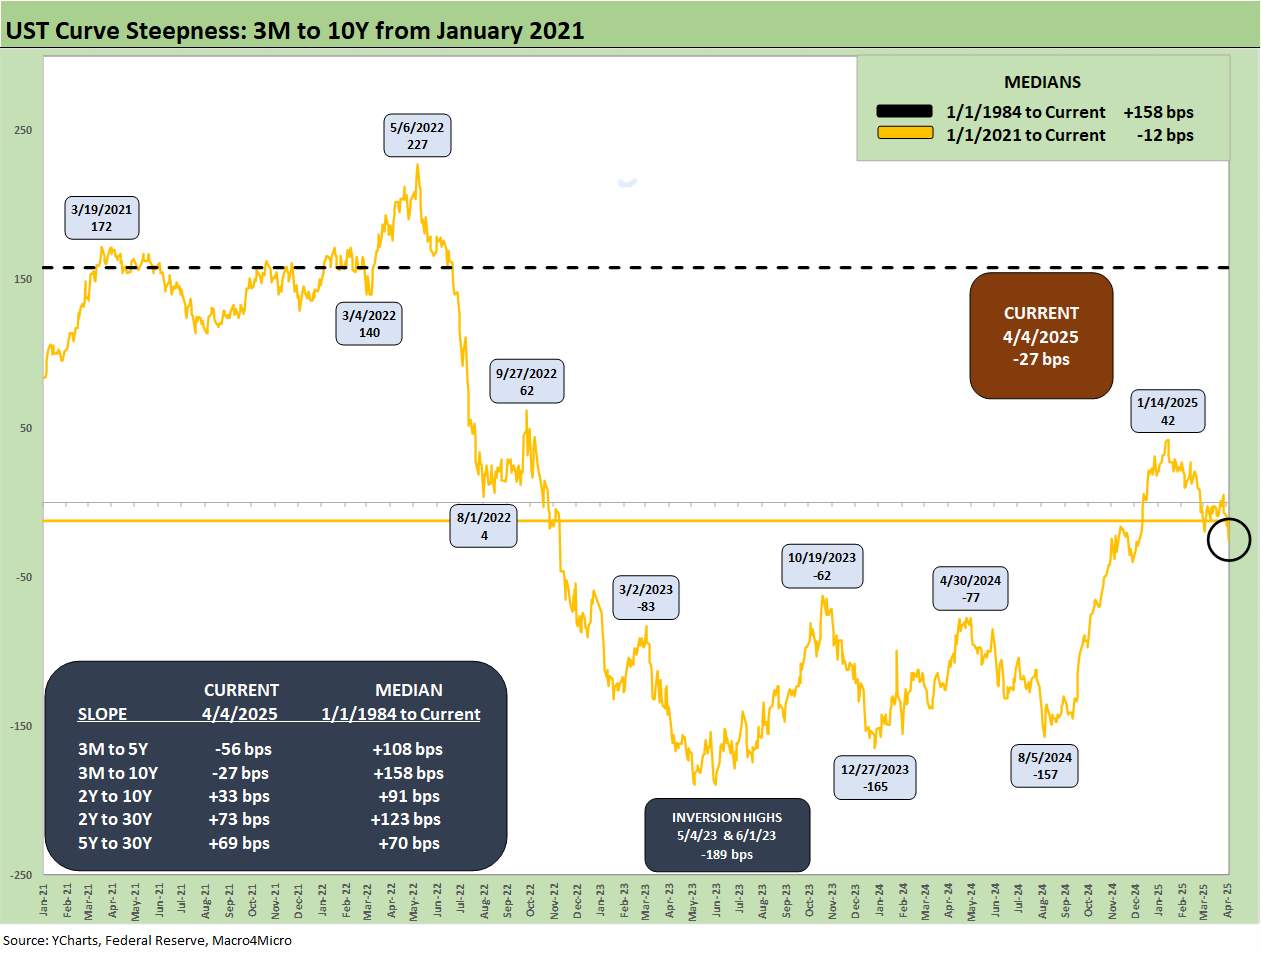
The above timeline starts with the ZIRP period of early 2021 and gives better granularity on the journey across the tightening and easing cycles. We see a +227 bps peak slope and a peak inversion of -189 bps.
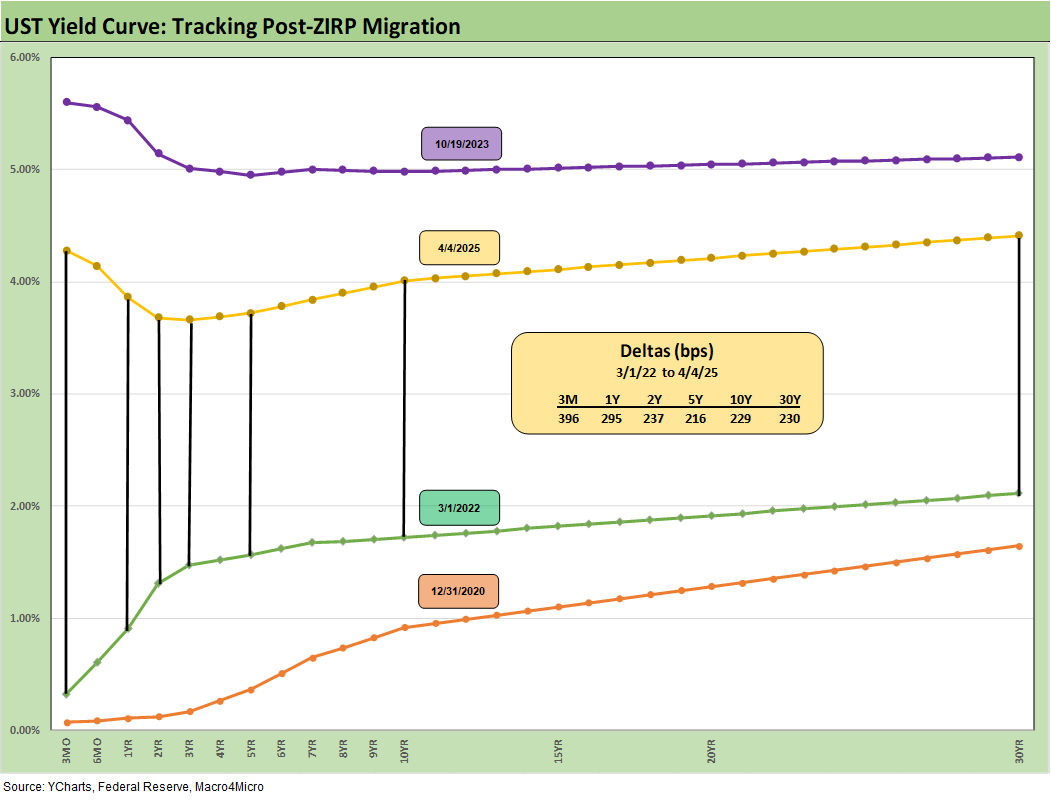
We wrap this week’s State of Yields with an update of the running UST deltas since March 1, 2022 just ahead of the end of ZIRP (effective 3-17-22). We include the 12-31-20 UST curve and 10-19-23 peak UST curve as frames of reference.
See also:
Footnotes & Flashbacks: Asset Returns 4-6-25
Mini Market Lookback: A Week for the History Books 4-5-25
Payroll March 2025: Last Call for Good News? 4-4-25
Payrolls Mar 2025: Into the Weeds 4-4-25
Credit Snapshot: AutoNation (AN) 4-4-25
Credit Snapshot: Taylor Morrison Home Corp (TMHC) 4-2-25
JOLTS Feb 2025: The Test Starts in 2Q25 4-2-25
Credit Snapshot: United Rentals (URI) 4-1-25
Footnotes & Flashbacks: Credit Markets 3-31-25
Footnotes & Flashbacks: State of Yields 3-30-25
Footnotes & Flashbacks: Asset Returns 3-30-25
Mini Market Lookback: The Next Trade Battle Fast Approaches 3-29-25
PCE Feb 2025: Inflation, Income, Outlays 3-28-25
Auto Tariffs: Questions to Ponder 3-28-25
4Q24 GDP: The Final Cut 3-27-25
Durable Goods February 2025: Preventive Medicine? 3-26-25
New Homes Sales Feb 2025: Consumer Mood Meets Policy Roulette 3-25-25
KB Home 1Q25: The Consumer Theme Piles On 3-25-25
Lennar: Cash Flow and Balance Sheet > Gross Margins 3-24-25
Mini Market Lookback: Fed Gut Check, Tariff Reflux 3-22-25
Existing Homes Sales Feb 2025: Limping into Spring 3-20-25
Fed Action: Very Little Good News for Macro 3-19-25
Industrial Production Feb 2025: Capacity Utilization 3-18-25
Housing Starts Feb 2025: Solid Sequentially, Slightly Soft YoY 3-18-25
Retail Sales Feb 2025: Before the Storm 3-17-25
Mini Market Lookback: Self-Inflicted Vol 3-15-25
Credit Spreads: Pain Arrives, Risk Repricing 3-13-25
CPI Feb 2025: Relief Pitcher 3-12-25
JOLTS Jan 2025: Old News, New Risks in the Market 3-11-25
Credit Spreads Join the Party 3-10-25
Mini Market Lookback: Tariffs Dominate, Geopolitics Agitate 3-8-25
Payrolls Feb 2025: Into the Weeds 3-7-25
Employment Feb 2025: Circling Pattern, Lower Altitude 3-7-25
Gut Checking Trump GDP Record 3-5-25
Trump's “Greatest Economy in History”: Not Even Close 3-5-25
Asset Returns and UST Update: Pain Matters 3-5-25
Mini Market Lookback: Collision Courses ‘R’ Us 3-2-25
Tariff and Trade links:
Tariffs: Diminished Capacity…for Trade Volume that is…4-3-25
Reciprocal Tariff Math: Hocus Pocus 4-3-25
Reciprocal Tariffs: Weird Science Blows up the Lab 4-2-25
Tariffs: Stop Hey What’s That Sound? 4-1-25
Tariffs are like a Box of Chocolates 4-1-25
Auto Tariffs: Questions to Ponder 3-28-25
Fed Gut Check, Tariff Reflux 3-22-25
Tariffs: Strange Week, Tactics Not the Point 3-15-25
Trade: Betty Ford Tariff Wing Open for Business 3-13-25
CPI Feb 2025: Relief Pitcher 3-12-25
Auto Suppliers: Trade Groups have a View, Does Washington Even Ask? 3-11-25
Tariffs: Enemies List 3-6-25
Happy War on Allies Day 3-4-25
Auto Tariffs: Japan, South Korea, and Germany Exposure 2-25-25
Mini Market Lookback: Tariffs + Geopolitics + Human Nature = Risk 2-22-25
Reciprocal Tariffs: Weird Science 2-14-25
US-EU Trade: The Final Import/Export Mix 2024 2-11-25
Aluminum and Steel Tariffs: The Target is Canada 2-10-25
US-Mexico Trade: Import/Export Mix for 2024 2-10-25
Trade Exposure: US-Canada Import/Export Mix 2024 2-7-25
US Trade with the World: Import and Export Mix 2-6-25
The Trade Picture: Facts to Respect, Topics to Ponder 2-6-25
Tariffs: Questions to Ponder, Part 1 2-2-25
US-Canada: Tariffs Now More than a Negotiating Tactic 1-9-25
Trade: Oct 2024 Flows, Tariff Countdown 12-5-24
Mexico: Tariffs as the Economic Alamo 11-26-24
Tariff: Target Updates – Canada 11-26-24
Tariffs: The EU Meets the New World…Again…Maybe 10-29-24
Trump, Trade, and Tariffs: Northern Exposure, Canada Risk 10-25-24
Trump at Economic Club of Chicago: Thoughts on Autos 10-17-24
Facts Matter: China Syndrome on Trade 9-10-24
Tariffs: Questions that Won’t Get Asked by Debate Moderators 9-10-24
The Debate: The China Deficits and Who Pays the Tariff? 6-29-24
Trade Flows: More Clarity Needed to Handicap Major Trade Risks 6-12-24
Trade Flows: Deficits, Tariffs, and China Risk 10-11-23