Footnotes & Flashbacks: Credit Markets 3-24-25
An extremely calm week in spreads with some modest equity rallies, but the tariff rollout and threats are ahead.
Guess the methodology!? Show me the reciprocal tariff!?
The week offered some easing of market tension despite the FOMC projections showing inflation, GDP growth, and employment all moving in a negative direction. Holding the median fed funds target for 2025 flat to the Dec 2024 projection came with a split vote with 9 votes at 2 cuts set against 4 votes for zero cuts and 4 votes for 1 cut. 2 more votes were more than 2 cuts (see Fed Action: Very Little Good News for Macro 3-19-25).
Today’s equity rally is tied to rumors of some tariff pullback and exceptions as Trump continues to indulge himself by wagging world leaders despite the toll on markets, consumer sentiment, and capex planning in the private sector.
Selective leaks on postponed rollouts, exemptions, and the hope for more time lags from slow-rolling the reciprocal review and playing with effective dates will make for another week of speculation.
In the end, painful tariffs are more a matter of “when” and not “if.” The pause button in capital budgets can be patient, but it will be bad at the macro level. Now if anyone can just get Trump to admit the “buyer pays.”
The above chart updates the running 1-week and 1-month OAS deltas across IG vs. HY and from the BBB tier down to the CCC tier. The tradition of quality spread widening as cyclical fundamentals get questionable is not a new phenomenon by any stretch, but this current credit cycle was featuring HY OAS levels in the June 2007 bucket. That starting point made for even worse risk symmetry.
The market broke out of those June 2007 credit spread bands in the recent bout of tariff volatility and erratic headlines on trade (see Credit Spreads: Pain Arrives, Risk Repricing 3-13-25, Credit Spreads Join the Party 3-10-25). We see that widening impact in the poor excess returns in the next chart.
The above chart updates the running YTD total return and excess return performance for IG and HY and the credit tiers. Duration and IG have carried the day, and the excess returns are not working YTD.
IG OAS was slightly tighter by -2 bps on the week to +92 bps. IG pricing doesn’t move the needle much on credit signals with double digit IG spreads still more in common with past credit market peaks.
HY OAS has moved a long way in a short time, but +321 bps (-4 bps tighter on the week) also looks more like cyclical low points in spreads such as Jan 2020, Oct 2018, and June 2014. There is certainly plenty to worry about in the macro picture, and HY OAS is 141 bps below the long-term median. That is tough symmetry.
The “HY minus IG OAS differential” shows the HY-IG quality spread differential of +229 bps (- 2 bps on the week), which is 96 bps below the long-term median. We are now well above the extremely rare sub-200 bps threshold, but quality spread de-compression remains a high risk with tariff reality on the horizon.
The “BB OAS minus BBB OAS” quality spread differential tightened -3 bps on the week to +85 bps for a level 49 bps inside the long-term median.
The BB OAS tightened by -5 bps on the week to barely inside the seldom-crossed +200 bps threshold.
The B tier at +328 bps (-5 bps on the week) is 138 bps inside the long-term median. The B tier is also inside the bubble period median of 2001-2007 (+397 bps) even if current B tier OAS has broken outside the June 2007 range that saw that peak month close just inside the +300 bps line.
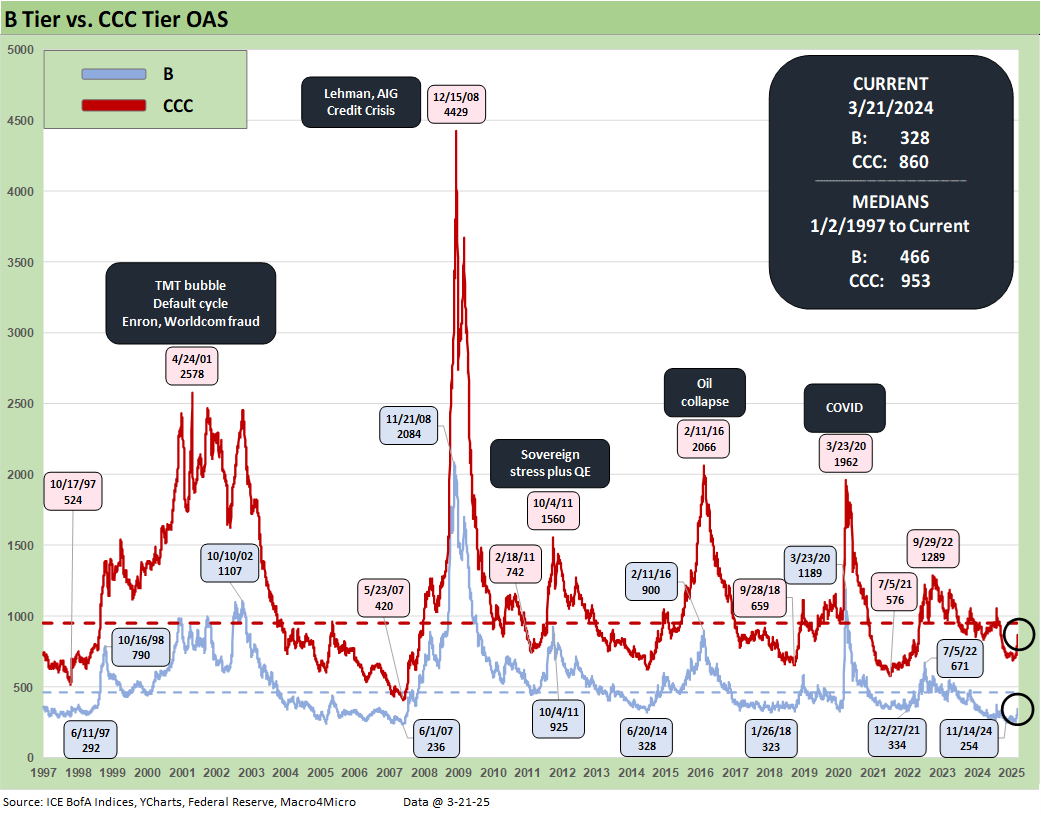
The above chart updates the comparative histories of the B tier and CCC tier and highlights major points of divergence between the two. The current CCC OAS of +860 bps has widened by +135 bps over the trailing month but is still inside the +953 bps long-term median.
The B tier is +60 bps wider the past month and +32 bps YTD. The CCC is +114 bps wider YTD. The CCC tier is always subject to the constituent migration patterns including dropouts (defaults) and exchanges (coercive or otherwise) that can move the needle (see The B vs. CCC Battle: Tough Neighborhood, Rough Players 7-7-24).
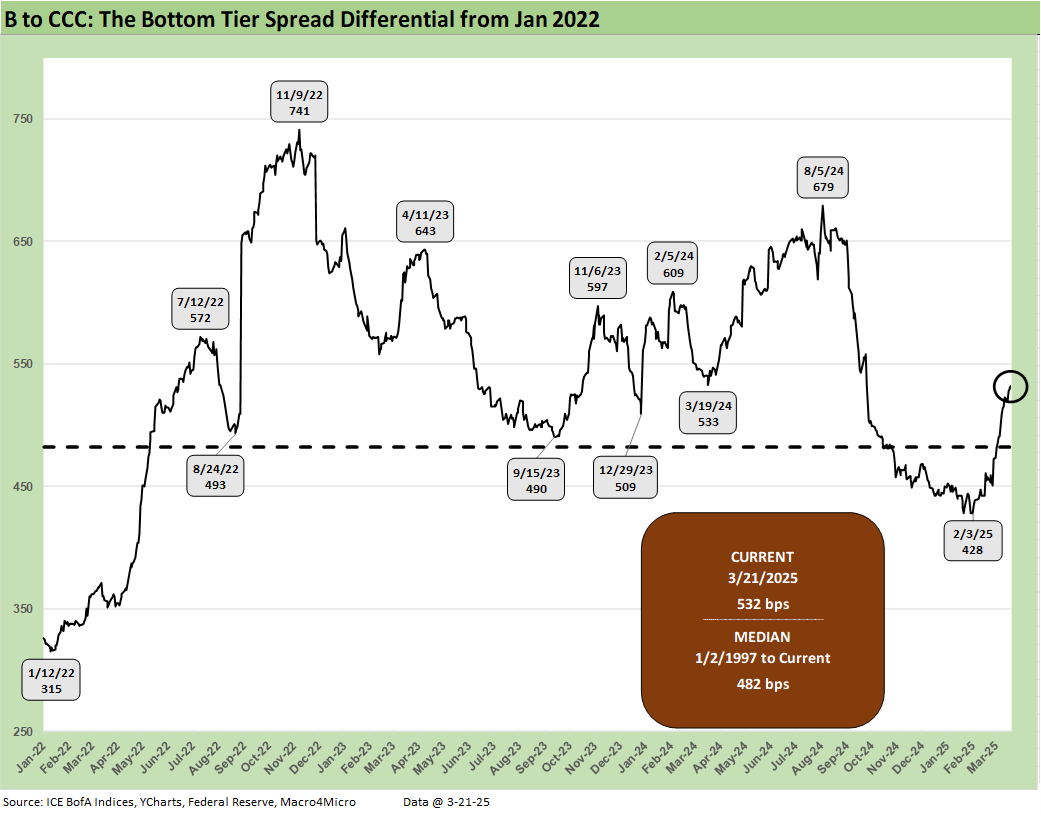
The above chart shortens the timeline from the period just before the March 2022 tightening cycle for better visuals on more recent B vs. CCC OAS action.
The quality spread differential of “CCC OAS minus B OAS” of +532 bps is wide to the +482 bps long-term median. The differential had narrowed impressively since the peak of +741 bps during the cyclical anxiety period of the tightening cycle in fall 2022. Some of that tightening is tied to index exits and some to distressed exchanges but also to a broader risk rally that has been erratic of late, but generally mirrored in equities and other credit markets this past year.
The current +532 bps quality spread differential is materially wide to 4 of the 6 timeline medians broken out in the box with the notable exception of the TMT bubble and collapse of that market into early 2001. The current level is also very slightly inside the “COVID to current” median of +533 bps.
The above chart zeroes in on the 2022-2025 timeline for the CCC-B tier quality spread differential. The constituent shifts across some notable exchanges and dropouts and a major credit rally are evident in multiple material swings along the way. Executing on distressed exchanges has generated its share of headlines (e.g. Carvana) but much less than would have been seen if inflation had held in longer and even more tightening was needed.
A look at yields…
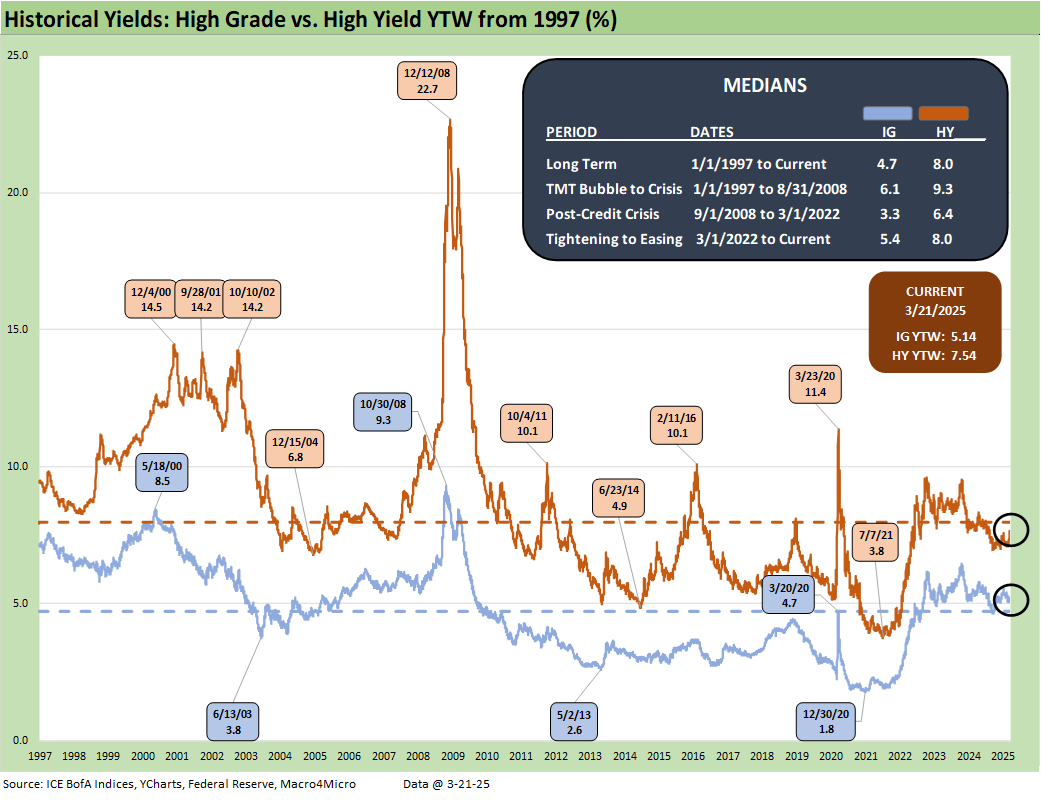
The HY index and IG index yield histories swung around with the credit cycles but were notably distorted across the ZIRP and QE years after late 2008. The current yield curve backdrop is very distinct now but still are best framed against the pre-ZIRP years.
We regularly make the case that the 9.3% pre-crisis (pre-ZIRP) median for HY and 6.1% in IG make for the most relevant frames of reference. That is backed up by framing median spreads vs. current spreads and index yield benchmarks.
Current yields for HY of 7.54% and 5.14% for IG reflect the low UST levels relative to past cycles as well as historically tight spreads (even if no longer as close to the all-time lows).
Median spreads would put all-in yields in HY closer to pre-crisis medians, so that is a frame of reference for historical context. For example, the long-term median for HY OAS is +141 bps above the current HY OAS of +321 bps. For simplicity’s sake, if we add the +141 bps differential of the current HY OAS vs. the long-term median to the current HY Index YTW we get to just under the 9% line. In other words, we are in the zone with the lower UST being the swing factor.
The above chart frames IG index yields and the related UST curve for the Friday close. We include two useful comps from prior credit cycle peaks in June 2007 and Dec 1997 for some credit cycle peak context. Those periods in 1997 and 2007 reflect market backdrops when credit markets were hot, risk appetites high, and spreads were down near multiyear lows.
For IG yields, the relative yield story is heavily dictated by the UST curve differentials with spreads tight in all three markets. For those who believe the post-crisis ZIRP was an anomaly, the current UST curve is exceptionally low in historical context (see Footnotes & Flashbacks: State of Yields 3-23-25).
The above chart does the same drill as the prior chart but for HY index yields. The low UST curve vs. history and extremely tight spreads put the current HY index yield below the earlier peak credit cycles. The volatility of 1998 and the experience of late 2007 on the way into the 2008 crisis period offer reminders that risk repricing can come on with vengeance. That was true in earlier cycles as well (1990 as securities firms started to collapse including Drexel Chapter 11 in Feb 1990 and bridge loan related bailouts of Shearson Lehman, First Boston, and Kidder Peabody).
The summer of 2007 was the start of major problems in the credit markets, but the equity markets and S&P 500 and NASDAQ kept on rallying into Oct 2007. Later in the turmoil and well after the fact, the start of the recession was tagged as Dec 2007 (see Business Cycles: The Recession Dating Game 10-10-22).
The 2007 experience reminded the market that credit leads the cycle and equity lags. The same was true in 1999 with the HY default cycle underway and NASDAQ at +86% that year.
See the Select Histories links below for anyone who wants to revisit good and bad old days.
See also:
Lennar: Cash Flow and Balance Sheet > Gross Margins 3-24-25
Footnotes & Flashbacks: State of Yields 3-23-25
Footnotes & Flashbacks: Asset Returns 3-23-25
Mini Market Lookback: Fed Gut Check, Tariff Reflux 3-22-25
Existing Homes Sales Feb 2025: Limping into Spring 3-20-25
Fed Action: Very Little Good News for Macro 3-19-25
Industrial Production Feb 2025: Capacity Utilization 3-18-25
Housing Starts Feb 2025: Solid Sequentially, Slightly Soft YoY 3-18-25
Retail Sales Feb 2025: Before the Storm 3-17-25
Footnotes & Flashbacks: Credit Markets 3-17-25
Footnotes & Flashbacks: State of Yields 3-16-25
Footnotes & Flashbacks: Asset Returns 3-16-25
Mini Market Lookback: Self-Inflicted Vol 3-15-25
Credit Spreads: Pain Arrives, Risk Repricing 3-13-25
Trade: Betty Ford Tariff Wing Open for Business 3-12-25
CPI Feb 2025: Relief Pitcher 3-12-25
JOLTS Jan 2025: Old News, New Risks in the Market 3-11-25
Credit Spreads Join the Party 3-10-25
Mini Market Lookback: Tariffs Dominate, Geopolitics Agitate 3-8-25
Payrolls Feb 2025: Into the Weeds 3-7-25
Employment Feb 2025: Circling Pattern, Lower Altitude 3-7-25
Gut Checking Trump GDP Record 3-5-25
Trump's “Greatest Economy in History”: Not Even Close 3-5-25
Asset Returns and UST Update: Pain Matters 3-5-25
Mini Market Lookback: Collision Courses ‘R’ Us 3-2-25
PCE Jan 2025: Prices in Check, Income and Outlays Diverge 2-28-25
Tariff links:
For Anti-Coercion Instrument See: Fed Gut Check, Tariff Reflux 3-22-25
Tariffs: Strange Week, Tactics Not the Point 3-15-25
Trade: Betty Ford Tariff Wing Open for Business 3-13-25
CPI Feb 2025: Relief Pitcher 3-12-25
Auto Suppliers: Trade Groups have a View, Does Washington Even Ask? 3-11-25
Tariffs: Enemies List 3-6-25
Happy War on Allies Day 3-4-25
Auto Tariffs: Japan, South Korea, and Germany Exposure 2-25-25
Mini Market Lookback: Tariffs + Geopolitics + Human Nature = Risk 2-22-25
Reciprocal Tariffs: Weird Science 2-14-25
US-EU Trade: The Final Import/Export Mix 2024 2-11-25
Aluminum and Steel Tariffs: The Target is Canada 2-10-25
US-Mexico Trade: Import/Export Mix for 2024 2-10-25
Trade Exposure: US-Canada Import/Export Mix 2024 2-7-25
US Trade with the World: Import and Export Mix 2-6-25
The Trade Picture: Facts to Respect, Topics to Ponder 2-6-25
Tariffs: Questions to Ponder, Part 1 2-2-25
US-Canada: Tariffs Now More than a Negotiating Tactic 1-9-25
Trade: Oct 2024 Flows, Tariff Countdown 12-5-24
Mexico: Tariffs as the Economic Alamo 11-26-24
Tariff: Target Updates – Canada 11-26-24
Select Histories:
Annual and Monthly Asset Return Quilt 2024 Final Score 1-02-25
Spread Walk 2024 Final Score 1-2-25
HY and IG Returns since 1997: Four Bubbles and Too Many Funerals 12-31-24
HY OAS Lows Memory Lane: 2024, 2007, and 1997 10-8-24
The B vs. CCC Battle: Tough Neighborhood, Rough Players 7-7-24
HY Spreads: Celebrating Tumultuous Times at a Credit Peak 6-13-24
Credit Markets Across the Decades 4-8-24
Credit Cycles: Historical Lightning Round 4-8-24
Histories: Asset Return Journey from 2016 to 2023 1-21-24
HY Multicycle Spreads, Excess Returns, Total Returns 12-15-23
HY Credit Spreads: Migration, Medians, and Misdirection 11-6-23
Credit Spreads: Proportions Matter in Risk Compensation 8-14-23
Fed Funds vs. Credit Spreads and Yields Across the Cycles 6-19-23
Wild Transition Year: The Chaos of 2007 11-1-22
Greenspan’s Last Hurrah: His Wild Finish Before the Crisis 10-30-22


