
Footnotes & Flashbacks: State of Yields 3-23-25
A rally in the UST curve ahead of the coming tariff pricing discovery and the GDP growth debate.

You the buyer? Just drop the tariff here…the last dope thought the seller paid!
The UST rally will soon get tested on the slowdown vs. inflation vs. stagflation juggling act. The push-pull on the UST curve showed up in the FOMC leaving its target unchanged from Dec.
The Fed lowered its GDP growth forecast and raised inflation expectations (Headline PCE and Core PCE) in its latest meeting and dot plot, so “uncertainty” reigns. The Fed projections on inflation follow the UMich metrics and the material hike in consumer inflation expectations. Those bumped higher even as the Fed turned back to the use of the word “transitory” - this time on tariffs (see Fed Action: Very Little Good News for Macro 3-19-25).
Economists’ semantic games are back with a blurring of “transitory” while they duck the simple question of “Does purchasing power increase or decrease with high tariffs for the consumer? Yes or No?” If “Yes,” how does the consumer close the gap? The good news is the 2nd grade math club answered “Yes, purchasing power declines.” The 3rd grade math club said “Depends on currencies.” No one asked the Fed that “purchasing power” question, so they opined on inflation to be safe.
With Canada and the EU (notably Germany) looking to ramp up spending and borrowing, the time-honored question remains: “If everyone is a borrower, who are the lenders?” Add to that list “If the EU and Canada end up hating the US, do they opt for being a lender just to the home team and not the UST?” Same question with Japan if they get slammed with auto tariffs.

The above chart updates the historical UST migration from the Carter inversion of 1978 and then across the Volcker years into the wild credit cycle and monetary excitement of the other transition periods that we highlight in this chart each week. As the crow flies, we have been in a bear steepening mode from 2Y to 30Y since the Sept 2024 low despite the flattener YTD 2025.

The above chart updates the migration across the period from ZIRP at the end of 2021 and then across the tightening cycle and then into easing mode. We include memory boxes with the tightening cycle, as well as the easing of 4Q24 with dates and magnitude. Despite the fall 2024 rally after a bear steepener in 1H24, we see the Friday UST curve at the top of the curves detailed above.

The above chart updates the ride from the 10-19-23 peak into the impressive year end 2023 rally before the eventual decline to recent lows in Sept 2024 when the easing cycle started. That bull steepener move did not last long with the UST curve then moving once again into a bear steepener into 2025.

We update the 1-week UST deltas above with another mild shift lower. That comes even with the FOMC holding the line this past week at the same time they raised inflation forecasts for Headline PCE and for Core PCE (see Fed Action: Very Little Good News for Macro 3-19-25). We get a fresh read on PCE this coming week.

The YTD deltas are broken out above, and we see where the UST curve has rewarded duration (see Footnotes & Flashbacks: Asset Returns 3-23-25).

The running deltas from the September 2024 lows (9-16-24) are updated above. We see a return to another bear steepening in the shapeshifting and steepening into 2025. Many questions remain after the FOMC meeting last week with the macro variables (inflation, GDP growth, unemployment) all moving in an adverse direction. Even with those projections, the consensus median for fed funds remained unchanged with 9 votes for 2 cuts while no cuts and 1 cut each received 4 votes.
The months ahead will bring some clarity to the picture on where many of the tariffs will start and which will be “stacked” (as in 25% blanket tariff on a nation plus 25% on top of that for a product group). We will get some idea what exemptions can be gained. Then it is a matter of sorting out what is just damaging to the cycle and payroll from tariffs and what is potentially inflationary and whether it all adds up to stagflationary.

We update the UST deltas above from the post-peak UST rally in Nov-Dec 2023. We then rolled into a very mixed 2024 that went into a bear steepener in 1H24 and then a rally into the easing period low point that we capture in an earlier chart. The UST curve then moved back to what we see above for the 2024 and YTD 2025 steepener.

The UST deltas above update the running changes from the 10-19-23 peak. By any measure, that shift was a material bull steepener. The stall in easing will be a focal point if the tariffs continue to take the economy down a slowdown path on the consumer side and along the fixed investment lines. It is way too early to rule out stagflation.

The above chart updates the UST curve for this past Friday and Freddie Mac 30Y Mortgage benchmark rate (noon Thursday release). We include two useful historical periods including the peak homebuilder year end of 2005 and mid-2006 when RMBS quality concerns were catching headlines as the housing bubble was peaking. We post UST curves for each period in the chart.
This week we add a column detailing the differential between the Freddie Mac 30Y and the 10Y UST. The year 2005 makes a statement on what the mortgage market was like in 2005 in terms of originating “anything” and selling it with ease to someone to package and resell.
Today, we are seeing mortgage rates slowly coming down again to the mid-6% area with this past week at 6.67% (+2 bps from the prior week). The mortgage spreads remain a headwind vs. earlier periods even if mortgages are down from the sharp rise from the Sept 2024 lows.
The materially lower UST curve and 10Y UST now vs. 2006 still see current mortgage rates closer to but slightly below mid-2006. The Dec 2005 Freddie Mac 30Y rate at 6.22% is well below current mortgage rates despite a slightly higher 10Y UST in Dec 2005 vs. the past Friday close. The Freddie 30Y at 6.22% was only 100 bps above the 10Y UST in 2005.
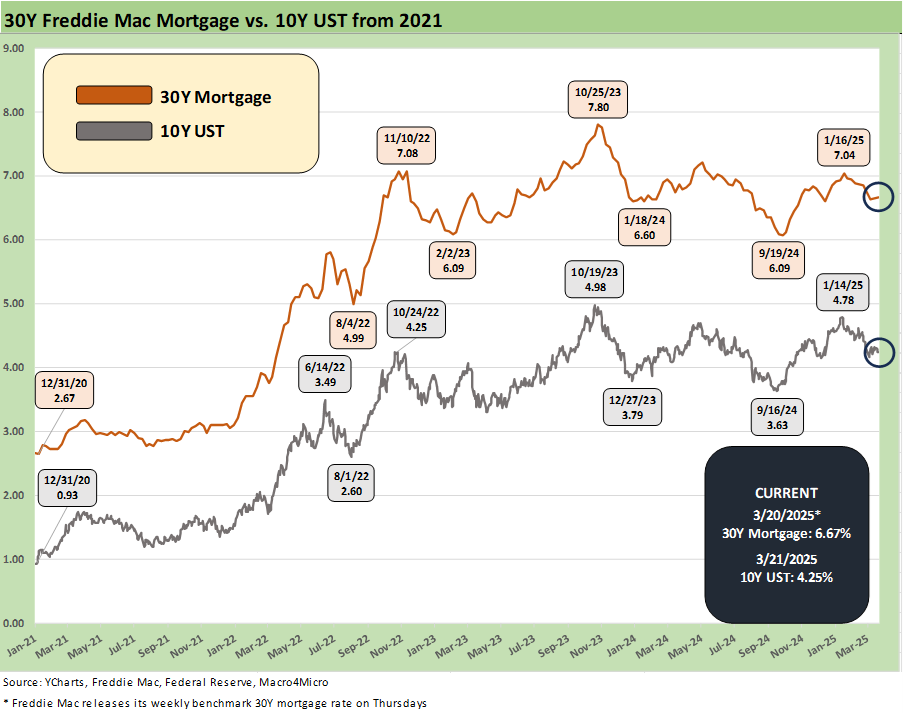
The above chart updated the running 10Y UST and Freddie Mac 30Y mortgage benchmark (we usually include this in the Mini Lookback, but we forgot in an oversight). Waiting for the 10Y UST or mortgage spreads to get back to the low 6% handle area has been rough on the homebuilders and potential homebuyers in the new home market (New Home Sales will be released this coming week).
The higher rates also remain a major braking force on existing home sales with so many current mortgage holders sitting in homes with a mix of 2%, 3% and 4% handle mortgages. We have covered that problem in numerous commentaries, and the world has not changed much on that front with the exception of higher existing inventories with higher prices running alongside (see Existing Homes Sales Feb 2025: Limping into Spring 3-20-25).

We update the 3M to 5Y UST slope since 1984 after the latest FOMC meeting and dot plot. The -33 bps inversion has tongues wagging about recession predictions from inversions again, but a look at the tariff plans will give you more than a few ideas on what might cause it. Companies and consumers are already reacting, but the “buyer pays” pain and retaliation effects are in the immediate future.

We shorten up the slope timeline for the 3M to 5Y slope time series to a starting point of just before the tightening cycle. The current -33 bps slope is a very long way from the +108 bps median even if we get the two cuts.

We wrap this week’s State of Yields with an update of the running UST deltas since March 1, 2022 just ahead of the end of ZIRP (effective 3-17-22). We include the 12-31-20 UST curve and the 10-19-23 peak UST curve as frames of reference.
See also:
Footnotes & Flashbacks: Asset Returns 3-23-25
Mini Market Lookback: Fed Gut Check, Tariff Reflux 3-22-25
Existing Homes Sales Feb 2025: Limping into Spring 3-20-25
Fed Action: Very Little Good News for Macro 3-19-25
Industrial Production Feb 2025: Capacity Utilization 3-18-25
Housing Starts Feb 2025: Solid Sequentially, Slightly Soft YoY 3-18-25
Retail Sales Feb 2025: Before the Storm 3-17-25
Footnotes & Flashbacks: Credit Markets 3-17-25
Footnotes & Flashbacks: State of Yields 3-16-25
Footnotes & Flashbacks: Asset Returns 3-16-25
Mini Market Lookback: Self-Inflicted Vol 3-15-25
Credit Spreads: Pain Arrives, Risk Repricing 3-13-25
Trade: Betty Ford Tariff Wing Open for Business 3-12-25
CPI Feb 2025: Relief Pitcher 3-12-25
JOLTS Jan 2025: Old News, New Risks in the Market 3-11-25
Credit Spreads Join the Party 3-10-25
Mini Market Lookback: Tariffs Dominate, Geopolitics Agitate 3-8-25
Payrolls Feb 2025: Into the Weeds 3-7-25
Employment Feb 2025: Circling Pattern, Lower Altitude 3-7-25
Gut Checking Trump GDP Record 3-5-25
Trump's “Greatest Economy in History”: Not Even Close 3-5-25
Asset Returns and UST Update: Pain Matters 3-5-25
Mini Market Lookback: Collision Courses ‘R’ Us 3-2-25
PCE Jan 2025: Prices in Check, Income and Outlays Diverge 2-28-25
Tariff links:
For Anti-Coercion Instrument See: Fed Gut Check, Tariff Reflux 3-22-25
Tariffs: Strange Week, Tactics Not the Point 3-15-25
Trade: Betty Ford Tariff Wing Open for Business 3-13-25
CPI Feb 2025: Relief Pitcher 3-12-25
Auto Suppliers: Trade Groups have a View, Does Washington Even Ask? 3-11-25
Tariffs: Enemies List 3-6-25
Happy War on Allies Day 3-4-25
Auto Tariffs: Japan, South Korea, and Germany Exposure 2-25-25
Mini Market Lookback: Tariffs + Geopolitics + Human Nature = Risk 2-22-25
Reciprocal Tariffs: Weird Science 2-14-25
US-EU Trade: The Final Import/Export Mix 2024 2-11-25
Aluminum and Steel Tariffs: The Target is Canada 2-10-25
US-Mexico Trade: Import/Export Mix for 2024 2-10-25
Trade Exposure: US-Canada Import/Export Mix 2024 2-7-25
US Trade with the World: Import and Export Mix 2-6-25
The Trade Picture: Facts to Respect, Topics to Ponder 2-6-25
Tariffs: Questions to Ponder, Part 1 2-2-25
US-Canada: Tariffs Now More than a Negotiating Tactic 1-9-25
Trade: Oct 2024 Flows, Tariff Countdown 12-5-24
Mexico: Tariffs as the Economic Alamo 11-26-24
Tariff: Target Updates – Canada 11-26-2